Sweetgreen PESTLE Analysis

Make Smarter Strategic Decisions with a Complete PESTEL View
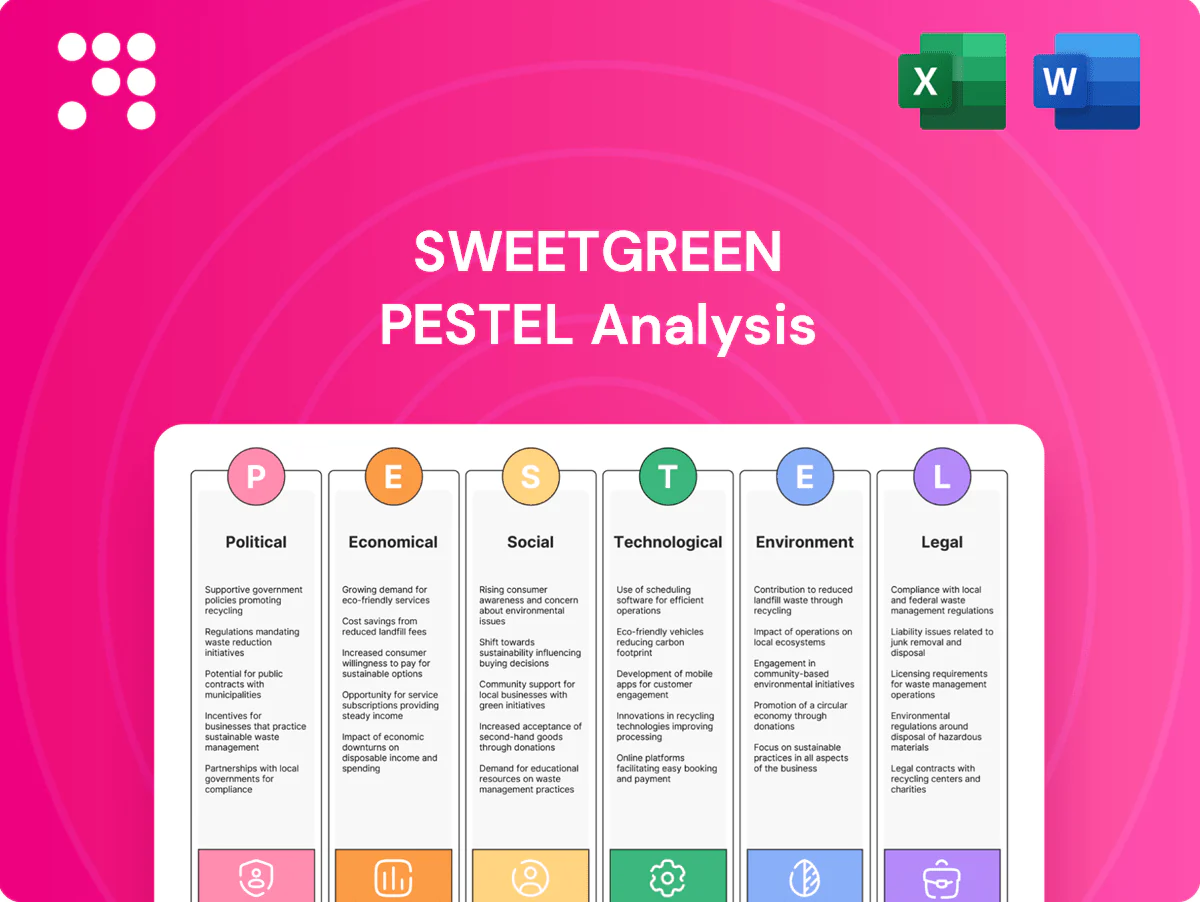
Unlock competitive advantage with our PESTLE Analysis of Sweetgreen—three to five concise, actionable insights into political, economic, social, technological, legal, and environmental forces shaping the brand. Ideal for investors, strategists, and consultants, this ready-to-use report translates external trends into clear risks and opportunities. Purchase the full analysis for the complete, editable breakdown and immediate strategic value.
Political factors

Food safety oversight
FDA/USDA rules, local health codes and the FSMA/ FDA Food Traceability Rule force Sweetgreen to tighten sourcing, handling and kitchen workflows for salads and bowls, increasing supplier certification demand (GFSI‑recognized schemes like SQF/BRC) and end‑to‑farm traceability. Compliance audits and staff food‑safety training add recurring costs—often thousands per site—and CDC estimates US foodborne illness costs about $15.6B annually. Stricter pathogen controls or recalls can abruptly halt SKUs and disrupt supply chains, raising remediation and lost‑sales exposure.
Farm and trade policies
Agricultural subsidies (US government payments about $31B in 2023) and tariffs/import rules materially affect produce pricing and cross-border availability, feeding into Sweetgreen's input costs versus retail revenues (Sweetgreen reported $874M revenue in 2023). Reliance on seasonal, local supply increases exposure to policy shifts and weather-driven volatility. Immigration and farm labor rules—H-2A certifications reached ~336,000 positions in 2023—raise upstream labor costs. Sweetgreen mitigates risk via diversified regional sourcing and supplier networks.

Minimum wage agendas
City and state minimum wage hikes directly pressure Sweetgreen unit labor margins; federal minimum wage remains $7.25 (2025) while cities such as Seattle and San Francisco enforce floors above $17–18/hr.
Markets with aggressive floors (>17–18/hr) compress margins versus moderate regimes ($12–15/hr); restaurant labor typically runs 25–35% of sales, so a $2–3/hr increase can shave several EBITDA points per unit.
Pricing power, menu engineering and productivity levers — optimized kitchen design, digital ordering and throughput gains — can offset costs as political momentum for living-wage legislation persists across many metros through 2025.

Urban planning and permits
Zoning, permitting and outdoor-dining rules shape Sweetgreen store format choices—urban, campus or suburban—because municipal approvals often take 3–9 months and fees commonly range from 500–10,000 per permit, with negotiated community benefits sometimes adding 0.5–2% of project costs; delays increase pre-opening rent and buildout carrying costs, creating speed-to-market risk that pushes the company toward sites with simpler mixed-use or retail zoning and pre-approved curbside/outdoor dining allowances.
- permit-timeline: 3–9 months
- permit-fees: 500–10,000
- CBA impact: 0.5–2% project cost
- site-strategy: prefer mixed-use, transit/bike corridors
- transit/bike: proximity boosts footfall, lowers parking needs
Public health initiatives
Government nutrition programs and the FDA menu-labeling rule (calorie disclosure for chains with 20+ locations since 2018) increase demand for Sweetgreen's transparent, low-calorie offerings; CDC adult obesity prevalence 41.9% (2020) further drives policy-backed healthy-eating shifts. Sugar/salt reduction campaigns and USDA school meal standards (Healthy, Hunger-Free Kids Act) align with Sweetgreen’s menu; labeling or nutrient caps could constrain reformulation costs but open workplace/school partnership revenue opportunities.
Foodborne costs $15.6B/yr and wage hikes squeeze produce margins
Regulation-driven food safety (FSMA traceability, recalls) raises supplier-certification and site audit costs; US foodborne illness costs ~15.6B/yr. Agricultural policy/tariffs and $31B farm subsidies (2023) affect produce pricing vs Sweetgreen revenue $874M (2023). Minimum-wage hikes (city floors >17–18/hr) compress unit margins; H-2A roles ~336k (2023) tighten farm labor.
| Metric | Value |
|---|---|
| Revenue (2023) | $874M |
| Foodborne cost | $15.6B/yr |
| Farm subsidies (2023) | $31B |
| H-2A roles (2023) | ~336,000 |
What is included in the product
 Detailed Word Document
Explores how macro-environmental factors uniquely affect Sweetgreen across Political, Economic, Social, Technological, Environmental, and Legal dimensions, with data-driven insights and trend analysis tailored to the fast-casual salad sector. Designed for executives and investors, the report identifies specific threats, opportunities, and forward-looking scenarios to guide strategy, funding, and operational decisions.

 Customizable Excel Spreadsheet
A concise, visually segmented PESTLE summary for Sweetgreen that clarifies external risks and opportunities, ideal for drop-in slides, team alignment, and client reports—editable for local context and easily shareable across devices for quick decision-making.
Economic factors

Consumer spending cycle
Premium fast-casual demand is sensitive to disposable income and employment; US real disposable income softened in 2023–24 while unemployment averaged ~3.8% in 2024, constraining spend. Downturns prompt trade-down to value chains; expansions drive trade-up to brands like Sweetgreen. CBD lunch traffic sits ~25–30% below 2019 amid hybrid work, cutting midday volumes. Healthier meals show relatively low price elasticity (~-0.5), supporting premium pricing.
Food inflation volatility
Produce, grains and protein price swings drive Sweetgreen’s COGS and can compress restaurant-level margins when input costs move double-digit percent year-over-year; US food-at-home inflation eased to mid-single digits in 2024, but volatility remains. Seasonal menus and supplier contracting (fixed-price and forward buys) act as hedges, while weather-driven crop shocks (droughts/floods) create supply spikes. Menu pricing cadence and tighter portion control are used to pass through costs and protect margins.

Labor market tightness
Tight labor markets (US unemployment ~3.7% in mid‑2025) have driven restaurant wage inflation—wages in food service rose roughly 12% since 2019—raising Sweetgreen recruitment and retention costs and prompting investments in benefits, scheduling tech and training to boost productivity; staffing gaps lower throughput and service quality, and Sweetgreen’s unit economics are sensitive: each 1ppt rise in labor margin meaningfully compresses restaurant-level contribution.

Real estate and occupancy
Urban rents remain premium vs suburban corridors; 2024 national retail vacancy hovered near 6% (CBRE), prompting landlord concessions and short-term incentives; suburban availability is higher with lower rents. Sweetgreen is shifting to smaller footprints, pickup shelves and test ghost-kitchen formats that cut build-out capex to roughly $300k–$600k and target paybacks of 2–4 years.
- rent-levels: urban premium
- vacancy/concessions: ~6% 2024, landlord incentives up
- formats/capex: smaller stores, pickup/ghost kitchens; $300k–$600k capex; 2–4 yr payback
Capital markets access
Capital markets access raises the cost of capital for Sweetgreen's expansion, tech investment and supply upgrades as the Fed funds rate sits at about 5.25–5.50% and the US 10‑yr yield is ~4.3%, tightening borrowing costs.
Elevated equity volatility (VIX ~14–20) increases dilution risk when raising equity; franchising cuts upfront capex but typically yields 5–7% royalty take rates versus higher long‑term margins for company‑owned stores; automation often needs 3–5 year paybacks, raising ROI hurdles under current rates.
- Fed funds ~5.25–5.50%
- US 10‑yr ~4.3%
- VIX ~14–20
- Franchise royalties ~5–7%
- Automation payback 3–5 years
Foodborne costs $15.6B/yr and wage hikes squeeze produce margins
Softening real disposable income and ~3.7% unemployment in mid‑2025 constrain premium fast‑casual spend while CBD lunch traffic remains ~25–30% below 2019, pressuring midday comps. Food cost volatility and mid‑single digit food‑at‑home inflation (2024) squeeze COGS; wages up ~12% since 2019 raise labor margins. Rising rates (Fed 5.25–5.50%, 10‑yr ~4.3%) lift capex/financing costs; smaller footprints reduce capex to $300k–$600k with 2–4 yr paybacks.
| Metric | Value |
|---|---|
| Unemployment | ~3.7% (mid‑2025) |
| CBD traffic | ~25–30% below 2019 |
| Food inflation | Mid‑single digits (2024) |
| Fed funds / 10‑yr | 5.25–5.50% / ~4.3% |
| Capex / payback | $300k–$600k; 2–4 yrs |
Preview Before You Purchase
Sweetgreen PESTLE Analysis
The Sweetgreen PESTLE Analysis preview shown here is the exact document you’ll receive after purchase—fully formatted and ready to use. It covers political, economic, social, technological, legal and environmental factors with clear implications for strategy. No placeholders, no surprises.

Make Smarter Strategic Decisions with a Complete PESTEL View
Unlock competitive advantage with our PESTLE Analysis of Sweetgreen—three to five concise, actionable insights into political, economic, social, technological, legal, and environmental forces shaping the brand. Ideal for investors, strategists, and consultants, this ready-to-use report translates external trends into clear risks and opportunities. Purchase the full analysis for the complete, editable breakdown and immediate strategic value.
Political factors
Food safety oversight
FDA/USDA rules, local health codes and the FSMA/ FDA Food Traceability Rule force Sweetgreen to tighten sourcing, handling and kitchen workflows for salads and bowls, increasing supplier certification demand (GFSI‑recognized schemes like SQF/BRC) and end‑to‑farm traceability. Compliance audits and staff food‑safety training add recurring costs—often thousands per site—and CDC estimates US foodborne illness costs about $15.6B annually. Stricter pathogen controls or recalls can abruptly halt SKUs and disrupt supply chains, raising remediation and lost‑sales exposure.
Farm and trade policies
Agricultural subsidies (US government payments about $31B in 2023) and tariffs/import rules materially affect produce pricing and cross-border availability, feeding into Sweetgreen's input costs versus retail revenues (Sweetgreen reported $874M revenue in 2023). Reliance on seasonal, local supply increases exposure to policy shifts and weather-driven volatility. Immigration and farm labor rules—H-2A certifications reached ~336,000 positions in 2023—raise upstream labor costs. Sweetgreen mitigates risk via diversified regional sourcing and supplier networks.
Minimum wage agendas
City and state minimum wage hikes directly pressure Sweetgreen unit labor margins; federal minimum wage remains $7.25 (2025) while cities such as Seattle and San Francisco enforce floors above $17–18/hr.
Markets with aggressive floors (>17–18/hr) compress margins versus moderate regimes ($12–15/hr); restaurant labor typically runs 25–35% of sales, so a $2–3/hr increase can shave several EBITDA points per unit.
Pricing power, menu engineering and productivity levers — optimized kitchen design, digital ordering and throughput gains — can offset costs as political momentum for living-wage legislation persists across many metros through 2025.
Urban planning and permits
Zoning, permitting and outdoor-dining rules shape Sweetgreen store format choices—urban, campus or suburban—because municipal approvals often take 3–9 months and fees commonly range from 500–10,000 per permit, with negotiated community benefits sometimes adding 0.5–2% of project costs; delays increase pre-opening rent and buildout carrying costs, creating speed-to-market risk that pushes the company toward sites with simpler mixed-use or retail zoning and pre-approved curbside/outdoor dining allowances.
- permit-timeline: 3–9 months
- permit-fees: 500–10,000
- CBA impact: 0.5–2% project cost
- site-strategy: prefer mixed-use, transit/bike corridors
- transit/bike: proximity boosts footfall, lowers parking needs
Public health initiatives
Government nutrition programs and the FDA menu-labeling rule (calorie disclosure for chains with 20+ locations since 2018) increase demand for Sweetgreen's transparent, low-calorie offerings; CDC adult obesity prevalence 41.9% (2020) further drives policy-backed healthy-eating shifts. Sugar/salt reduction campaigns and USDA school meal standards (Healthy, Hunger-Free Kids Act) align with Sweetgreen’s menu; labeling or nutrient caps could constrain reformulation costs but open workplace/school partnership revenue opportunities.
Foodborne costs $15.6B/yr and wage hikes squeeze produce margins
Regulation-driven food safety (FSMA traceability, recalls) raises supplier-certification and site audit costs; US foodborne illness costs ~15.6B/yr. Agricultural policy/tariffs and $31B farm subsidies (2023) affect produce pricing vs Sweetgreen revenue $874M (2023). Minimum-wage hikes (city floors >17–18/hr) compress unit margins; H-2A roles ~336k (2023) tighten farm labor.
| Metric | Value |
|---|---|
| Revenue (2023) | $874M |
| Foodborne cost | $15.6B/yr |
| Farm subsidies (2023) | $31B |
| H-2A roles (2023) | ~336,000 |
What is included in the product
Detailed Word Document
Explores how macro-environmental factors uniquely affect Sweetgreen across Political, Economic, Social, Technological, Environmental, and Legal dimensions, with data-driven insights and trend analysis tailored to the fast-casual salad sector. Designed for executives and investors, the report identifies specific threats, opportunities, and forward-looking scenarios to guide strategy, funding, and operational decisions.
Customizable Excel Spreadsheet
A concise, visually segmented PESTLE summary for Sweetgreen that clarifies external risks and opportunities, ideal for drop-in slides, team alignment, and client reports—editable for local context and easily shareable across devices for quick decision-making.
Economic factors
Consumer spending cycle
Premium fast-casual demand is sensitive to disposable income and employment; US real disposable income softened in 2023–24 while unemployment averaged ~3.8% in 2024, constraining spend. Downturns prompt trade-down to value chains; expansions drive trade-up to brands like Sweetgreen. CBD lunch traffic sits ~25–30% below 2019 amid hybrid work, cutting midday volumes. Healthier meals show relatively low price elasticity (~-0.5), supporting premium pricing.
Food inflation volatility
Produce, grains and protein price swings drive Sweetgreen’s COGS and can compress restaurant-level margins when input costs move double-digit percent year-over-year; US food-at-home inflation eased to mid-single digits in 2024, but volatility remains. Seasonal menus and supplier contracting (fixed-price and forward buys) act as hedges, while weather-driven crop shocks (droughts/floods) create supply spikes. Menu pricing cadence and tighter portion control are used to pass through costs and protect margins.
Labor market tightness
Tight labor markets (US unemployment ~3.7% in mid‑2025) have driven restaurant wage inflation—wages in food service rose roughly 12% since 2019—raising Sweetgreen recruitment and retention costs and prompting investments in benefits, scheduling tech and training to boost productivity; staffing gaps lower throughput and service quality, and Sweetgreen’s unit economics are sensitive: each 1ppt rise in labor margin meaningfully compresses restaurant-level contribution.
Real estate and occupancy
Urban rents remain premium vs suburban corridors; 2024 national retail vacancy hovered near 6% (CBRE), prompting landlord concessions and short-term incentives; suburban availability is higher with lower rents. Sweetgreen is shifting to smaller footprints, pickup shelves and test ghost-kitchen formats that cut build-out capex to roughly $300k–$600k and target paybacks of 2–4 years.
- rent-levels: urban premium
- vacancy/concessions: ~6% 2024, landlord incentives up
- formats/capex: smaller stores, pickup/ghost kitchens; $300k–$600k capex; 2–4 yr payback
Capital markets access
Capital markets access raises the cost of capital for Sweetgreen's expansion, tech investment and supply upgrades as the Fed funds rate sits at about 5.25–5.50% and the US 10‑yr yield is ~4.3%, tightening borrowing costs.
Elevated equity volatility (VIX ~14–20) increases dilution risk when raising equity; franchising cuts upfront capex but typically yields 5–7% royalty take rates versus higher long‑term margins for company‑owned stores; automation often needs 3–5 year paybacks, raising ROI hurdles under current rates.
- Fed funds ~5.25–5.50%
- US 10‑yr ~4.3%
- VIX ~14–20
- Franchise royalties ~5–7%
- Automation payback 3–5 years
Foodborne costs $15.6B/yr and wage hikes squeeze produce margins
Softening real disposable income and ~3.7% unemployment in mid‑2025 constrain premium fast‑casual spend while CBD lunch traffic remains ~25–30% below 2019, pressuring midday comps. Food cost volatility and mid‑single digit food‑at‑home inflation (2024) squeeze COGS; wages up ~12% since 2019 raise labor margins. Rising rates (Fed 5.25–5.50%, 10‑yr ~4.3%) lift capex/financing costs; smaller footprints reduce capex to $300k–$600k with 2–4 yr paybacks.
| Metric | Value |
|---|---|
| Unemployment | ~3.7% (mid‑2025) |
| CBD traffic | ~25–30% below 2019 |
| Food inflation | Mid‑single digits (2024) |
| Fed funds / 10‑yr | 5.25–5.50% / ~4.3% |
| Capex / payback | $300k–$600k; 2–4 yrs |
Preview Before You Purchase
Sweetgreen PESTLE Analysis
The Sweetgreen PESTLE Analysis preview shown here is the exact document you’ll receive after purchase—fully formatted and ready to use. It covers political, economic, social, technological, legal and environmental factors with clear implications for strategy. No placeholders, no surprises.
Description
Make Smarter Strategic Decisions with a Complete PESTEL View
Unlock competitive advantage with our PESTLE Analysis of Sweetgreen—three to five concise, actionable insights into political, economic, social, technological, legal, and environmental forces shaping the brand. Ideal for investors, strategists, and consultants, this ready-to-use report translates external trends into clear risks and opportunities. Purchase the full analysis for the complete, editable breakdown and immediate strategic value.
Political factors
Food safety oversight
FDA/USDA rules, local health codes and the FSMA/ FDA Food Traceability Rule force Sweetgreen to tighten sourcing, handling and kitchen workflows for salads and bowls, increasing supplier certification demand (GFSI‑recognized schemes like SQF/BRC) and end‑to‑farm traceability. Compliance audits and staff food‑safety training add recurring costs—often thousands per site—and CDC estimates US foodborne illness costs about $15.6B annually. Stricter pathogen controls or recalls can abruptly halt SKUs and disrupt supply chains, raising remediation and lost‑sales exposure.
Farm and trade policies
Agricultural subsidies (US government payments about $31B in 2023) and tariffs/import rules materially affect produce pricing and cross-border availability, feeding into Sweetgreen's input costs versus retail revenues (Sweetgreen reported $874M revenue in 2023). Reliance on seasonal, local supply increases exposure to policy shifts and weather-driven volatility. Immigration and farm labor rules—H-2A certifications reached ~336,000 positions in 2023—raise upstream labor costs. Sweetgreen mitigates risk via diversified regional sourcing and supplier networks.
Minimum wage agendas
City and state minimum wage hikes directly pressure Sweetgreen unit labor margins; federal minimum wage remains $7.25 (2025) while cities such as Seattle and San Francisco enforce floors above $17–18/hr.
Markets with aggressive floors (>17–18/hr) compress margins versus moderate regimes ($12–15/hr); restaurant labor typically runs 25–35% of sales, so a $2–3/hr increase can shave several EBITDA points per unit.
Pricing power, menu engineering and productivity levers — optimized kitchen design, digital ordering and throughput gains — can offset costs as political momentum for living-wage legislation persists across many metros through 2025.
Urban planning and permits
Zoning, permitting and outdoor-dining rules shape Sweetgreen store format choices—urban, campus or suburban—because municipal approvals often take 3–9 months and fees commonly range from 500–10,000 per permit, with negotiated community benefits sometimes adding 0.5–2% of project costs; delays increase pre-opening rent and buildout carrying costs, creating speed-to-market risk that pushes the company toward sites with simpler mixed-use or retail zoning and pre-approved curbside/outdoor dining allowances.
- permit-timeline: 3–9 months
- permit-fees: 500–10,000
- CBA impact: 0.5–2% project cost
- site-strategy: prefer mixed-use, transit/bike corridors
- transit/bike: proximity boosts footfall, lowers parking needs
Public health initiatives
Government nutrition programs and the FDA menu-labeling rule (calorie disclosure for chains with 20+ locations since 2018) increase demand for Sweetgreen's transparent, low-calorie offerings; CDC adult obesity prevalence 41.9% (2020) further drives policy-backed healthy-eating shifts. Sugar/salt reduction campaigns and USDA school meal standards (Healthy, Hunger-Free Kids Act) align with Sweetgreen’s menu; labeling or nutrient caps could constrain reformulation costs but open workplace/school partnership revenue opportunities.
Foodborne costs $15.6B/yr and wage hikes squeeze produce margins
Regulation-driven food safety (FSMA traceability, recalls) raises supplier-certification and site audit costs; US foodborne illness costs ~15.6B/yr. Agricultural policy/tariffs and $31B farm subsidies (2023) affect produce pricing vs Sweetgreen revenue $874M (2023). Minimum-wage hikes (city floors >17–18/hr) compress unit margins; H-2A roles ~336k (2023) tighten farm labor.
| Metric | Value |
|---|---|
| Revenue (2023) | $874M |
| Foodborne cost | $15.6B/yr |
| Farm subsidies (2023) | $31B |
| H-2A roles (2023) | ~336,000 |
What is included in the product
Detailed Word Document
Explores how macro-environmental factors uniquely affect Sweetgreen across Political, Economic, Social, Technological, Environmental, and Legal dimensions, with data-driven insights and trend analysis tailored to the fast-casual salad sector. Designed for executives and investors, the report identifies specific threats, opportunities, and forward-looking scenarios to guide strategy, funding, and operational decisions.
Customizable Excel Spreadsheet
A concise, visually segmented PESTLE summary for Sweetgreen that clarifies external risks and opportunities, ideal for drop-in slides, team alignment, and client reports—editable for local context and easily shareable across devices for quick decision-making.
Economic factors
Consumer spending cycle
Premium fast-casual demand is sensitive to disposable income and employment; US real disposable income softened in 2023–24 while unemployment averaged ~3.8% in 2024, constraining spend. Downturns prompt trade-down to value chains; expansions drive trade-up to brands like Sweetgreen. CBD lunch traffic sits ~25–30% below 2019 amid hybrid work, cutting midday volumes. Healthier meals show relatively low price elasticity (~-0.5), supporting premium pricing.
Food inflation volatility
Produce, grains and protein price swings drive Sweetgreen’s COGS and can compress restaurant-level margins when input costs move double-digit percent year-over-year; US food-at-home inflation eased to mid-single digits in 2024, but volatility remains. Seasonal menus and supplier contracting (fixed-price and forward buys) act as hedges, while weather-driven crop shocks (droughts/floods) create supply spikes. Menu pricing cadence and tighter portion control are used to pass through costs and protect margins.
Labor market tightness
Tight labor markets (US unemployment ~3.7% in mid‑2025) have driven restaurant wage inflation—wages in food service rose roughly 12% since 2019—raising Sweetgreen recruitment and retention costs and prompting investments in benefits, scheduling tech and training to boost productivity; staffing gaps lower throughput and service quality, and Sweetgreen’s unit economics are sensitive: each 1ppt rise in labor margin meaningfully compresses restaurant-level contribution.
Real estate and occupancy
Urban rents remain premium vs suburban corridors; 2024 national retail vacancy hovered near 6% (CBRE), prompting landlord concessions and short-term incentives; suburban availability is higher with lower rents. Sweetgreen is shifting to smaller footprints, pickup shelves and test ghost-kitchen formats that cut build-out capex to roughly $300k–$600k and target paybacks of 2–4 years.
- rent-levels: urban premium
- vacancy/concessions: ~6% 2024, landlord incentives up
- formats/capex: smaller stores, pickup/ghost kitchens; $300k–$600k capex; 2–4 yr payback
Capital markets access
Capital markets access raises the cost of capital for Sweetgreen's expansion, tech investment and supply upgrades as the Fed funds rate sits at about 5.25–5.50% and the US 10‑yr yield is ~4.3%, tightening borrowing costs.
Elevated equity volatility (VIX ~14–20) increases dilution risk when raising equity; franchising cuts upfront capex but typically yields 5–7% royalty take rates versus higher long‑term margins for company‑owned stores; automation often needs 3–5 year paybacks, raising ROI hurdles under current rates.
- Fed funds ~5.25–5.50%
- US 10‑yr ~4.3%
- VIX ~14–20
- Franchise royalties ~5–7%
- Automation payback 3–5 years
Foodborne costs $15.6B/yr and wage hikes squeeze produce margins
Softening real disposable income and ~3.7% unemployment in mid‑2025 constrain premium fast‑casual spend while CBD lunch traffic remains ~25–30% below 2019, pressuring midday comps. Food cost volatility and mid‑single digit food‑at‑home inflation (2024) squeeze COGS; wages up ~12% since 2019 raise labor margins. Rising rates (Fed 5.25–5.50%, 10‑yr ~4.3%) lift capex/financing costs; smaller footprints reduce capex to $300k–$600k with 2–4 yr paybacks.
| Metric | Value |
|---|---|
| Unemployment | ~3.7% (mid‑2025) |
| CBD traffic | ~25–30% below 2019 |
| Food inflation | Mid‑single digits (2024) |
| Fed funds / 10‑yr | 5.25–5.50% / ~4.3% |
| Capex / payback | $300k–$600k; 2–4 yrs |
Preview Before You Purchase
Sweetgreen PESTLE Analysis
The Sweetgreen PESTLE Analysis preview shown here is the exact document you’ll receive after purchase—fully formatted and ready to use. It covers political, economic, social, technological, legal and environmental factors with clear implications for strategy. No placeholders, no surprises.











