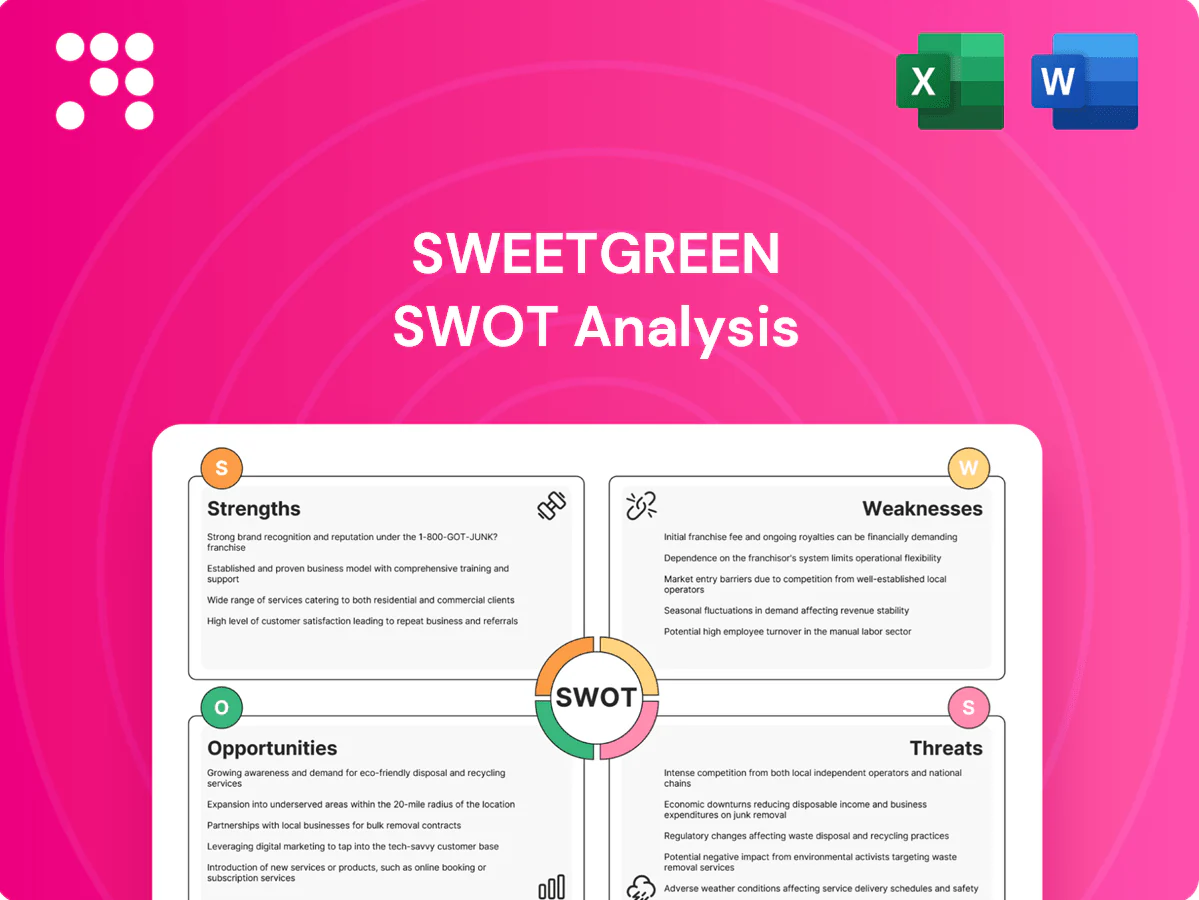
Sweetgreen SWOT Analysis

Make Insightful Decisions Backed by Expert Research
Sweetgreen’s SWOT snapshot highlights strong brand equity and digital ordering strengths, balanced by supply-chain and competitive pressures; growth hinges on menu innovation and scalable unit economics. Want the full story behind strengths, risks, and growth drivers? Purchase the complete SWOT analysis to get a professionally formatted Word report and editable Excel matrix for strategy, pitch, or investment use.
Strengths

Strong health-focused brand
Positioned as a leader in nutritious, fresh and convenient meals, Sweetgreen resonates with health-conscious consumers through a wellness- and sustainability-driven narrative that differentiates it from fast food; this supports premium pricing and loyalty, reinforced by over 200 U.S. locations and a loyalty program exceeding 2 million members, with consistent messaging driving trust and repeat visits.
Transparent, locally sourced ingredients
Sourcing transparency and seasonal menus boost perceived quality and authenticity, supported by Sweetgreen's public profile since its 2021 IPO and operations in over 200 locations; local farm partnerships enhance supply resilience and community goodwill, while seasonal rotation keeps offerings fresh and aligns with ESG priorities important to many customers and investors.

Robust digital app and ordering
Mobile ordering, pickup, and deep customization streamline the customer journey and cut friction, with Sweetgreen reporting a majority of orders through digital channels by 2024. The app drives frequency via convenient reorders and data-driven personalization, lifting AOV and throughput. Enhanced operational visibility from digital orders improves labor planning and inventory management.

High customization and menu flexibility
High customization — build-your-own salads and warm bowls — lets Sweetgreen serve diverse dietary needs and trends, boosting perceived control and satisfaction while supporting rapid menu innovation without kitchen retooling. Customer choice data directly informs product development and merchandising in real time.
- Customization: higher satisfaction
- Menu agility: faster launches
- Data-driven: choices inform SKUs
Mission-driven culture and community
Sweetgreen's mission-driven focus on sustainability and responsible sourcing boosts employer brand and customer advocacy, supporting $688.9 million in 2023 revenue and a footprint of over 200 restaurants. Community engagement and storytelling deepen emotional bonds, helping attract partnership and real-estate deals while reducing price sensitivity among millennials and Gen Z core segments. Purpose-driven positioning also aids talent attraction and premium pricing resilience.
- 2023 revenue: $688.9M
- 200+ restaurants
- Stronger employer brand & partnerships
- Reduces core-segment price sensitivity
Fresh fast-casual leader - over 200 U.S. units, $688.9M 2023 revenue, 2M+ loyalty
Leader in fresh, sustainable fast-casual with premium pricing power, strong digital adoption (majority orders via app by 2024), >200 U.S. restaurants, loyalty >2M, and $688.9M revenue in 2023—driving repeat visits, menu agility, and investor/employee appeal.
| Metric | Value |
|---|---|
| 2023 Revenue | $688.9M |
| Locations | 200+ |
| Loyalty Members | >2M |
| Digital Orders | Majority by 2024 |
What is included in the product
 Detailed Word Document
Delivers a strategic overview of Sweetgreen’s internal and external business factors, outlining strengths, weaknesses, opportunities, and threats to assess its competitive position and growth prospects.

 Customizable Excel Spreadsheet
Provides a focused Sweetgreen SWOT matrix that highlights menu, supply-chain, digital and sustainability risks and opportunities for rapid strategy alignment and streamlined stakeholder updates.
Weaknesses

Premium pricing limits reach
Sweetgreen's premium average check (roughly $12–15) is materially above fast-food peers (commonly $6–8), deterring value-focused diners and reducing visit frequency in downturns. The price gap narrows addressable market and slows suburban penetration where price sensitivity is higher. Relying on discounting to drive traffic risks brand dilution and compresses margins. Higher price positioning limits scalability versus lower-cost rivals.
Supply chain complexity and seasonality
Reliance on fresh, seasonal produce raises cost and availability volatility, with produce price swings often in the high single digits annually and acute spikes during adverse weather events. Weather and regional variability complicate planning and quality control across Sweetgreen's operations, now spanning over 200 locations. Frequent menu and vendor changes increase procurement and training burdens, where stockouts or inconsistency directly harm the guest experience.

Urban footprint concentration
Sweetgreen's footprint is concentrated in dense, high-rent urban markets with over 200 restaurants, making it dependent on office-worker lunch traffic; the lunch daypart drives roughly half of sales and creates pronounced demand cyclicality. Remote and hybrid work has kept weekday downtown traffic materially below pre-pandemic levels, amplifying sales volatility. High occupancy costs in prime locations magnify earnings sensitivity to foot-traffic declines.

Operational complexity from customization
Sweetgreen’s heavy customization leads to highly variable builds that slow lines and strain training; with around 200 restaurants in 2024, peak throughput can suffer without strict process discipline. Inconsistent execution across teams erodes portion control and margins, while menu complexity raises labor intensity and on-site waste.
- Variable builds slow throughput
- Training strain increases operating risk
- Inconsistent portioning pressures margins
- Higher labor intensity and food waste
Narrower menu scope versus competitors
Sweetgreen’s salad- and bowl-centric menu narrows family and value-seeker appeal, limiting trade-area capture compared with fast-casual rivals offering broader comfort or indulgent items; this focus, combined with a narrower cooked-protein and hot-entrée selection, can cap average check growth and reduce dinner occasions. Sweetgreen reported roughly $628M revenue in FY2023 while still pushing expansion, but mix limits may constrain per-store sales upside.
- Limited appeal to families/value seekers
- Fewer indulgent/comfort options reduce trade-area capture
- Protein and hot-entrée breadth lags competitors
- Caps check growth and dinner penetration
Premium $12–15 check, urban-heavy >200 footprint, lunch-centric and cyclical
Sweetgreen’s premium average check (~$12–15) limits appeal vs fast-food peers ($6–8) and compresses visit frequency in downturns. Reliance on fresh seasonal produce creates cost and availability volatility (produce swings high single digits annually). Footprint concentrated in dense urban markets (>200 restaurants) makes lunch roughly 50% of sales, raising cyclicality. Narrow salad/bowl menu constrains family and dinner penetration.
| Metric | Value |
|---|---|
| FY2023 revenue | $628M |
| Locations (2024) | >200 |
| Avg check | $12–15 |
| Lunch share | ~50% |
Preview the Actual Deliverable
Sweetgreen SWOT Analysis
This is the actual Sweetgreen SWOT analysis document you’ll receive upon purchase—no surprises, just professional quality. The preview below is taken directly from the full report and reflects the same structured, editable content included in your download. Buy now to unlock the complete, in-depth version immediately after checkout.

Make Insightful Decisions Backed by Expert Research
Sweetgreen’s SWOT snapshot highlights strong brand equity and digital ordering strengths, balanced by supply-chain and competitive pressures; growth hinges on menu innovation and scalable unit economics. Want the full story behind strengths, risks, and growth drivers? Purchase the complete SWOT analysis to get a professionally formatted Word report and editable Excel matrix for strategy, pitch, or investment use.
Strengths
Strong health-focused brand
Positioned as a leader in nutritious, fresh and convenient meals, Sweetgreen resonates with health-conscious consumers through a wellness- and sustainability-driven narrative that differentiates it from fast food; this supports premium pricing and loyalty, reinforced by over 200 U.S. locations and a loyalty program exceeding 2 million members, with consistent messaging driving trust and repeat visits.
Transparent, locally sourced ingredients
Sourcing transparency and seasonal menus boost perceived quality and authenticity, supported by Sweetgreen's public profile since its 2021 IPO and operations in over 200 locations; local farm partnerships enhance supply resilience and community goodwill, while seasonal rotation keeps offerings fresh and aligns with ESG priorities important to many customers and investors.
Robust digital app and ordering
Mobile ordering, pickup, and deep customization streamline the customer journey and cut friction, with Sweetgreen reporting a majority of orders through digital channels by 2024. The app drives frequency via convenient reorders and data-driven personalization, lifting AOV and throughput. Enhanced operational visibility from digital orders improves labor planning and inventory management.
High customization and menu flexibility
High customization — build-your-own salads and warm bowls — lets Sweetgreen serve diverse dietary needs and trends, boosting perceived control and satisfaction while supporting rapid menu innovation without kitchen retooling. Customer choice data directly informs product development and merchandising in real time.
- Customization: higher satisfaction
- Menu agility: faster launches
- Data-driven: choices inform SKUs
Mission-driven culture and community
Sweetgreen's mission-driven focus on sustainability and responsible sourcing boosts employer brand and customer advocacy, supporting $688.9 million in 2023 revenue and a footprint of over 200 restaurants. Community engagement and storytelling deepen emotional bonds, helping attract partnership and real-estate deals while reducing price sensitivity among millennials and Gen Z core segments. Purpose-driven positioning also aids talent attraction and premium pricing resilience.
- 2023 revenue: $688.9M
- 200+ restaurants
- Stronger employer brand & partnerships
- Reduces core-segment price sensitivity
Fresh fast-casual leader - over 200 U.S. units, $688.9M 2023 revenue, 2M+ loyalty
Leader in fresh, sustainable fast-casual with premium pricing power, strong digital adoption (majority orders via app by 2024), >200 U.S. restaurants, loyalty >2M, and $688.9M revenue in 2023—driving repeat visits, menu agility, and investor/employee appeal.
| Metric | Value |
|---|---|
| 2023 Revenue | $688.9M |
| Locations | 200+ |
| Loyalty Members | >2M |
| Digital Orders | Majority by 2024 |
What is included in the product
Detailed Word Document
Delivers a strategic overview of Sweetgreen’s internal and external business factors, outlining strengths, weaknesses, opportunities, and threats to assess its competitive position and growth prospects.
Customizable Excel Spreadsheet
Provides a focused Sweetgreen SWOT matrix that highlights menu, supply-chain, digital and sustainability risks and opportunities for rapid strategy alignment and streamlined stakeholder updates.
Weaknesses
Premium pricing limits reach
Sweetgreen's premium average check (roughly $12–15) is materially above fast-food peers (commonly $6–8), deterring value-focused diners and reducing visit frequency in downturns. The price gap narrows addressable market and slows suburban penetration where price sensitivity is higher. Relying on discounting to drive traffic risks brand dilution and compresses margins. Higher price positioning limits scalability versus lower-cost rivals.
Supply chain complexity and seasonality
Reliance on fresh, seasonal produce raises cost and availability volatility, with produce price swings often in the high single digits annually and acute spikes during adverse weather events. Weather and regional variability complicate planning and quality control across Sweetgreen's operations, now spanning over 200 locations. Frequent menu and vendor changes increase procurement and training burdens, where stockouts or inconsistency directly harm the guest experience.
Urban footprint concentration
Sweetgreen's footprint is concentrated in dense, high-rent urban markets with over 200 restaurants, making it dependent on office-worker lunch traffic; the lunch daypart drives roughly half of sales and creates pronounced demand cyclicality. Remote and hybrid work has kept weekday downtown traffic materially below pre-pandemic levels, amplifying sales volatility. High occupancy costs in prime locations magnify earnings sensitivity to foot-traffic declines.
Operational complexity from customization
Sweetgreen’s heavy customization leads to highly variable builds that slow lines and strain training; with around 200 restaurants in 2024, peak throughput can suffer without strict process discipline. Inconsistent execution across teams erodes portion control and margins, while menu complexity raises labor intensity and on-site waste.
- Variable builds slow throughput
- Training strain increases operating risk
- Inconsistent portioning pressures margins
- Higher labor intensity and food waste
Narrower menu scope versus competitors
Sweetgreen’s salad- and bowl-centric menu narrows family and value-seeker appeal, limiting trade-area capture compared with fast-casual rivals offering broader comfort or indulgent items; this focus, combined with a narrower cooked-protein and hot-entrée selection, can cap average check growth and reduce dinner occasions. Sweetgreen reported roughly $628M revenue in FY2023 while still pushing expansion, but mix limits may constrain per-store sales upside.
- Limited appeal to families/value seekers
- Fewer indulgent/comfort options reduce trade-area capture
- Protein and hot-entrée breadth lags competitors
- Caps check growth and dinner penetration
Premium $12–15 check, urban-heavy >200 footprint, lunch-centric and cyclical
Sweetgreen’s premium average check (~$12–15) limits appeal vs fast-food peers ($6–8) and compresses visit frequency in downturns. Reliance on fresh seasonal produce creates cost and availability volatility (produce swings high single digits annually). Footprint concentrated in dense urban markets (>200 restaurants) makes lunch roughly 50% of sales, raising cyclicality. Narrow salad/bowl menu constrains family and dinner penetration.
| Metric | Value |
|---|---|
| FY2023 revenue | $628M |
| Locations (2024) | >200 |
| Avg check | $12–15 |
| Lunch share | ~50% |
Preview the Actual Deliverable
Sweetgreen SWOT Analysis
This is the actual Sweetgreen SWOT analysis document you’ll receive upon purchase—no surprises, just professional quality. The preview below is taken directly from the full report and reflects the same structured, editable content included in your download. Buy now to unlock the complete, in-depth version immediately after checkout.
Description
Make Insightful Decisions Backed by Expert Research
Sweetgreen’s SWOT snapshot highlights strong brand equity and digital ordering strengths, balanced by supply-chain and competitive pressures; growth hinges on menu innovation and scalable unit economics. Want the full story behind strengths, risks, and growth drivers? Purchase the complete SWOT analysis to get a professionally formatted Word report and editable Excel matrix for strategy, pitch, or investment use.
Strengths
Strong health-focused brand
Positioned as a leader in nutritious, fresh and convenient meals, Sweetgreen resonates with health-conscious consumers through a wellness- and sustainability-driven narrative that differentiates it from fast food; this supports premium pricing and loyalty, reinforced by over 200 U.S. locations and a loyalty program exceeding 2 million members, with consistent messaging driving trust and repeat visits.
Transparent, locally sourced ingredients
Sourcing transparency and seasonal menus boost perceived quality and authenticity, supported by Sweetgreen's public profile since its 2021 IPO and operations in over 200 locations; local farm partnerships enhance supply resilience and community goodwill, while seasonal rotation keeps offerings fresh and aligns with ESG priorities important to many customers and investors.
Robust digital app and ordering
Mobile ordering, pickup, and deep customization streamline the customer journey and cut friction, with Sweetgreen reporting a majority of orders through digital channels by 2024. The app drives frequency via convenient reorders and data-driven personalization, lifting AOV and throughput. Enhanced operational visibility from digital orders improves labor planning and inventory management.
High customization and menu flexibility
High customization — build-your-own salads and warm bowls — lets Sweetgreen serve diverse dietary needs and trends, boosting perceived control and satisfaction while supporting rapid menu innovation without kitchen retooling. Customer choice data directly informs product development and merchandising in real time.
- Customization: higher satisfaction
- Menu agility: faster launches
- Data-driven: choices inform SKUs
Mission-driven culture and community
Sweetgreen's mission-driven focus on sustainability and responsible sourcing boosts employer brand and customer advocacy, supporting $688.9 million in 2023 revenue and a footprint of over 200 restaurants. Community engagement and storytelling deepen emotional bonds, helping attract partnership and real-estate deals while reducing price sensitivity among millennials and Gen Z core segments. Purpose-driven positioning also aids talent attraction and premium pricing resilience.
- 2023 revenue: $688.9M
- 200+ restaurants
- Stronger employer brand & partnerships
- Reduces core-segment price sensitivity
Fresh fast-casual leader - over 200 U.S. units, $688.9M 2023 revenue, 2M+ loyalty
Leader in fresh, sustainable fast-casual with premium pricing power, strong digital adoption (majority orders via app by 2024), >200 U.S. restaurants, loyalty >2M, and $688.9M revenue in 2023—driving repeat visits, menu agility, and investor/employee appeal.
| Metric | Value |
|---|---|
| 2023 Revenue | $688.9M |
| Locations | 200+ |
| Loyalty Members | >2M |
| Digital Orders | Majority by 2024 |
What is included in the product
Detailed Word Document
Delivers a strategic overview of Sweetgreen’s internal and external business factors, outlining strengths, weaknesses, opportunities, and threats to assess its competitive position and growth prospects.
Customizable Excel Spreadsheet
Provides a focused Sweetgreen SWOT matrix that highlights menu, supply-chain, digital and sustainability risks and opportunities for rapid strategy alignment and streamlined stakeholder updates.
Weaknesses
Premium pricing limits reach
Sweetgreen's premium average check (roughly $12–15) is materially above fast-food peers (commonly $6–8), deterring value-focused diners and reducing visit frequency in downturns. The price gap narrows addressable market and slows suburban penetration where price sensitivity is higher. Relying on discounting to drive traffic risks brand dilution and compresses margins. Higher price positioning limits scalability versus lower-cost rivals.
Supply chain complexity and seasonality
Reliance on fresh, seasonal produce raises cost and availability volatility, with produce price swings often in the high single digits annually and acute spikes during adverse weather events. Weather and regional variability complicate planning and quality control across Sweetgreen's operations, now spanning over 200 locations. Frequent menu and vendor changes increase procurement and training burdens, where stockouts or inconsistency directly harm the guest experience.
Urban footprint concentration
Sweetgreen's footprint is concentrated in dense, high-rent urban markets with over 200 restaurants, making it dependent on office-worker lunch traffic; the lunch daypart drives roughly half of sales and creates pronounced demand cyclicality. Remote and hybrid work has kept weekday downtown traffic materially below pre-pandemic levels, amplifying sales volatility. High occupancy costs in prime locations magnify earnings sensitivity to foot-traffic declines.
Operational complexity from customization
Sweetgreen’s heavy customization leads to highly variable builds that slow lines and strain training; with around 200 restaurants in 2024, peak throughput can suffer without strict process discipline. Inconsistent execution across teams erodes portion control and margins, while menu complexity raises labor intensity and on-site waste.
- Variable builds slow throughput
- Training strain increases operating risk
- Inconsistent portioning pressures margins
- Higher labor intensity and food waste
Narrower menu scope versus competitors
Sweetgreen’s salad- and bowl-centric menu narrows family and value-seeker appeal, limiting trade-area capture compared with fast-casual rivals offering broader comfort or indulgent items; this focus, combined with a narrower cooked-protein and hot-entrée selection, can cap average check growth and reduce dinner occasions. Sweetgreen reported roughly $628M revenue in FY2023 while still pushing expansion, but mix limits may constrain per-store sales upside.
- Limited appeal to families/value seekers
- Fewer indulgent/comfort options reduce trade-area capture
- Protein and hot-entrée breadth lags competitors
- Caps check growth and dinner penetration
Premium $12–15 check, urban-heavy >200 footprint, lunch-centric and cyclical
Sweetgreen’s premium average check (~$12–15) limits appeal vs fast-food peers ($6–8) and compresses visit frequency in downturns. Reliance on fresh seasonal produce creates cost and availability volatility (produce swings high single digits annually). Footprint concentrated in dense urban markets (>200 restaurants) makes lunch roughly 50% of sales, raising cyclicality. Narrow salad/bowl menu constrains family and dinner penetration.
| Metric | Value |
|---|---|
| FY2023 revenue | $628M |
| Locations (2024) | >200 |
| Avg check | $12–15 |
| Lunch share | ~50% |
Preview the Actual Deliverable
Sweetgreen SWOT Analysis
This is the actual Sweetgreen SWOT analysis document you’ll receive upon purchase—no surprises, just professional quality. The preview below is taken directly from the full report and reflects the same structured, editable content included in your download. Buy now to unlock the complete, in-depth version immediately after checkout.











