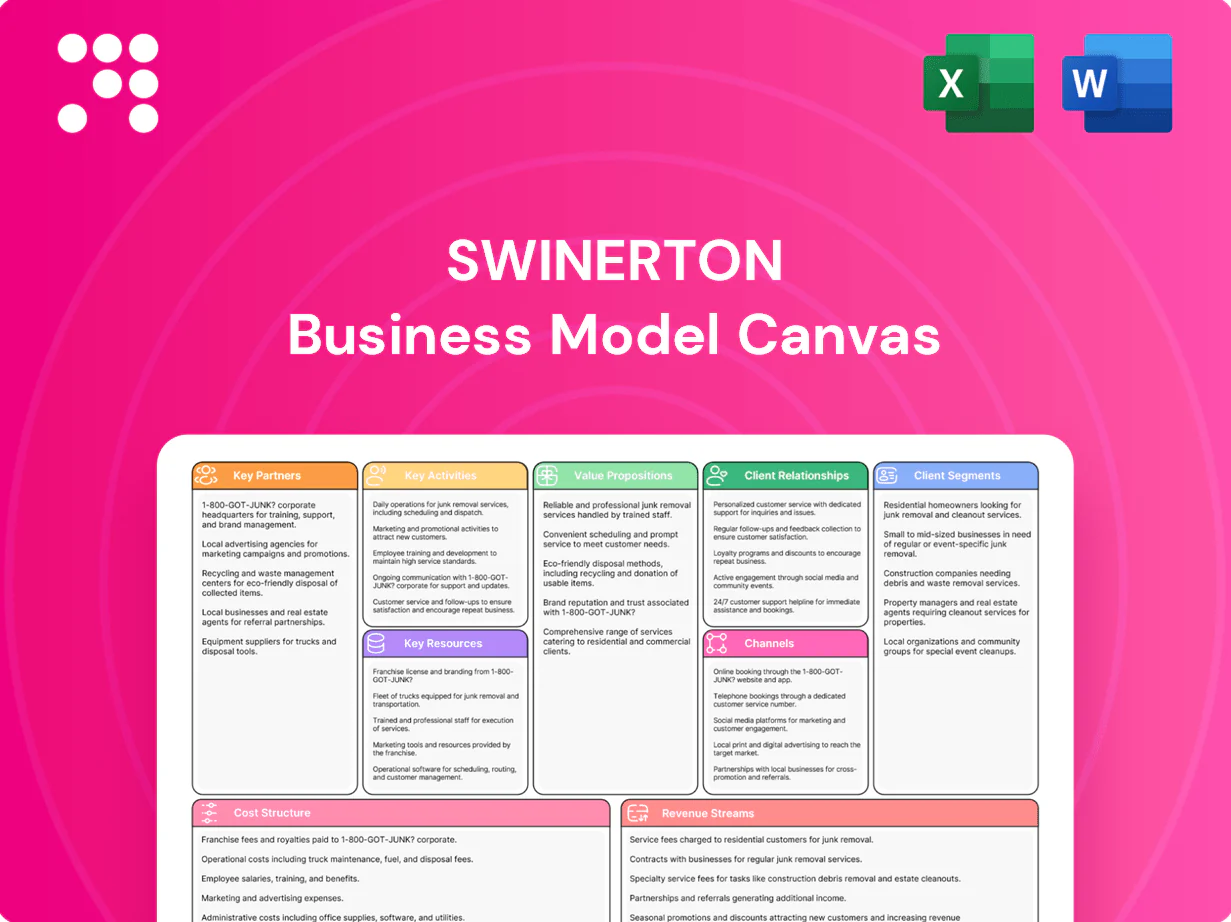
Swinerton Business Model Canvas

Business Model Canvas: concise value creation, go-to-market, scalable revenue strategies
Unlock the strategic blueprint behind Swinerton with our in-depth Business Model Canvas—three concise sections reveal value creation, go-to-market tactics, and scalable revenue streams. Ideal for investors, consultants, and founders seeking actionable insights; purchase the full downloadable Canvas to access every block, ready for benchmarking and strategic planning.
Partnerships

Architects & Engineering Firms
Collaborating with A/E firms enables integrated planning and seamless handoffs from design to build, with 2024 industry studies showing early A/E engagement can cut change orders by up to 30% and shorten schedules by ~15%. These partners supply structural, MEP and civil constructability expertise, and joint QA/QC frameworks have reduced code noncompliance incidents by ~25% in recent integrated projects.
Specialty Subcontractors & Trades
Swinerton’s specialty subcontractor partnerships in electrical, mechanical, concrete and envelope trades expand capacity and technical depth across 30+ regional markets, enabling rapid scaling on large programs. Prequalified networks backed by third-party audits maintain safety and quality and support labor availability across regions. Long-term agreements stabilize pricing and reduce mobilization time by shortening bid cycles. Shared scheduling tools have been shown to cut rework and delay-related costs by up to 20%.

Renewable Technology Providers
Partnerships with solar, storage and inverter OEMs enable turnkey renewable EPC delivery, leveraging supplier scale to meet IRA-era incentives such as the 30% ITC (2024). Technical alliances improve system design and procurement, lowering LCOE as battery pack costs fell ~89% since 2010 to about $132/kWh (2023). Joint commissioning shortens interconnection timelines and performance guarantees boost project bankability for lenders.

Suppliers & Distributors
Aggregated procurement with national suppliers in 2024 secures cost, lead-time, and warranty advantages by leveraging scale across steel, concrete, lumber, finishes, and high-voltage components; strategic sourcing reduces variability and improves project margins. VMI and just-in-time logistics cut site inventory and waste while data-sharing enhances demand forecasting and supply-chain resilience across active projects.
- Scale sourcing across core materials
- VMI/JIT to lower on-site stock
- Data-sharing for forecast accuracy
- Focus on warranties and lead-time reduction
Financial, Insurance & Surety Partners
Banking, bonding, and insurance partners enable large project capacity and risk transfer; surety lines support bid, performance, and payment bonds that typically equal 100% of contract value. OCIP/CCIP programs in 2024 continue to consolidate coverage to enhance safety and cost control. Advisory partners improve contract structuring and contingency planning to protect margins and cashflow.
- Banking: working capital & LOC
- Bonding: bid/performance/payment = 100% of contract
- Insurance: OCIP/CCIP centralize risk, reduce admin
- Advisory: contract wording & contingency planning
Integrated A/E cuts change orders 30% and schedules 15% while scaling 30+ markets
Integrated A/E partnerships cut change orders up to 30% and schedules ~15% (2024); specialty subs span 30+ regional markets supporting rapid scale; solar/storage OEMs leverage the 30% ITC (2024) while battery costs ~$132/kWh (2023) lower LCOE; banking/bonding enable bids with bonds = 100% contract value and OCIP/CCIP centralize risk.
| Metric | Value |
|---|---|
| Change orders | -30% |
| Schedule | -15% |
| Regional markets | 30+ |
| ITC (2024) | 30% |
| Battery cost (2023) | $132/kWh |
| Bonding | 100% CV |
What is included in the product
 Detailed Word Document
A comprehensive, pre-written Business Model Canvas for Swinerton covering customer segments, channels, value propositions, revenue streams and key resources across the 9 BMC blocks, with SWOT-linked insights, competitive advantages, and a polished format ideal for presentations, funding and strategic decisions.

 Customizable Excel Spreadsheet
High-level view of Swinerton’s business model with editable cells to quickly pinpoint operational bottlenecks and align teams on solutions.
Activities

Preconstruction & Estimating
Detailed takeoffs, budgeting, and value engineering drive cost certainty, with industry analyses in 2024 showing value-engineering interventions can lower project costs by 5–10% on average. Early constructability reviews reduce design risk and help avoid the common 15–20% cost growth seen in delayed designs. Target Value Delivery aligns scope, schedule, and budget to reduce change orders. Bid packaging and procurement strategies in 2024 expanded market coverage, improving competitive sourcing and award rates.
Design-Build Integration
Coordinating multidisciplinary design with construction accelerates delivery—design-build projects can be up to 33% faster than design-bid-build. BIM/VDC clash detection cuts field conflicts by as much as 50% and helps limit costly rework, which typically consumes 5–10% of contract value. Design-assist with key trades can reduce change orders roughly 20% while iterative design reviews keep compliance and owner intent above 95%.

Construction Management & Self-Perform
Site logistics, schedule control and rigorous quality management drive delivery consistency, with 2024 Lean Construction Institute data showing Lean practices can cut waste up to 30% and shorten cycle times. Strategic self-perform scopes increase predictability and industry analyses show roughly 15% fewer incidents and better schedule adherence. Daily huddles standardize communication; commissioning and turnover (ASHRAE 2024) cut energy and performance defects 5–20%.

Renewable EPC Delivery
Renewable EPC Delivery: Swinerton provides end-to-end engineering, procurement, and construction for solar and storage projects, coordinating interconnection work, SCADA integration, and performance testing to utility standards; US interconnection backlog exceeded 2,000 GW in 2024, driving rigorous queue management. Supply risk is mitigated via approved vendor lists and alternate suppliers; O&M handoff includes warranties and measured performance baselines targeting 99%+ availability.
- Scope: EPC
- Standards: Utility interconnection/SCADA
- Risk: Approved vendors/alternates
- Handoff: Warranties & performance baselines
Safety, Compliance & Risk Management
Comprehensive safety programs at Swinerton protect people and schedules, aligning with industry data that construction accounts for about 20% of US workplace fatalities (BLS). Regulatory compliance spans environmental, labor and building codes; contract risk is controlled through governance and documentation. Continuous improvement leverages incident analytics and lessons learned to reduce repeat events.
- Safety programs: workforce training, PPE, site audits
- Compliance: environmental, labor, building codes
- Risk controls: contract clauses, governance, insurance
- Improvement: incident analytics, lessons learned
VE saves 5–10%; DB speeds +33%; BIM cuts rework 50%
Detailed takeoffs, VE save 5–10% on project costs (2024); Target Value Delivery reduces change orders and aligns budget/schedule. Design-build accelerates delivery up to 33% vs DBB; BIM/VDC cuts field conflicts ~50% and trims rework. Lean practices cut waste ~30%; renewable EPC manages >2,000 GW US interconnection backlog (2024) with 99%+ availability targets.
| Metric | Impact | 2024 Data |
|---|---|---|
| Cost savings | Lower capex | 5–10% |
| Delivery speed | Faster completion | +33% |
| Rework reduction | Fewer conflicts | ~50% |
| Waste reduction | Lean gains | ~30% |
| Interconnection | Queue risk | >2,000 GW |
| Availability | O&M target | 99%+ |
Full Document Unlocks After Purchase
Business Model Canvas
The Swinerton Business Model Canvas preview shown here is the actual deliverable, not a mockup. When you purchase, you'll receive the exact same document with all sections included. Files are provided ready-to-edit in Word and Excel formats. No surprises—what you see is what you get.

Business Model Canvas: concise value creation, go-to-market, scalable revenue strategies
Unlock the strategic blueprint behind Swinerton with our in-depth Business Model Canvas—three concise sections reveal value creation, go-to-market tactics, and scalable revenue streams. Ideal for investors, consultants, and founders seeking actionable insights; purchase the full downloadable Canvas to access every block, ready for benchmarking and strategic planning.
Partnerships
Architects & Engineering Firms
Collaborating with A/E firms enables integrated planning and seamless handoffs from design to build, with 2024 industry studies showing early A/E engagement can cut change orders by up to 30% and shorten schedules by ~15%. These partners supply structural, MEP and civil constructability expertise, and joint QA/QC frameworks have reduced code noncompliance incidents by ~25% in recent integrated projects.
Specialty Subcontractors & Trades
Swinerton’s specialty subcontractor partnerships in electrical, mechanical, concrete and envelope trades expand capacity and technical depth across 30+ regional markets, enabling rapid scaling on large programs. Prequalified networks backed by third-party audits maintain safety and quality and support labor availability across regions. Long-term agreements stabilize pricing and reduce mobilization time by shortening bid cycles. Shared scheduling tools have been shown to cut rework and delay-related costs by up to 20%.
Renewable Technology Providers
Partnerships with solar, storage and inverter OEMs enable turnkey renewable EPC delivery, leveraging supplier scale to meet IRA-era incentives such as the 30% ITC (2024). Technical alliances improve system design and procurement, lowering LCOE as battery pack costs fell ~89% since 2010 to about $132/kWh (2023). Joint commissioning shortens interconnection timelines and performance guarantees boost project bankability for lenders.
Suppliers & Distributors
Aggregated procurement with national suppliers in 2024 secures cost, lead-time, and warranty advantages by leveraging scale across steel, concrete, lumber, finishes, and high-voltage components; strategic sourcing reduces variability and improves project margins. VMI and just-in-time logistics cut site inventory and waste while data-sharing enhances demand forecasting and supply-chain resilience across active projects.
- Scale sourcing across core materials
- VMI/JIT to lower on-site stock
- Data-sharing for forecast accuracy
- Focus on warranties and lead-time reduction
Financial, Insurance & Surety Partners
Banking, bonding, and insurance partners enable large project capacity and risk transfer; surety lines support bid, performance, and payment bonds that typically equal 100% of contract value. OCIP/CCIP programs in 2024 continue to consolidate coverage to enhance safety and cost control. Advisory partners improve contract structuring and contingency planning to protect margins and cashflow.
- Banking: working capital & LOC
- Bonding: bid/performance/payment = 100% of contract
- Insurance: OCIP/CCIP centralize risk, reduce admin
- Advisory: contract wording & contingency planning
Integrated A/E cuts change orders 30% and schedules 15% while scaling 30+ markets
Integrated A/E partnerships cut change orders up to 30% and schedules ~15% (2024); specialty subs span 30+ regional markets supporting rapid scale; solar/storage OEMs leverage the 30% ITC (2024) while battery costs ~$132/kWh (2023) lower LCOE; banking/bonding enable bids with bonds = 100% contract value and OCIP/CCIP centralize risk.
| Metric | Value |
|---|---|
| Change orders | -30% |
| Schedule | -15% |
| Regional markets | 30+ |
| ITC (2024) | 30% |
| Battery cost (2023) | $132/kWh |
| Bonding | 100% CV |
What is included in the product
Detailed Word Document
A comprehensive, pre-written Business Model Canvas for Swinerton covering customer segments, channels, value propositions, revenue streams and key resources across the 9 BMC blocks, with SWOT-linked insights, competitive advantages, and a polished format ideal for presentations, funding and strategic decisions.
Customizable Excel Spreadsheet
High-level view of Swinerton’s business model with editable cells to quickly pinpoint operational bottlenecks and align teams on solutions.
Activities
Preconstruction & Estimating
Detailed takeoffs, budgeting, and value engineering drive cost certainty, with industry analyses in 2024 showing value-engineering interventions can lower project costs by 5–10% on average. Early constructability reviews reduce design risk and help avoid the common 15–20% cost growth seen in delayed designs. Target Value Delivery aligns scope, schedule, and budget to reduce change orders. Bid packaging and procurement strategies in 2024 expanded market coverage, improving competitive sourcing and award rates.
Design-Build Integration
Coordinating multidisciplinary design with construction accelerates delivery—design-build projects can be up to 33% faster than design-bid-build. BIM/VDC clash detection cuts field conflicts by as much as 50% and helps limit costly rework, which typically consumes 5–10% of contract value. Design-assist with key trades can reduce change orders roughly 20% while iterative design reviews keep compliance and owner intent above 95%.
Construction Management & Self-Perform
Site logistics, schedule control and rigorous quality management drive delivery consistency, with 2024 Lean Construction Institute data showing Lean practices can cut waste up to 30% and shorten cycle times. Strategic self-perform scopes increase predictability and industry analyses show roughly 15% fewer incidents and better schedule adherence. Daily huddles standardize communication; commissioning and turnover (ASHRAE 2024) cut energy and performance defects 5–20%.
Renewable EPC Delivery
Renewable EPC Delivery: Swinerton provides end-to-end engineering, procurement, and construction for solar and storage projects, coordinating interconnection work, SCADA integration, and performance testing to utility standards; US interconnection backlog exceeded 2,000 GW in 2024, driving rigorous queue management. Supply risk is mitigated via approved vendor lists and alternate suppliers; O&M handoff includes warranties and measured performance baselines targeting 99%+ availability.
- Scope: EPC
- Standards: Utility interconnection/SCADA
- Risk: Approved vendors/alternates
- Handoff: Warranties & performance baselines
Safety, Compliance & Risk Management
Comprehensive safety programs at Swinerton protect people and schedules, aligning with industry data that construction accounts for about 20% of US workplace fatalities (BLS). Regulatory compliance spans environmental, labor and building codes; contract risk is controlled through governance and documentation. Continuous improvement leverages incident analytics and lessons learned to reduce repeat events.
- Safety programs: workforce training, PPE, site audits
- Compliance: environmental, labor, building codes
- Risk controls: contract clauses, governance, insurance
- Improvement: incident analytics, lessons learned
VE saves 5–10%; DB speeds +33%; BIM cuts rework 50%
Detailed takeoffs, VE save 5–10% on project costs (2024); Target Value Delivery reduces change orders and aligns budget/schedule. Design-build accelerates delivery up to 33% vs DBB; BIM/VDC cuts field conflicts ~50% and trims rework. Lean practices cut waste ~30%; renewable EPC manages >2,000 GW US interconnection backlog (2024) with 99%+ availability targets.
| Metric | Impact | 2024 Data |
|---|---|---|
| Cost savings | Lower capex | 5–10% |
| Delivery speed | Faster completion | +33% |
| Rework reduction | Fewer conflicts | ~50% |
| Waste reduction | Lean gains | ~30% |
| Interconnection | Queue risk | >2,000 GW |
| Availability | O&M target | 99%+ |
Full Document Unlocks After Purchase
Business Model Canvas
The Swinerton Business Model Canvas preview shown here is the actual deliverable, not a mockup. When you purchase, you'll receive the exact same document with all sections included. Files are provided ready-to-edit in Word and Excel formats. No surprises—what you see is what you get.
Original: $10.00
-65%$10.00
$3.50Description
Business Model Canvas: concise value creation, go-to-market, scalable revenue strategies
Unlock the strategic blueprint behind Swinerton with our in-depth Business Model Canvas—three concise sections reveal value creation, go-to-market tactics, and scalable revenue streams. Ideal for investors, consultants, and founders seeking actionable insights; purchase the full downloadable Canvas to access every block, ready for benchmarking and strategic planning.
Partnerships
Architects & Engineering Firms
Collaborating with A/E firms enables integrated planning and seamless handoffs from design to build, with 2024 industry studies showing early A/E engagement can cut change orders by up to 30% and shorten schedules by ~15%. These partners supply structural, MEP and civil constructability expertise, and joint QA/QC frameworks have reduced code noncompliance incidents by ~25% in recent integrated projects.
Specialty Subcontractors & Trades
Swinerton’s specialty subcontractor partnerships in electrical, mechanical, concrete and envelope trades expand capacity and technical depth across 30+ regional markets, enabling rapid scaling on large programs. Prequalified networks backed by third-party audits maintain safety and quality and support labor availability across regions. Long-term agreements stabilize pricing and reduce mobilization time by shortening bid cycles. Shared scheduling tools have been shown to cut rework and delay-related costs by up to 20%.
Renewable Technology Providers
Partnerships with solar, storage and inverter OEMs enable turnkey renewable EPC delivery, leveraging supplier scale to meet IRA-era incentives such as the 30% ITC (2024). Technical alliances improve system design and procurement, lowering LCOE as battery pack costs fell ~89% since 2010 to about $132/kWh (2023). Joint commissioning shortens interconnection timelines and performance guarantees boost project bankability for lenders.
Suppliers & Distributors
Aggregated procurement with national suppliers in 2024 secures cost, lead-time, and warranty advantages by leveraging scale across steel, concrete, lumber, finishes, and high-voltage components; strategic sourcing reduces variability and improves project margins. VMI and just-in-time logistics cut site inventory and waste while data-sharing enhances demand forecasting and supply-chain resilience across active projects.
- Scale sourcing across core materials
- VMI/JIT to lower on-site stock
- Data-sharing for forecast accuracy
- Focus on warranties and lead-time reduction
Financial, Insurance & Surety Partners
Banking, bonding, and insurance partners enable large project capacity and risk transfer; surety lines support bid, performance, and payment bonds that typically equal 100% of contract value. OCIP/CCIP programs in 2024 continue to consolidate coverage to enhance safety and cost control. Advisory partners improve contract structuring and contingency planning to protect margins and cashflow.
- Banking: working capital & LOC
- Bonding: bid/performance/payment = 100% of contract
- Insurance: OCIP/CCIP centralize risk, reduce admin
- Advisory: contract wording & contingency planning
Integrated A/E cuts change orders 30% and schedules 15% while scaling 30+ markets
Integrated A/E partnerships cut change orders up to 30% and schedules ~15% (2024); specialty subs span 30+ regional markets supporting rapid scale; solar/storage OEMs leverage the 30% ITC (2024) while battery costs ~$132/kWh (2023) lower LCOE; banking/bonding enable bids with bonds = 100% contract value and OCIP/CCIP centralize risk.
| Metric | Value |
|---|---|
| Change orders | -30% |
| Schedule | -15% |
| Regional markets | 30+ |
| ITC (2024) | 30% |
| Battery cost (2023) | $132/kWh |
| Bonding | 100% CV |
What is included in the product
Detailed Word Document
A comprehensive, pre-written Business Model Canvas for Swinerton covering customer segments, channels, value propositions, revenue streams and key resources across the 9 BMC blocks, with SWOT-linked insights, competitive advantages, and a polished format ideal for presentations, funding and strategic decisions.
Customizable Excel Spreadsheet
High-level view of Swinerton’s business model with editable cells to quickly pinpoint operational bottlenecks and align teams on solutions.
Activities
Preconstruction & Estimating
Detailed takeoffs, budgeting, and value engineering drive cost certainty, with industry analyses in 2024 showing value-engineering interventions can lower project costs by 5–10% on average. Early constructability reviews reduce design risk and help avoid the common 15–20% cost growth seen in delayed designs. Target Value Delivery aligns scope, schedule, and budget to reduce change orders. Bid packaging and procurement strategies in 2024 expanded market coverage, improving competitive sourcing and award rates.
Design-Build Integration
Coordinating multidisciplinary design with construction accelerates delivery—design-build projects can be up to 33% faster than design-bid-build. BIM/VDC clash detection cuts field conflicts by as much as 50% and helps limit costly rework, which typically consumes 5–10% of contract value. Design-assist with key trades can reduce change orders roughly 20% while iterative design reviews keep compliance and owner intent above 95%.
Construction Management & Self-Perform
Site logistics, schedule control and rigorous quality management drive delivery consistency, with 2024 Lean Construction Institute data showing Lean practices can cut waste up to 30% and shorten cycle times. Strategic self-perform scopes increase predictability and industry analyses show roughly 15% fewer incidents and better schedule adherence. Daily huddles standardize communication; commissioning and turnover (ASHRAE 2024) cut energy and performance defects 5–20%.
Renewable EPC Delivery
Renewable EPC Delivery: Swinerton provides end-to-end engineering, procurement, and construction for solar and storage projects, coordinating interconnection work, SCADA integration, and performance testing to utility standards; US interconnection backlog exceeded 2,000 GW in 2024, driving rigorous queue management. Supply risk is mitigated via approved vendor lists and alternate suppliers; O&M handoff includes warranties and measured performance baselines targeting 99%+ availability.
- Scope: EPC
- Standards: Utility interconnection/SCADA
- Risk: Approved vendors/alternates
- Handoff: Warranties & performance baselines
Safety, Compliance & Risk Management
Comprehensive safety programs at Swinerton protect people and schedules, aligning with industry data that construction accounts for about 20% of US workplace fatalities (BLS). Regulatory compliance spans environmental, labor and building codes; contract risk is controlled through governance and documentation. Continuous improvement leverages incident analytics and lessons learned to reduce repeat events.
- Safety programs: workforce training, PPE, site audits
- Compliance: environmental, labor, building codes
- Risk controls: contract clauses, governance, insurance
- Improvement: incident analytics, lessons learned
VE saves 5–10%; DB speeds +33%; BIM cuts rework 50%
Detailed takeoffs, VE save 5–10% on project costs (2024); Target Value Delivery reduces change orders and aligns budget/schedule. Design-build accelerates delivery up to 33% vs DBB; BIM/VDC cuts field conflicts ~50% and trims rework. Lean practices cut waste ~30%; renewable EPC manages >2,000 GW US interconnection backlog (2024) with 99%+ availability targets.
| Metric | Impact | 2024 Data |
|---|---|---|
| Cost savings | Lower capex | 5–10% |
| Delivery speed | Faster completion | +33% |
| Rework reduction | Fewer conflicts | ~50% |
| Waste reduction | Lean gains | ~30% |
| Interconnection | Queue risk | >2,000 GW |
| Availability | O&M target | 99%+ |
Full Document Unlocks After Purchase
Business Model Canvas
The Swinerton Business Model Canvas preview shown here is the actual deliverable, not a mockup. When you purchase, you'll receive the exact same document with all sections included. Files are provided ready-to-edit in Word and Excel formats. No surprises—what you see is what you get.











