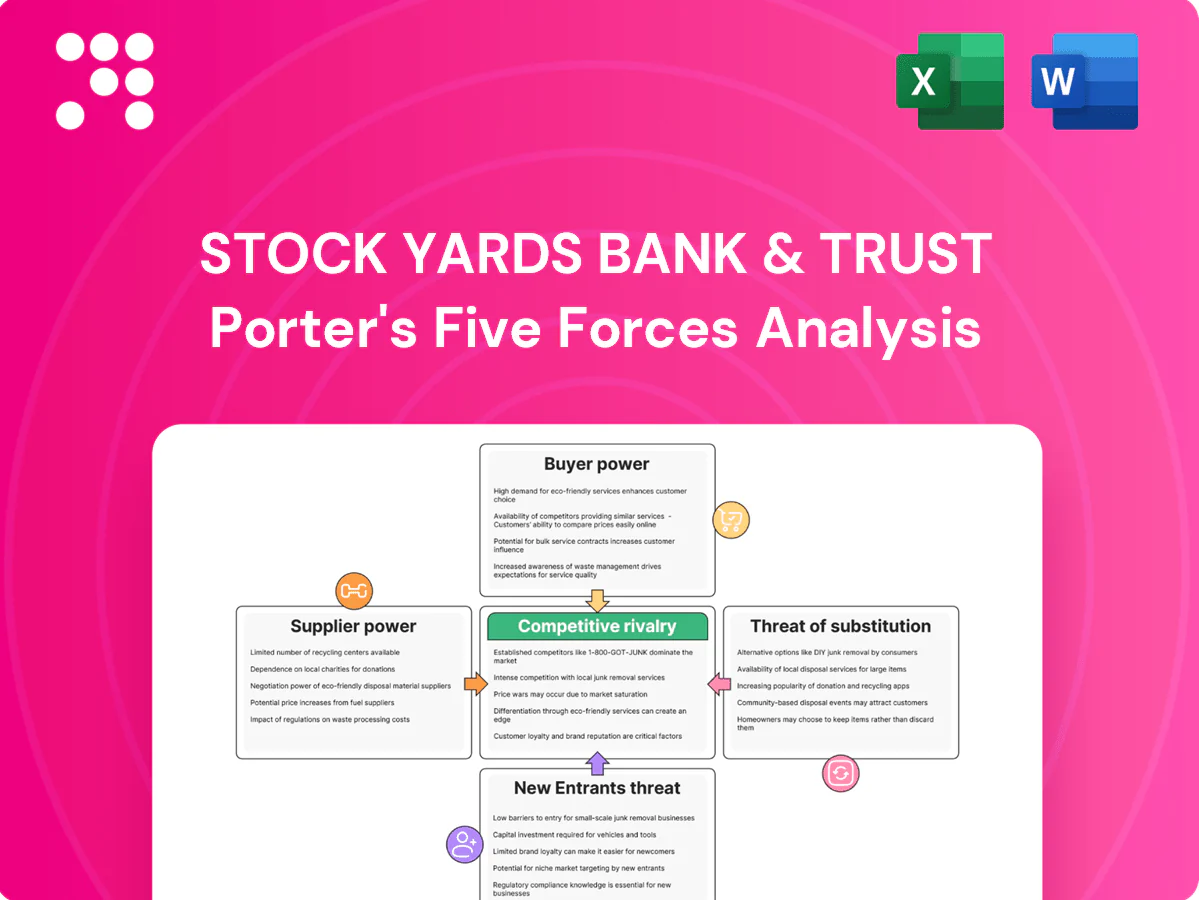
Stock Yards Bank & Trust Porter's Five Forces Analysis

Elevate Your Analysis with the Complete Porter's Five Forces Analysis
Stock Yards Bank & Trust operates in a regional banking market where customer loyalty, regulatory cost pressures, and digital disruptors shape profitability; its balance of community focus and branch network offers resilience but limits scale economies. Competitor consolidation raises competitive intensity while low switching costs empower borrowers. This brief snapshot only scratches the surface—unlock the full Porter's Five Forces Analysis for force-by-force ratings, visuals, and strategic implications.
Suppliers Bargaining Power

Concentrated core IT vendors
Core processing and digital banking platforms are concentrated among a few dominant vendors, increasing supplier leverage over Stock Yards Bank & Trust.
As of 2024, core migrations are costly and risky, typically costing $5M–$50M and taking 18–36 months, raising dependency on incumbent providers.
Vendors can influence pricing, contract terms, and innovation cadence; careful vendor management and multi-year agreements partially mitigate this power.
Deposit funding as supplier base
Depositors are the funding suppliers for Stock Yards Bank & Trust; in 2024, with the fed funds rate around 5.25–5.50%, rate-sensitive balances shifted toward higher yields, increasing depositor bargaining power. Rising-rate cycles pushed customers to demand higher yields, lifting bank funding costs. Competition from high-yield online banks offering roughly 4–5% savings in 2024 intensified pressure, while deep relationships and bundled services can reduce deposit beta.

Wholesale and capital market funding
Access to FHLB advances and brokered CDs brings external funding suppliers to Stock Yards Bank & Trust; with the federal funds target around 5.25% in 2024 brokered CD yields climbed above 5% in many markets, increasing supplier leverage. Market stress can widen spreads and tighten capacity, elevating supplier power and access risk. Reliance on wholesale funding raises interest expense volatility and refinancing risk. Maintaining diversified liquidity buffers and stable core deposits reduces exposure.

Skilled labor and advisory talent
Commercial lenders, private bankers, and wealth advisors remain scarce and highly mobile, driving supplier leverage over Stock Yards Bank & Trust as hiring pools tighten; BLS reported a May 2023 median wage for personal financial advisors of 96,090 USD, underpinning rising pay benchmarks into 2024.
Recruiters and labor markets exert pricing power through compensation expectations and counteroffers, while poaching elevates wage pressure and retention costs, with industry turnover in front-office roles frequently reported in the high teens to low twenties percent range in 2023–24.
Strong culture, targeted incentives, and clear career paths at Stock Yards can partially offset supplier power by reducing attrition and signaling long-term upside to talent.
- Talent scarcity: commercial lenders/private bankers/wealth advisors
- Compensation benchmark: personal financial advisor median wage 96,090 USD (BLS May 2023)
- Poaching risk: turnover pressure raising retention costs (high teens–low twenties % range, 2023–24)
- Mitigants: culture, incentives, career-path design
Regulatory and compliance infrastructure
Regulators act as gatekeepers for licenses and permissible activities, and 2024 saw intensified AML scrutiny that raised supervisory expectations for capital and liquidity controls; compliance technology and consulting vendors gained leverage as rules expanded. Changes in capital, liquidity, and AML standards increased operating costs, while proactive risk management limits vendor- and regulator-driven expense shocks.
- Regulatory gatekeeping: licensing & activity limits
- Vendor influence: regtech & consulting growth
- Cost drivers: capital, liquidity, AML standards
- Mitigation: proactive risk & vendor management
Core vendor leverage and deposit tightening raise funding costs; talent pricing pressures persist
Core banking vendors hold strong leverage (core migration $5M–$50M, 18–36 months). Deposit suppliers tightened in 2024 (fed funds 5.25–5.50%, brokered CD yields >5%), raising funding costs. Talent and regtech suppliers exert pricing power (PFA median wage 96,090 USD; turnover high-teens–low-twenties%), mitigated by culture and diversification.
| Supplier | 2024 metric | Impact |
|---|---|---|
| Core vendors | $5M–$50M;18–36m | High |
| Deposits | FFR 5.25–5.50%; CDs >5% | High |
| Talent | PFA 96,090 USD; turnover ~18–22% | Medium |
What is included in the product
 Detailed Word Document
Tailored Porter's Five Forces analysis of Stock Yards Bank & Trust uncovers competitive intensity, buyer and supplier power, entry barriers, and substitute threats, highlighting regulatory, technological, and regional factors that shape pricing, profitability, and strategic positioning.

 Customizable Excel Spreadsheet
A concise one-sheet Porter's Five Forces for Stock Yards Bank & Trust—perfect for quick risk assessment and board decisions, with customizable pressure levels to reflect shifting regulations and competitive moves.
Customers Bargaining Power

Rate-sensitive depositors
Rate-sensitive depositors can compare yields instantly, raising price transparency. As rates rose in 2022–24 customers negotiated or migrated to higher-paying accounts, boosting deposit beta and compressing margins. Stock Yards Bancorp reported about $4.7 billion in assets mid-2024, so regional margins face this pressure. Loyalty programs and relationship pricing can soften outflows.
Commercial clients with scale
Commercial clients with scale extract favorable loan pricing and covenants, forcing Stock Yards to compete on margins as 2024 FDIC data shows market concentration pressures among regional lenders.

Low switching costs in digital era
Account opening and payment-switching tools have reduced friction: the UK Current Account Switch Service reported a 99.99% successful switch rate in 2024, and global mobile banking adoption reached about 78% in 2024, enabling customers to move primary banking relationships with fewer hurdles. This empowers buyers to demand better UX, lower fees and higher rates, while differentiated service and local branch presence help Stock Yards Bank & Trust preserve loyalty.

Wealth management clients
- Robo fees: 0.20–0.50% (2024)
- National advisor range: 0.50–1.00% (2024)
- Higher transparency = greater fee scrutiny
- Fiduciary trust mitigates churn
Nonprofit and public sector accounts
Nonprofit and public sector accounts typically mandate competitive RFPs for banking services, making pricing, collateralization, and SLAs decisive—pressure that often compresses margins for providers like Stock Yards Bank & Trust. In 2024 the US municipal market remained sizable (≈4.0 trillion outstanding), keeping public-sector treasury flows and deposit competition intense. Strong references and tailored public-sector capabilities materially improve win rates.
- RFP-driven procurement: high
- Key levers: pricing, collateral, SLAs
- Margin impact: downward pressure
- Win factors: references, specialized capabilities
78% mobile, rate-sensitive deposits and ≈$4.7B regional assets squeeze margins
Rate-sensitive depositors and 78% mobile banking adoption (2024) raise switching and deposit beta; Stock Yards Bancorp had ≈$4.7B assets mid-2024, pressuring margins. Commercial clients and RFP-driven public accounts (US municipal stock ≈$4.0T) force competitive pricing. Wealth fees benchmark to robo 0.20–0.50% and national 0.50–1.00% (2024), increasing fee scrutiny.
| Metric | 2024 Value | Impact |
|---|---|---|
| Assets (Stock Yards) | $4.7B | Regional margin pressure |
| Mobile adoption | 78% | Higher switching |
| Municipal market | $4.0T | RFP competition |
| Robo fees | 0.20–0.50% | Fee benchmarking |
Preview Before You Purchase
Stock Yards Bank & Trust Porter's Five Forces Analysis
This Porter's Five Forces Analysis of Stock Yards Bank & Trust examines competitive rivalry, supplier and buyer power, threats of entry and substitution, and strategic implications for profitability. This preview is the exact, fully formatted document you will receive instantly after purchase. No placeholders or samples—download and use it immediately.

Elevate Your Analysis with the Complete Porter's Five Forces Analysis
Stock Yards Bank & Trust operates in a regional banking market where customer loyalty, regulatory cost pressures, and digital disruptors shape profitability; its balance of community focus and branch network offers resilience but limits scale economies. Competitor consolidation raises competitive intensity while low switching costs empower borrowers. This brief snapshot only scratches the surface—unlock the full Porter's Five Forces Analysis for force-by-force ratings, visuals, and strategic implications.
Suppliers Bargaining Power
Concentrated core IT vendors
Core processing and digital banking platforms are concentrated among a few dominant vendors, increasing supplier leverage over Stock Yards Bank & Trust.
As of 2024, core migrations are costly and risky, typically costing $5M–$50M and taking 18–36 months, raising dependency on incumbent providers.
Vendors can influence pricing, contract terms, and innovation cadence; careful vendor management and multi-year agreements partially mitigate this power.
Deposit funding as supplier base
Depositors are the funding suppliers for Stock Yards Bank & Trust; in 2024, with the fed funds rate around 5.25–5.50%, rate-sensitive balances shifted toward higher yields, increasing depositor bargaining power. Rising-rate cycles pushed customers to demand higher yields, lifting bank funding costs. Competition from high-yield online banks offering roughly 4–5% savings in 2024 intensified pressure, while deep relationships and bundled services can reduce deposit beta.
Wholesale and capital market funding
Access to FHLB advances and brokered CDs brings external funding suppliers to Stock Yards Bank & Trust; with the federal funds target around 5.25% in 2024 brokered CD yields climbed above 5% in many markets, increasing supplier leverage. Market stress can widen spreads and tighten capacity, elevating supplier power and access risk. Reliance on wholesale funding raises interest expense volatility and refinancing risk. Maintaining diversified liquidity buffers and stable core deposits reduces exposure.
Skilled labor and advisory talent
Commercial lenders, private bankers, and wealth advisors remain scarce and highly mobile, driving supplier leverage over Stock Yards Bank & Trust as hiring pools tighten; BLS reported a May 2023 median wage for personal financial advisors of 96,090 USD, underpinning rising pay benchmarks into 2024.
Recruiters and labor markets exert pricing power through compensation expectations and counteroffers, while poaching elevates wage pressure and retention costs, with industry turnover in front-office roles frequently reported in the high teens to low twenties percent range in 2023–24.
Strong culture, targeted incentives, and clear career paths at Stock Yards can partially offset supplier power by reducing attrition and signaling long-term upside to talent.
- Talent scarcity: commercial lenders/private bankers/wealth advisors
- Compensation benchmark: personal financial advisor median wage 96,090 USD (BLS May 2023)
- Poaching risk: turnover pressure raising retention costs (high teens–low twenties % range, 2023–24)
- Mitigants: culture, incentives, career-path design
Regulatory and compliance infrastructure
Regulators act as gatekeepers for licenses and permissible activities, and 2024 saw intensified AML scrutiny that raised supervisory expectations for capital and liquidity controls; compliance technology and consulting vendors gained leverage as rules expanded. Changes in capital, liquidity, and AML standards increased operating costs, while proactive risk management limits vendor- and regulator-driven expense shocks.
- Regulatory gatekeeping: licensing & activity limits
- Vendor influence: regtech & consulting growth
- Cost drivers: capital, liquidity, AML standards
- Mitigation: proactive risk & vendor management
Core vendor leverage and deposit tightening raise funding costs; talent pricing pressures persist
Core banking vendors hold strong leverage (core migration $5M–$50M, 18–36 months). Deposit suppliers tightened in 2024 (fed funds 5.25–5.50%, brokered CD yields >5%), raising funding costs. Talent and regtech suppliers exert pricing power (PFA median wage 96,090 USD; turnover high-teens–low-twenties%), mitigated by culture and diversification.
| Supplier | 2024 metric | Impact |
|---|---|---|
| Core vendors | $5M–$50M;18–36m | High |
| Deposits | FFR 5.25–5.50%; CDs >5% | High |
| Talent | PFA 96,090 USD; turnover ~18–22% | Medium |
What is included in the product
Detailed Word Document
Tailored Porter's Five Forces analysis of Stock Yards Bank & Trust uncovers competitive intensity, buyer and supplier power, entry barriers, and substitute threats, highlighting regulatory, technological, and regional factors that shape pricing, profitability, and strategic positioning.
Customizable Excel Spreadsheet
A concise one-sheet Porter's Five Forces for Stock Yards Bank & Trust—perfect for quick risk assessment and board decisions, with customizable pressure levels to reflect shifting regulations and competitive moves.
Customers Bargaining Power
Rate-sensitive depositors
Rate-sensitive depositors can compare yields instantly, raising price transparency. As rates rose in 2022–24 customers negotiated or migrated to higher-paying accounts, boosting deposit beta and compressing margins. Stock Yards Bancorp reported about $4.7 billion in assets mid-2024, so regional margins face this pressure. Loyalty programs and relationship pricing can soften outflows.
Commercial clients with scale
Commercial clients with scale extract favorable loan pricing and covenants, forcing Stock Yards to compete on margins as 2024 FDIC data shows market concentration pressures among regional lenders.
Low switching costs in digital era
Account opening and payment-switching tools have reduced friction: the UK Current Account Switch Service reported a 99.99% successful switch rate in 2024, and global mobile banking adoption reached about 78% in 2024, enabling customers to move primary banking relationships with fewer hurdles. This empowers buyers to demand better UX, lower fees and higher rates, while differentiated service and local branch presence help Stock Yards Bank & Trust preserve loyalty.
Wealth management clients
- Robo fees: 0.20–0.50% (2024)
- National advisor range: 0.50–1.00% (2024)
- Higher transparency = greater fee scrutiny
- Fiduciary trust mitigates churn
Nonprofit and public sector accounts
Nonprofit and public sector accounts typically mandate competitive RFPs for banking services, making pricing, collateralization, and SLAs decisive—pressure that often compresses margins for providers like Stock Yards Bank & Trust. In 2024 the US municipal market remained sizable (≈4.0 trillion outstanding), keeping public-sector treasury flows and deposit competition intense. Strong references and tailored public-sector capabilities materially improve win rates.
- RFP-driven procurement: high
- Key levers: pricing, collateral, SLAs
- Margin impact: downward pressure
- Win factors: references, specialized capabilities
78% mobile, rate-sensitive deposits and ≈$4.7B regional assets squeeze margins
Rate-sensitive depositors and 78% mobile banking adoption (2024) raise switching and deposit beta; Stock Yards Bancorp had ≈$4.7B assets mid-2024, pressuring margins. Commercial clients and RFP-driven public accounts (US municipal stock ≈$4.0T) force competitive pricing. Wealth fees benchmark to robo 0.20–0.50% and national 0.50–1.00% (2024), increasing fee scrutiny.
| Metric | 2024 Value | Impact |
|---|---|---|
| Assets (Stock Yards) | $4.7B | Regional margin pressure |
| Mobile adoption | 78% | Higher switching |
| Municipal market | $4.0T | RFP competition |
| Robo fees | 0.20–0.50% | Fee benchmarking |
Preview Before You Purchase
Stock Yards Bank & Trust Porter's Five Forces Analysis
This Porter's Five Forces Analysis of Stock Yards Bank & Trust examines competitive rivalry, supplier and buyer power, threats of entry and substitution, and strategic implications for profitability. This preview is the exact, fully formatted document you will receive instantly after purchase. No placeholders or samples—download and use it immediately.
Description
Elevate Your Analysis with the Complete Porter's Five Forces Analysis
Stock Yards Bank & Trust operates in a regional banking market where customer loyalty, regulatory cost pressures, and digital disruptors shape profitability; its balance of community focus and branch network offers resilience but limits scale economies. Competitor consolidation raises competitive intensity while low switching costs empower borrowers. This brief snapshot only scratches the surface—unlock the full Porter's Five Forces Analysis for force-by-force ratings, visuals, and strategic implications.
Suppliers Bargaining Power
Concentrated core IT vendors
Core processing and digital banking platforms are concentrated among a few dominant vendors, increasing supplier leverage over Stock Yards Bank & Trust.
As of 2024, core migrations are costly and risky, typically costing $5M–$50M and taking 18–36 months, raising dependency on incumbent providers.
Vendors can influence pricing, contract terms, and innovation cadence; careful vendor management and multi-year agreements partially mitigate this power.
Deposit funding as supplier base
Depositors are the funding suppliers for Stock Yards Bank & Trust; in 2024, with the fed funds rate around 5.25–5.50%, rate-sensitive balances shifted toward higher yields, increasing depositor bargaining power. Rising-rate cycles pushed customers to demand higher yields, lifting bank funding costs. Competition from high-yield online banks offering roughly 4–5% savings in 2024 intensified pressure, while deep relationships and bundled services can reduce deposit beta.
Wholesale and capital market funding
Access to FHLB advances and brokered CDs brings external funding suppliers to Stock Yards Bank & Trust; with the federal funds target around 5.25% in 2024 brokered CD yields climbed above 5% in many markets, increasing supplier leverage. Market stress can widen spreads and tighten capacity, elevating supplier power and access risk. Reliance on wholesale funding raises interest expense volatility and refinancing risk. Maintaining diversified liquidity buffers and stable core deposits reduces exposure.
Skilled labor and advisory talent
Commercial lenders, private bankers, and wealth advisors remain scarce and highly mobile, driving supplier leverage over Stock Yards Bank & Trust as hiring pools tighten; BLS reported a May 2023 median wage for personal financial advisors of 96,090 USD, underpinning rising pay benchmarks into 2024.
Recruiters and labor markets exert pricing power through compensation expectations and counteroffers, while poaching elevates wage pressure and retention costs, with industry turnover in front-office roles frequently reported in the high teens to low twenties percent range in 2023–24.
Strong culture, targeted incentives, and clear career paths at Stock Yards can partially offset supplier power by reducing attrition and signaling long-term upside to talent.
- Talent scarcity: commercial lenders/private bankers/wealth advisors
- Compensation benchmark: personal financial advisor median wage 96,090 USD (BLS May 2023)
- Poaching risk: turnover pressure raising retention costs (high teens–low twenties % range, 2023–24)
- Mitigants: culture, incentives, career-path design
Regulatory and compliance infrastructure
Regulators act as gatekeepers for licenses and permissible activities, and 2024 saw intensified AML scrutiny that raised supervisory expectations for capital and liquidity controls; compliance technology and consulting vendors gained leverage as rules expanded. Changes in capital, liquidity, and AML standards increased operating costs, while proactive risk management limits vendor- and regulator-driven expense shocks.
- Regulatory gatekeeping: licensing & activity limits
- Vendor influence: regtech & consulting growth
- Cost drivers: capital, liquidity, AML standards
- Mitigation: proactive risk & vendor management
Core vendor leverage and deposit tightening raise funding costs; talent pricing pressures persist
Core banking vendors hold strong leverage (core migration $5M–$50M, 18–36 months). Deposit suppliers tightened in 2024 (fed funds 5.25–5.50%, brokered CD yields >5%), raising funding costs. Talent and regtech suppliers exert pricing power (PFA median wage 96,090 USD; turnover high-teens–low-twenties%), mitigated by culture and diversification.
| Supplier | 2024 metric | Impact |
|---|---|---|
| Core vendors | $5M–$50M;18–36m | High |
| Deposits | FFR 5.25–5.50%; CDs >5% | High |
| Talent | PFA 96,090 USD; turnover ~18–22% | Medium |
What is included in the product
Detailed Word Document
Tailored Porter's Five Forces analysis of Stock Yards Bank & Trust uncovers competitive intensity, buyer and supplier power, entry barriers, and substitute threats, highlighting regulatory, technological, and regional factors that shape pricing, profitability, and strategic positioning.
Customizable Excel Spreadsheet
A concise one-sheet Porter's Five Forces for Stock Yards Bank & Trust—perfect for quick risk assessment and board decisions, with customizable pressure levels to reflect shifting regulations and competitive moves.
Customers Bargaining Power
Rate-sensitive depositors
Rate-sensitive depositors can compare yields instantly, raising price transparency. As rates rose in 2022–24 customers negotiated or migrated to higher-paying accounts, boosting deposit beta and compressing margins. Stock Yards Bancorp reported about $4.7 billion in assets mid-2024, so regional margins face this pressure. Loyalty programs and relationship pricing can soften outflows.
Commercial clients with scale
Commercial clients with scale extract favorable loan pricing and covenants, forcing Stock Yards to compete on margins as 2024 FDIC data shows market concentration pressures among regional lenders.
Low switching costs in digital era
Account opening and payment-switching tools have reduced friction: the UK Current Account Switch Service reported a 99.99% successful switch rate in 2024, and global mobile banking adoption reached about 78% in 2024, enabling customers to move primary banking relationships with fewer hurdles. This empowers buyers to demand better UX, lower fees and higher rates, while differentiated service and local branch presence help Stock Yards Bank & Trust preserve loyalty.
Wealth management clients
- Robo fees: 0.20–0.50% (2024)
- National advisor range: 0.50–1.00% (2024)
- Higher transparency = greater fee scrutiny
- Fiduciary trust mitigates churn
Nonprofit and public sector accounts
Nonprofit and public sector accounts typically mandate competitive RFPs for banking services, making pricing, collateralization, and SLAs decisive—pressure that often compresses margins for providers like Stock Yards Bank & Trust. In 2024 the US municipal market remained sizable (≈4.0 trillion outstanding), keeping public-sector treasury flows and deposit competition intense. Strong references and tailored public-sector capabilities materially improve win rates.
- RFP-driven procurement: high
- Key levers: pricing, collateral, SLAs
- Margin impact: downward pressure
- Win factors: references, specialized capabilities
78% mobile, rate-sensitive deposits and ≈$4.7B regional assets squeeze margins
Rate-sensitive depositors and 78% mobile banking adoption (2024) raise switching and deposit beta; Stock Yards Bancorp had ≈$4.7B assets mid-2024, pressuring margins. Commercial clients and RFP-driven public accounts (US municipal stock ≈$4.0T) force competitive pricing. Wealth fees benchmark to robo 0.20–0.50% and national 0.50–1.00% (2024), increasing fee scrutiny.
| Metric | 2024 Value | Impact |
|---|---|---|
| Assets (Stock Yards) | $4.7B | Regional margin pressure |
| Mobile adoption | 78% | Higher switching |
| Municipal market | $4.0T | RFP competition |
| Robo fees | 0.20–0.50% | Fee benchmarking |
Preview Before You Purchase
Stock Yards Bank & Trust Porter's Five Forces Analysis
This Porter's Five Forces Analysis of Stock Yards Bank & Trust examines competitive rivalry, supplier and buyer power, threats of entry and substitution, and strategic implications for profitability. This preview is the exact, fully formatted document you will receive instantly after purchase. No placeholders or samples—download and use it immediately.











