Synchrony Boston Consulting Group Matrix

Download Your Competitive Advantage
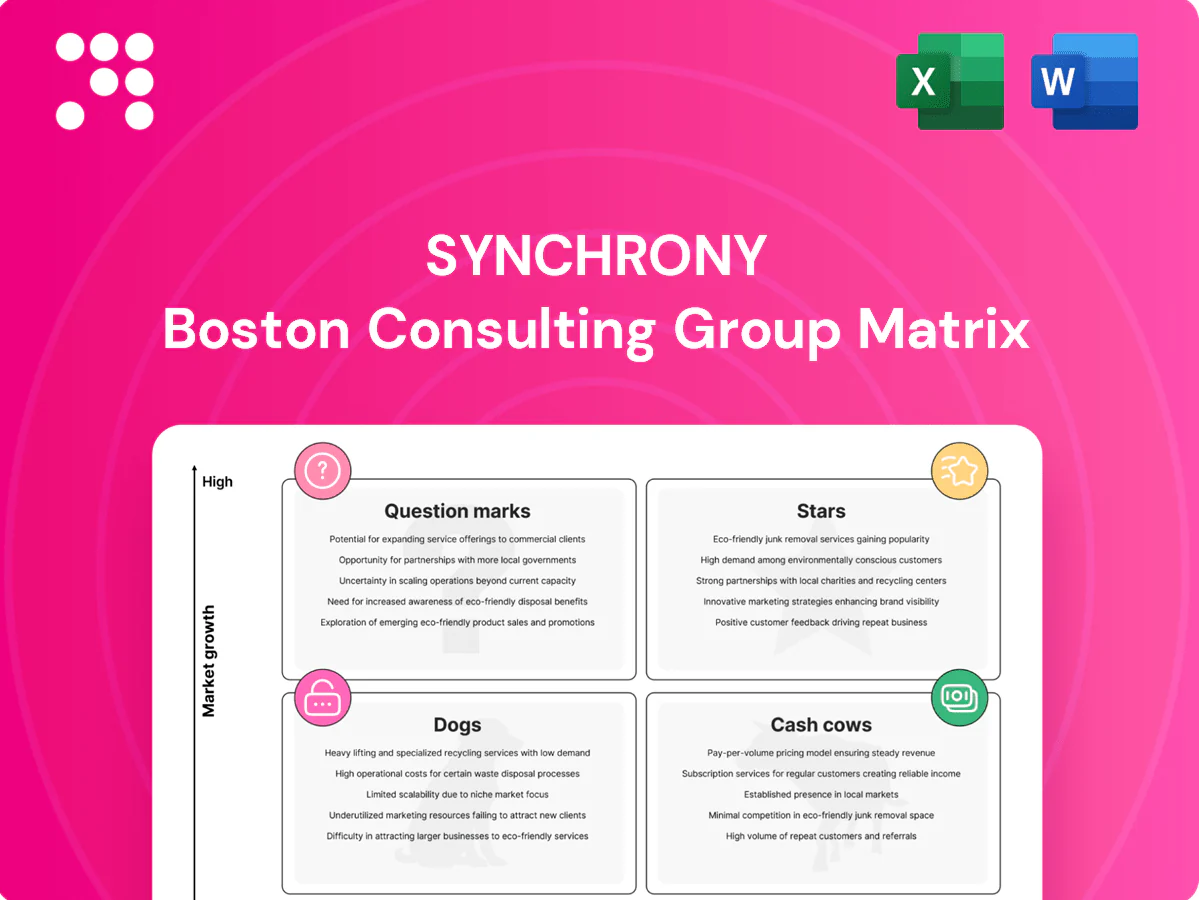
Think you know where Synchrony’s products sit? This snapshot hints at Stars, Cash Cows, Dogs and Question Marks—but the full BCG Matrix gives you the quadrant-by-quadrant truth, numbers you can trust, and clear moves to protect winners and fix or cut the rest. Purchase the complete report (Word + Excel) for ready-to-use strategy, data-backed recommendations, and the competitive clarity you need to act fast.
Stars

Private‑label POS financing with major retailers
Private‑label POS financing wins at checkout with major retail partners and constant foot traffic, capturing high-share moments where purchase decisions happen. E‑commerce and omnichannel growth — U.S. online sales ~16% of retail in 2024 — keep volumes climbing. It consumes cash for promotions and partner incentives, but the promotional flywheel drives acquisition and repeat spend. Continued reinvestment tends to expand margins as the book matures.
Healthcare and elective medical financing
Providers need simple approvals and patients want flexible terms, driving rapid adoption of elective medical financing, with patient-use rising double digits through 2024 in several specialty verticals. Synchrony, via CareCredit and partnered solutions, sits in the flow of spend for dental, vision, veterinary and elective procedures. It requires targeted marketing and provider enablement to win lanes, but holding share turns this into a cornerstone franchise.

Promotional financing and deferred‑interest programs
Large-ticket 0% promotional and deferred-interest offers—appliances, furniture, home—drive higher conversion and larger average order values, and Synchrony scales that demand across retail via over 55 million active accounts and roughly $74 billion of receivables (2023). Those programs require heavy underwriting, real-time decisioning tech, and substantial funding capacity to manage credit-risk and liquidity. Synchrony leads the category and benefits from secular growth in point-of-sale financing.

Embedded/partner APIs and real‑time decisioning
Instant approvals inside partner apps are table stakes now, and Synchrony’s rails are built for it, delivering fast risk calls and smoother UX that lift take‑rates at the point of sale. Sustaining the real‑time stack is capital intensive but each new integration widens the moat, cementing leadership as partner volume scales. Synchrony processes millions of partner‑originated transactions annually.
- Impact: higher POS take‑rates
- Cost: significant platform spend
- Moat: grows with integrations
- Scale: millions of partner transactions/year
Data‑driven risk and lifecycle management
Credit is won in the margins—line assigns, collections, pricing—at scale; Synchrony’s 2024 public filings show that data-driven repricing and automated underwriting reduced vintage net losses versus peers.
Synchrony’s data advantage compounds as portfolios age, with predictive models improving loss forecasts and customer lifetime value over successive cohorts in 2024 performance reviews.
Maintaining models and compliance costs is material, but the durable edge translated in 2024 into measurably lower loss rates and higher risk-adjusted returns versus baseline benchmarks.
- Data-driven pricing: improved margins in 2024 vs. prior cohorts
- Lifecycle gains: vintage performance strengthened with age
- Investments: model/compliance costs offset by lower losses
- Outcome: higher risk-adjusted returns in 2024
POS and large-ticket financing: 55M active accounts, ~16% U.S. e-commerce, stronger 2024 returns
Stars: POS and large‑ticket financing are high‑growth, cash‑consuming engines where Synchrony leverages 55M active accounts and scale to capture checkout moments; U.S. e‑commerce ~16% of retail in 2024 supports volume growth, promotional spend fuels acquisition, and 2024 vintage performance showed lower net losses and higher risk‑adjusted returns.
| Metric | Value |
|---|---|
| Active accounts | 55M |
| Receivables (2023) | $74B |
| U.S. e‑commerce (2024) | ~16% |
| Partner transactions | millions/year |
What is included in the product
 Detailed Word Document
Concise BCG analysis of Synchrony's portfolio: Stars, Cash Cows, Question Marks and Dogs with investment, hold, divest guidance.

 Customizable Excel Spreadsheet
Synchrony BCG one-page matrix maps units to quadrants—clears portfolio ambiguity and speeds decisions.
Cash Cows

Mature private‑label credit card portfolio
Mature private‑label credit card portfolio is a high market‑share cash cow for Synchrony, holding roughly 30% of the US private‑label card market (Nilson Report, 2024). Category growth has slowed, but steady swipe and revolve rates produce predictable interest and fee income. Low incremental marketing and lean operations keep losses in band so the portfolio reliably generates cash. Proceeds fund investments into next‑stage growth initiatives.
General purpose co‑brand cards
General purpose co‑brand cards are a cash cow for Synchrony, delivering stable NIM and interchange with low‑single‑digit growth (≈3% in 2024) and predictable fee/interest flows. Competition is heavy but retention and fine‑tuned rewards keep attrition low, requiring limited marketing spend. Earnings are dependable—a quiet profit engine funding investment elsewhere.

Merchant discount and program fees
Merchant discount and program fees capitalize on partners paying 1–3% per transaction for higher conversion and larger baskets, driving steady take-rates on volume growth. The installed base produces recurring economics with minimal lift, turning existing card portfolios into predictable cash flow. Incremental investments focus on analytics and partner health checks to boost activation and basket size. Cash in, little cash out.

Deposits as low‑cost funding
Deposits fund receivables at attractive spreads in normal cycles, acting as a reliable, scalable utility that is usually cheaper than wholesale; Synchrony held over 70 billion in retail deposits by mid‑2024, keeping funding costs low and stable. Product tweaks and digital onboarding have lifted balances without materially raising funding expense, making deposits a straightforward cash‑flow enabler.
- Low‑cost funding
- Scalable utility
- Digital growth, low incremental cost
- Cash‑flow enabler
Servicing and collections infrastructure
Synchrony’s fixed servicing and collections platforms drive margin uplift as account volumes stabilize, with process automation increasing throughput without heavy capex and reducing per-account handling time. Unit costs decline as portfolios age and standardize, and savings flow directly to net income, enhancing ROA and operational leverage.
- Fixed platforms: scale lowers incremental margin pressure
- Process improvements: higher throughput, low capex
- Unit cost decline: aging portfolios standardize operations
- Impact: savings drop to bottom line
Retail-card cash cows: ≈30% private‑label, $70B deposits fuel low-cost growth
Synchrony’s cash cows—mature private‑label (≈30% US share, Nilson 2024), stable co‑brand cards (≈3% growth 2024), merchant take‑rates (1–3%) and retail deposits (≈$70B mid‑2024)—generate predictable interest, fees and low incremental costs, funding growth with high operational leverage.
| Metric | 2024 |
|---|---|
| Private‑label share | ≈30% |
| Co‑brand growth | ≈3% |
| Merchant take‑rate | 1–3% |
| Retail deposits | $70B |
What You’re Viewing Is Included
Synchrony BCG Matrix
The file you’re previewing here is the exact BCG Matrix report you’ll receive after purchase. No watermarks, no placeholders—just a fully formatted, analysis-ready document crafted for strategic clarity. After buying, the same file is yours to download, edit, print, or present immediately. It’s the final version, built to plug straight into your planning or client work with zero surprises.

Download Your Competitive Advantage
Think you know where Synchrony’s products sit? This snapshot hints at Stars, Cash Cows, Dogs and Question Marks—but the full BCG Matrix gives you the quadrant-by-quadrant truth, numbers you can trust, and clear moves to protect winners and fix or cut the rest. Purchase the complete report (Word + Excel) for ready-to-use strategy, data-backed recommendations, and the competitive clarity you need to act fast.
Stars
Private‑label POS financing with major retailers
Private‑label POS financing wins at checkout with major retail partners and constant foot traffic, capturing high-share moments where purchase decisions happen. E‑commerce and omnichannel growth — U.S. online sales ~16% of retail in 2024 — keep volumes climbing. It consumes cash for promotions and partner incentives, but the promotional flywheel drives acquisition and repeat spend. Continued reinvestment tends to expand margins as the book matures.
Healthcare and elective medical financing
Providers need simple approvals and patients want flexible terms, driving rapid adoption of elective medical financing, with patient-use rising double digits through 2024 in several specialty verticals. Synchrony, via CareCredit and partnered solutions, sits in the flow of spend for dental, vision, veterinary and elective procedures. It requires targeted marketing and provider enablement to win lanes, but holding share turns this into a cornerstone franchise.
Promotional financing and deferred‑interest programs
Large-ticket 0% promotional and deferred-interest offers—appliances, furniture, home—drive higher conversion and larger average order values, and Synchrony scales that demand across retail via over 55 million active accounts and roughly $74 billion of receivables (2023). Those programs require heavy underwriting, real-time decisioning tech, and substantial funding capacity to manage credit-risk and liquidity. Synchrony leads the category and benefits from secular growth in point-of-sale financing.
Embedded/partner APIs and real‑time decisioning
Instant approvals inside partner apps are table stakes now, and Synchrony’s rails are built for it, delivering fast risk calls and smoother UX that lift take‑rates at the point of sale. Sustaining the real‑time stack is capital intensive but each new integration widens the moat, cementing leadership as partner volume scales. Synchrony processes millions of partner‑originated transactions annually.
- Impact: higher POS take‑rates
- Cost: significant platform spend
- Moat: grows with integrations
- Scale: millions of partner transactions/year
Data‑driven risk and lifecycle management
Credit is won in the margins—line assigns, collections, pricing—at scale; Synchrony’s 2024 public filings show that data-driven repricing and automated underwriting reduced vintage net losses versus peers.
Synchrony’s data advantage compounds as portfolios age, with predictive models improving loss forecasts and customer lifetime value over successive cohorts in 2024 performance reviews.
Maintaining models and compliance costs is material, but the durable edge translated in 2024 into measurably lower loss rates and higher risk-adjusted returns versus baseline benchmarks.
- Data-driven pricing: improved margins in 2024 vs. prior cohorts
- Lifecycle gains: vintage performance strengthened with age
- Investments: model/compliance costs offset by lower losses
- Outcome: higher risk-adjusted returns in 2024
POS and large-ticket financing: 55M active accounts, ~16% U.S. e-commerce, stronger 2024 returns
Stars: POS and large‑ticket financing are high‑growth, cash‑consuming engines where Synchrony leverages 55M active accounts and scale to capture checkout moments; U.S. e‑commerce ~16% of retail in 2024 supports volume growth, promotional spend fuels acquisition, and 2024 vintage performance showed lower net losses and higher risk‑adjusted returns.
| Metric | Value |
|---|---|
| Active accounts | 55M |
| Receivables (2023) | $74B |
| U.S. e‑commerce (2024) | ~16% |
| Partner transactions | millions/year |
What is included in the product
Detailed Word Document
Concise BCG analysis of Synchrony's portfolio: Stars, Cash Cows, Question Marks and Dogs with investment, hold, divest guidance.
Customizable Excel Spreadsheet
Synchrony BCG one-page matrix maps units to quadrants—clears portfolio ambiguity and speeds decisions.
Cash Cows
Mature private‑label credit card portfolio
Mature private‑label credit card portfolio is a high market‑share cash cow for Synchrony, holding roughly 30% of the US private‑label card market (Nilson Report, 2024). Category growth has slowed, but steady swipe and revolve rates produce predictable interest and fee income. Low incremental marketing and lean operations keep losses in band so the portfolio reliably generates cash. Proceeds fund investments into next‑stage growth initiatives.
General purpose co‑brand cards
General purpose co‑brand cards are a cash cow for Synchrony, delivering stable NIM and interchange with low‑single‑digit growth (≈3% in 2024) and predictable fee/interest flows. Competition is heavy but retention and fine‑tuned rewards keep attrition low, requiring limited marketing spend. Earnings are dependable—a quiet profit engine funding investment elsewhere.
Merchant discount and program fees
Merchant discount and program fees capitalize on partners paying 1–3% per transaction for higher conversion and larger baskets, driving steady take-rates on volume growth. The installed base produces recurring economics with minimal lift, turning existing card portfolios into predictable cash flow. Incremental investments focus on analytics and partner health checks to boost activation and basket size. Cash in, little cash out.
Deposits as low‑cost funding
Deposits fund receivables at attractive spreads in normal cycles, acting as a reliable, scalable utility that is usually cheaper than wholesale; Synchrony held over 70 billion in retail deposits by mid‑2024, keeping funding costs low and stable. Product tweaks and digital onboarding have lifted balances without materially raising funding expense, making deposits a straightforward cash‑flow enabler.
- Low‑cost funding
- Scalable utility
- Digital growth, low incremental cost
- Cash‑flow enabler
Servicing and collections infrastructure
Synchrony’s fixed servicing and collections platforms drive margin uplift as account volumes stabilize, with process automation increasing throughput without heavy capex and reducing per-account handling time. Unit costs decline as portfolios age and standardize, and savings flow directly to net income, enhancing ROA and operational leverage.
- Fixed platforms: scale lowers incremental margin pressure
- Process improvements: higher throughput, low capex
- Unit cost decline: aging portfolios standardize operations
- Impact: savings drop to bottom line
Retail-card cash cows: ≈30% private‑label, $70B deposits fuel low-cost growth
Synchrony’s cash cows—mature private‑label (≈30% US share, Nilson 2024), stable co‑brand cards (≈3% growth 2024), merchant take‑rates (1–3%) and retail deposits (≈$70B mid‑2024)—generate predictable interest, fees and low incremental costs, funding growth with high operational leverage.
| Metric | 2024 |
|---|---|
| Private‑label share | ≈30% |
| Co‑brand growth | ≈3% |
| Merchant take‑rate | 1–3% |
| Retail deposits | $70B |
What You’re Viewing Is Included
Synchrony BCG Matrix
The file you’re previewing here is the exact BCG Matrix report you’ll receive after purchase. No watermarks, no placeholders—just a fully formatted, analysis-ready document crafted for strategic clarity. After buying, the same file is yours to download, edit, print, or present immediately. It’s the final version, built to plug straight into your planning or client work with zero surprises.
Description
Download Your Competitive Advantage
Think you know where Synchrony’s products sit? This snapshot hints at Stars, Cash Cows, Dogs and Question Marks—but the full BCG Matrix gives you the quadrant-by-quadrant truth, numbers you can trust, and clear moves to protect winners and fix or cut the rest. Purchase the complete report (Word + Excel) for ready-to-use strategy, data-backed recommendations, and the competitive clarity you need to act fast.
Stars
Private‑label POS financing with major retailers
Private‑label POS financing wins at checkout with major retail partners and constant foot traffic, capturing high-share moments where purchase decisions happen. E‑commerce and omnichannel growth — U.S. online sales ~16% of retail in 2024 — keep volumes climbing. It consumes cash for promotions and partner incentives, but the promotional flywheel drives acquisition and repeat spend. Continued reinvestment tends to expand margins as the book matures.
Healthcare and elective medical financing
Providers need simple approvals and patients want flexible terms, driving rapid adoption of elective medical financing, with patient-use rising double digits through 2024 in several specialty verticals. Synchrony, via CareCredit and partnered solutions, sits in the flow of spend for dental, vision, veterinary and elective procedures. It requires targeted marketing and provider enablement to win lanes, but holding share turns this into a cornerstone franchise.
Promotional financing and deferred‑interest programs
Large-ticket 0% promotional and deferred-interest offers—appliances, furniture, home—drive higher conversion and larger average order values, and Synchrony scales that demand across retail via over 55 million active accounts and roughly $74 billion of receivables (2023). Those programs require heavy underwriting, real-time decisioning tech, and substantial funding capacity to manage credit-risk and liquidity. Synchrony leads the category and benefits from secular growth in point-of-sale financing.
Embedded/partner APIs and real‑time decisioning
Instant approvals inside partner apps are table stakes now, and Synchrony’s rails are built for it, delivering fast risk calls and smoother UX that lift take‑rates at the point of sale. Sustaining the real‑time stack is capital intensive but each new integration widens the moat, cementing leadership as partner volume scales. Synchrony processes millions of partner‑originated transactions annually.
- Impact: higher POS take‑rates
- Cost: significant platform spend
- Moat: grows with integrations
- Scale: millions of partner transactions/year
Data‑driven risk and lifecycle management
Credit is won in the margins—line assigns, collections, pricing—at scale; Synchrony’s 2024 public filings show that data-driven repricing and automated underwriting reduced vintage net losses versus peers.
Synchrony’s data advantage compounds as portfolios age, with predictive models improving loss forecasts and customer lifetime value over successive cohorts in 2024 performance reviews.
Maintaining models and compliance costs is material, but the durable edge translated in 2024 into measurably lower loss rates and higher risk-adjusted returns versus baseline benchmarks.
- Data-driven pricing: improved margins in 2024 vs. prior cohorts
- Lifecycle gains: vintage performance strengthened with age
- Investments: model/compliance costs offset by lower losses
- Outcome: higher risk-adjusted returns in 2024
POS and large-ticket financing: 55M active accounts, ~16% U.S. e-commerce, stronger 2024 returns
Stars: POS and large‑ticket financing are high‑growth, cash‑consuming engines where Synchrony leverages 55M active accounts and scale to capture checkout moments; U.S. e‑commerce ~16% of retail in 2024 supports volume growth, promotional spend fuels acquisition, and 2024 vintage performance showed lower net losses and higher risk‑adjusted returns.
| Metric | Value |
|---|---|
| Active accounts | 55M |
| Receivables (2023) | $74B |
| U.S. e‑commerce (2024) | ~16% |
| Partner transactions | millions/year |
What is included in the product
Detailed Word Document
Concise BCG analysis of Synchrony's portfolio: Stars, Cash Cows, Question Marks and Dogs with investment, hold, divest guidance.
Customizable Excel Spreadsheet
Synchrony BCG one-page matrix maps units to quadrants—clears portfolio ambiguity and speeds decisions.
Cash Cows
Mature private‑label credit card portfolio
Mature private‑label credit card portfolio is a high market‑share cash cow for Synchrony, holding roughly 30% of the US private‑label card market (Nilson Report, 2024). Category growth has slowed, but steady swipe and revolve rates produce predictable interest and fee income. Low incremental marketing and lean operations keep losses in band so the portfolio reliably generates cash. Proceeds fund investments into next‑stage growth initiatives.
General purpose co‑brand cards
General purpose co‑brand cards are a cash cow for Synchrony, delivering stable NIM and interchange with low‑single‑digit growth (≈3% in 2024) and predictable fee/interest flows. Competition is heavy but retention and fine‑tuned rewards keep attrition low, requiring limited marketing spend. Earnings are dependable—a quiet profit engine funding investment elsewhere.
Merchant discount and program fees
Merchant discount and program fees capitalize on partners paying 1–3% per transaction for higher conversion and larger baskets, driving steady take-rates on volume growth. The installed base produces recurring economics with minimal lift, turning existing card portfolios into predictable cash flow. Incremental investments focus on analytics and partner health checks to boost activation and basket size. Cash in, little cash out.
Deposits as low‑cost funding
Deposits fund receivables at attractive spreads in normal cycles, acting as a reliable, scalable utility that is usually cheaper than wholesale; Synchrony held over 70 billion in retail deposits by mid‑2024, keeping funding costs low and stable. Product tweaks and digital onboarding have lifted balances without materially raising funding expense, making deposits a straightforward cash‑flow enabler.
- Low‑cost funding
- Scalable utility
- Digital growth, low incremental cost
- Cash‑flow enabler
Servicing and collections infrastructure
Synchrony’s fixed servicing and collections platforms drive margin uplift as account volumes stabilize, with process automation increasing throughput without heavy capex and reducing per-account handling time. Unit costs decline as portfolios age and standardize, and savings flow directly to net income, enhancing ROA and operational leverage.
- Fixed platforms: scale lowers incremental margin pressure
- Process improvements: higher throughput, low capex
- Unit cost decline: aging portfolios standardize operations
- Impact: savings drop to bottom line
Retail-card cash cows: ≈30% private‑label, $70B deposits fuel low-cost growth
Synchrony’s cash cows—mature private‑label (≈30% US share, Nilson 2024), stable co‑brand cards (≈3% growth 2024), merchant take‑rates (1–3%) and retail deposits (≈$70B mid‑2024)—generate predictable interest, fees and low incremental costs, funding growth with high operational leverage.
| Metric | 2024 |
|---|---|
| Private‑label share | ≈30% |
| Co‑brand growth | ≈3% |
| Merchant take‑rate | 1–3% |
| Retail deposits | $70B |
What You’re Viewing Is Included
Synchrony BCG Matrix
The file you’re previewing here is the exact BCG Matrix report you’ll receive after purchase. No watermarks, no placeholders—just a fully formatted, analysis-ready document crafted for strategic clarity. After buying, the same file is yours to download, edit, print, or present immediately. It’s the final version, built to plug straight into your planning or client work with zero surprises.











