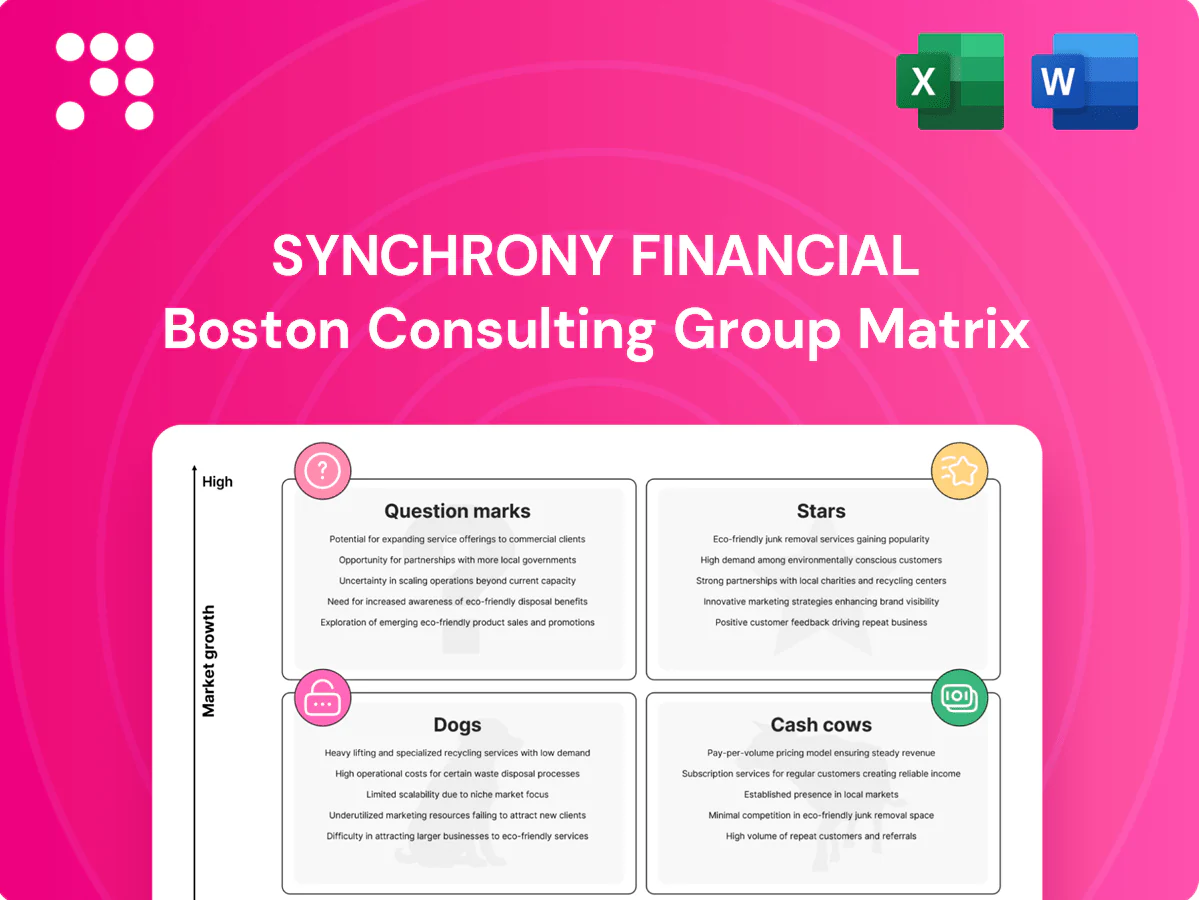
Synchrony Financial Boston Consulting Group Matrix

Download Your Competitive Advantage
Want a no-nonsense read on Synchrony Financial’s product portfolio—what’s a Star, Cash Cow, Dog or Question Mark? This snapshot teases the quadrant logic; the full BCG Matrix gives you quadrant-by-quadrant placements, data-backed recommendations, and ready-to-use Word and Excel files. Skip the guesswork—purchase the complete report to prioritize capital, cut churn, and act with confidence.
Stars

Private‑label cards with marquee retailers
Private‑label cards benefit from high growth tailwinds as U.S. ecommerce reached about 20% of retail sales in 2024 (eMarketer), and omnichannel integration boosts point‑of‑sale share.
Synchrony is often the default issuer powering checkout across over 1,000 retail partners, keeping volumes sticky and driving repeat balances.
Ongoing promo financing, co‑marketing and tech upgrades are required; invest to defend share and convert category growth into larger customer lifetime value.
CareCredit healthcare financing
CareCredit, Synchrony Financials healthcare lending brand, sits in Stars as U.S. healthcare spending runs near 18% of GDP and elective/outpatient demand keeps growing. Accepted at over 200,000 provider locations, expanding networks lift originations and repeat use. Continued provider enablement and scaled consumer education are required to turn steady growth into a significant cash engine.

Co‑branded cards with leading brands
Co-branded cards paired with strong retail ecosystems drive outsized spend and loyalty, with Synchrony serving about 50 million active accounts that capture high-frequency purchase behavior and repeat engagement.
Share is strongest where Synchrony is embedded in checkout and rewards, often delivering double the activation and higher spend per account versus non-integrated offers.
Growth requires marketing dollars, richer offers, and tight data loops; maintain investment while the partner category is hot to cement leadership and maximize lifetime value.

Digital point‑of‑sale financing platform
Digital point‑of‑sale financing platform is a Star for Synchrony in 2024: merchants demand instant approvals and seamless integration, and Synchrony’s POS rails deliver low‑latency underwriting and tokenized checkout to meet that need. Volume ramps as more partners plug in and funnel traffic, requiring heavy tech investment and stringent uptime SLAs to protect authorization flow. Scale now to lock in network effects before rivals crowd the lane.
- Merchants: instant approvals, seamless SDK/API
- Volume: partner-driven funnel growth in 2024
- Costs: heavy tech spend, high uptime standards
- Strategy: scale fast to secure network effects
Risk & underwriting analytics engine
Risk & underwriting analytics engine
Data-driven approvals at Synchrony lift conversion while managing losses, creating a measurable moat as originations scale: Synchrony reported robust credit-originations growth in 2024 that improved model performance and tightened loss trends. As originations expand, feedback loops and richer data widen the predictive gap vs. competitors. Sustaining this requires ongoing data, talent, and compute investment; keep fueling it—this engine converts growth into profitable growth.- Tag: conversion uplift — data-led approvals increase acceptance rates and revenue
- Tag: loss control — models preserve margin while growing book
- Tag: flywheel — more originations => better models => wider moat
- Tag: investments — continuous spend on data, talent, compute required
Private‑label, CareCredit, co‑brand & POS: 2024 tailwinds — invest to convert growth into profit
Synchrony’s Stars—private‑label, CareCredit, co‑brand and POS financing—benefit from strong 2024 tailwinds (U.S. ecommerce ~20% of retail sales) and sticky volumes across 1,000+ retail partners; 50M active accounts and CareCredit acceptance at ~200,000 providers fuel originations. Continued tech, marketing and analytics investment is required to convert growth into durable, profitable scale.
| Segment | 2024 metric | Implication |
|---|---|---|
| Private‑label | U.S. ecommerce ~20% of retail sales | High POS spend, sticky balances |
| CareCredit | ~200,000 provider locations | Rising originations |
| Co‑brand | 50M active accounts | High-frequency spend |
| POS financing | 1,000+ partners | Scale via integrations |
What is included in the product
 Detailed Word Document
BCG Matrix for Synchrony Financial: maps Stars, Cash Cows, Question Marks, Dogs with clear invest, hold or divest guidance and trend context.

 Customizable Excel Spreadsheet
One-page BCG Matrix for Synchrony Financial highlighting unit roles, easing portfolio decisions and executive alignment.
Cash Cows

Mature retail card portfolios
Mature retail card portfolios generate steady cash from large installed bases with predictable revolve behavior; as of 2024 Synchrony’s consumer credit portfolio was roughly $68 billion in loans receivable with about 60 million active accounts, producing consistent fee and interest income. Category growth is modest but market share is entrenched via deep retailer partnerships, requiring low incremental marketing spend. Milk efficiently while sustaining service quality and renewals to preserve lifetime value.
Interest & fee income on revolving balances
Interest and fee income on revolving balances generates stable yield on a scaled book, producing steady free cash flow — driven by managed receivables of about $82 billion (2023) and durable card yields. Growth is low, but utilization and pricing have held up, keeping returns resilient. Limited promotion spend is required, allowing proceeds to fund Stars and cushion credit cycles.

Deposit funding via Synchrony Bank
Sticky savings and CD balances at Synchrony—exceeding $80 billion in deposits in 2024—provide reliable, relatively low‑cost funding that supports high-yield lending. The retail deposit market is mature with consistent inflows and stable retention, allowing modest marketing spend to keep acquisition costs low. Optimizing the savings/CD mix and maturities can boost net interest margin and expand lending capacity.

Long‑standing merchant renewals
Long‑standing merchant renewals lock in card volume with minimal incremental cost, preserving interchange and loan yields across established portfolios; Synchrony served about 48 million active customers in 2024, so renewals protect a large, revenue‑dense base.
Market expansion is constrained by partner overlap and category saturation, but renewals sustain attractive unit economics—higher ROA and lower CAC versus new acquisition in 2024 funding conditions.
Prioritize relationship management over splashy spend: preserve negotiated terms, tighten SLAs, and convert predictable cash flow into retained earnings and liquidity.
- lock volume, low incremental cost
- 2024: ~48M active customers
- focus on SLAs and terms
- bank predictable cash
Collections & servicing scale
Collections and servicing at Synchrony operate as a cash cow: established operations lower cost per account through scale and automation while the mature private-label credit market yields little growth but high contribution to EBITDA.
Continuous process tuning and analytics-led recoveries incrementally increase cash flow and margin extraction without requiring significant new capital.
- scale-driven cost efficiency
- mature market, low growth
- high EBITDA contribution
- ongoing process optimization
Mature card portfolio: steady cash — $68B loans, > $80B deposits
Mature retail card portfolios generate steady cash: 2024 loans receivable ~$68B across ~60M active accounts and ~48M active customers, producing predictable fee/interest income and allowing low incremental marketing. Deposits >$80B in 2024 supply low‑cost funding, supporting margins and free cash flow. Scale and automation keep cost per account low, driving high EBITDA contribution.
| Metric | 2024 |
|---|---|
| Loans receivable | $68B |
| Active accounts | ~60M |
| Active customers | ~48M |
| Deposits | >$80B |
Preview = Final Product
Synchrony Financial BCG Matrix
The Synchrony Financial BCG Matrix you’re previewing here is the exact file you’ll receive after purchase. No watermarks, no placeholders—just the fully formatted, analysis-ready report. It’s designed for immediate editing, printing, or presenting to stakeholders. Buy once, download instantly, and plug it straight into your strategic planning.

Download Your Competitive Advantage
Want a no-nonsense read on Synchrony Financial’s product portfolio—what’s a Star, Cash Cow, Dog or Question Mark? This snapshot teases the quadrant logic; the full BCG Matrix gives you quadrant-by-quadrant placements, data-backed recommendations, and ready-to-use Word and Excel files. Skip the guesswork—purchase the complete report to prioritize capital, cut churn, and act with confidence.
Stars
Private‑label cards with marquee retailers
Private‑label cards benefit from high growth tailwinds as U.S. ecommerce reached about 20% of retail sales in 2024 (eMarketer), and omnichannel integration boosts point‑of‑sale share.
Synchrony is often the default issuer powering checkout across over 1,000 retail partners, keeping volumes sticky and driving repeat balances.
Ongoing promo financing, co‑marketing and tech upgrades are required; invest to defend share and convert category growth into larger customer lifetime value.
CareCredit healthcare financing
CareCredit, Synchrony Financials healthcare lending brand, sits in Stars as U.S. healthcare spending runs near 18% of GDP and elective/outpatient demand keeps growing. Accepted at over 200,000 provider locations, expanding networks lift originations and repeat use. Continued provider enablement and scaled consumer education are required to turn steady growth into a significant cash engine.
Co‑branded cards with leading brands
Co-branded cards paired with strong retail ecosystems drive outsized spend and loyalty, with Synchrony serving about 50 million active accounts that capture high-frequency purchase behavior and repeat engagement.
Share is strongest where Synchrony is embedded in checkout and rewards, often delivering double the activation and higher spend per account versus non-integrated offers.
Growth requires marketing dollars, richer offers, and tight data loops; maintain investment while the partner category is hot to cement leadership and maximize lifetime value.
Digital point‑of‑sale financing platform
Digital point‑of‑sale financing platform is a Star for Synchrony in 2024: merchants demand instant approvals and seamless integration, and Synchrony’s POS rails deliver low‑latency underwriting and tokenized checkout to meet that need. Volume ramps as more partners plug in and funnel traffic, requiring heavy tech investment and stringent uptime SLAs to protect authorization flow. Scale now to lock in network effects before rivals crowd the lane.
- Merchants: instant approvals, seamless SDK/API
- Volume: partner-driven funnel growth in 2024
- Costs: heavy tech spend, high uptime standards
- Strategy: scale fast to secure network effects
Risk & underwriting analytics engine
Risk & underwriting analytics engine
Data-driven approvals at Synchrony lift conversion while managing losses, creating a measurable moat as originations scale: Synchrony reported robust credit-originations growth in 2024 that improved model performance and tightened loss trends. As originations expand, feedback loops and richer data widen the predictive gap vs. competitors. Sustaining this requires ongoing data, talent, and compute investment; keep fueling it—this engine converts growth into profitable growth.- Tag: conversion uplift — data-led approvals increase acceptance rates and revenue
- Tag: loss control — models preserve margin while growing book
- Tag: flywheel — more originations => better models => wider moat
- Tag: investments — continuous spend on data, talent, compute required
Private‑label, CareCredit, co‑brand & POS: 2024 tailwinds — invest to convert growth into profit
Synchrony’s Stars—private‑label, CareCredit, co‑brand and POS financing—benefit from strong 2024 tailwinds (U.S. ecommerce ~20% of retail sales) and sticky volumes across 1,000+ retail partners; 50M active accounts and CareCredit acceptance at ~200,000 providers fuel originations. Continued tech, marketing and analytics investment is required to convert growth into durable, profitable scale.
| Segment | 2024 metric | Implication |
|---|---|---|
| Private‑label | U.S. ecommerce ~20% of retail sales | High POS spend, sticky balances |
| CareCredit | ~200,000 provider locations | Rising originations |
| Co‑brand | 50M active accounts | High-frequency spend |
| POS financing | 1,000+ partners | Scale via integrations |
What is included in the product
Detailed Word Document
BCG Matrix for Synchrony Financial: maps Stars, Cash Cows, Question Marks, Dogs with clear invest, hold or divest guidance and trend context.
Customizable Excel Spreadsheet
One-page BCG Matrix for Synchrony Financial highlighting unit roles, easing portfolio decisions and executive alignment.
Cash Cows
Mature retail card portfolios
Mature retail card portfolios generate steady cash from large installed bases with predictable revolve behavior; as of 2024 Synchrony’s consumer credit portfolio was roughly $68 billion in loans receivable with about 60 million active accounts, producing consistent fee and interest income. Category growth is modest but market share is entrenched via deep retailer partnerships, requiring low incremental marketing spend. Milk efficiently while sustaining service quality and renewals to preserve lifetime value.
Interest & fee income on revolving balances
Interest and fee income on revolving balances generates stable yield on a scaled book, producing steady free cash flow — driven by managed receivables of about $82 billion (2023) and durable card yields. Growth is low, but utilization and pricing have held up, keeping returns resilient. Limited promotion spend is required, allowing proceeds to fund Stars and cushion credit cycles.
Deposit funding via Synchrony Bank
Sticky savings and CD balances at Synchrony—exceeding $80 billion in deposits in 2024—provide reliable, relatively low‑cost funding that supports high-yield lending. The retail deposit market is mature with consistent inflows and stable retention, allowing modest marketing spend to keep acquisition costs low. Optimizing the savings/CD mix and maturities can boost net interest margin and expand lending capacity.
Long‑standing merchant renewals
Long‑standing merchant renewals lock in card volume with minimal incremental cost, preserving interchange and loan yields across established portfolios; Synchrony served about 48 million active customers in 2024, so renewals protect a large, revenue‑dense base.
Market expansion is constrained by partner overlap and category saturation, but renewals sustain attractive unit economics—higher ROA and lower CAC versus new acquisition in 2024 funding conditions.
Prioritize relationship management over splashy spend: preserve negotiated terms, tighten SLAs, and convert predictable cash flow into retained earnings and liquidity.
- lock volume, low incremental cost
- 2024: ~48M active customers
- focus on SLAs and terms
- bank predictable cash
Collections & servicing scale
Collections and servicing at Synchrony operate as a cash cow: established operations lower cost per account through scale and automation while the mature private-label credit market yields little growth but high contribution to EBITDA.
Continuous process tuning and analytics-led recoveries incrementally increase cash flow and margin extraction without requiring significant new capital.
- scale-driven cost efficiency
- mature market, low growth
- high EBITDA contribution
- ongoing process optimization
Mature card portfolio: steady cash — $68B loans, > $80B deposits
Mature retail card portfolios generate steady cash: 2024 loans receivable ~$68B across ~60M active accounts and ~48M active customers, producing predictable fee/interest income and allowing low incremental marketing. Deposits >$80B in 2024 supply low‑cost funding, supporting margins and free cash flow. Scale and automation keep cost per account low, driving high EBITDA contribution.
| Metric | 2024 |
|---|---|
| Loans receivable | $68B |
| Active accounts | ~60M |
| Active customers | ~48M |
| Deposits | >$80B |
Preview = Final Product
Synchrony Financial BCG Matrix
The Synchrony Financial BCG Matrix you’re previewing here is the exact file you’ll receive after purchase. No watermarks, no placeholders—just the fully formatted, analysis-ready report. It’s designed for immediate editing, printing, or presenting to stakeholders. Buy once, download instantly, and plug it straight into your strategic planning.
Original: $10.00
-65%$10.00
$3.50Description
Download Your Competitive Advantage
Want a no-nonsense read on Synchrony Financial’s product portfolio—what’s a Star, Cash Cow, Dog or Question Mark? This snapshot teases the quadrant logic; the full BCG Matrix gives you quadrant-by-quadrant placements, data-backed recommendations, and ready-to-use Word and Excel files. Skip the guesswork—purchase the complete report to prioritize capital, cut churn, and act with confidence.
Stars
Private‑label cards with marquee retailers
Private‑label cards benefit from high growth tailwinds as U.S. ecommerce reached about 20% of retail sales in 2024 (eMarketer), and omnichannel integration boosts point‑of‑sale share.
Synchrony is often the default issuer powering checkout across over 1,000 retail partners, keeping volumes sticky and driving repeat balances.
Ongoing promo financing, co‑marketing and tech upgrades are required; invest to defend share and convert category growth into larger customer lifetime value.
CareCredit healthcare financing
CareCredit, Synchrony Financials healthcare lending brand, sits in Stars as U.S. healthcare spending runs near 18% of GDP and elective/outpatient demand keeps growing. Accepted at over 200,000 provider locations, expanding networks lift originations and repeat use. Continued provider enablement and scaled consumer education are required to turn steady growth into a significant cash engine.
Co‑branded cards with leading brands
Co-branded cards paired with strong retail ecosystems drive outsized spend and loyalty, with Synchrony serving about 50 million active accounts that capture high-frequency purchase behavior and repeat engagement.
Share is strongest where Synchrony is embedded in checkout and rewards, often delivering double the activation and higher spend per account versus non-integrated offers.
Growth requires marketing dollars, richer offers, and tight data loops; maintain investment while the partner category is hot to cement leadership and maximize lifetime value.
Digital point‑of‑sale financing platform
Digital point‑of‑sale financing platform is a Star for Synchrony in 2024: merchants demand instant approvals and seamless integration, and Synchrony’s POS rails deliver low‑latency underwriting and tokenized checkout to meet that need. Volume ramps as more partners plug in and funnel traffic, requiring heavy tech investment and stringent uptime SLAs to protect authorization flow. Scale now to lock in network effects before rivals crowd the lane.
- Merchants: instant approvals, seamless SDK/API
- Volume: partner-driven funnel growth in 2024
- Costs: heavy tech spend, high uptime standards
- Strategy: scale fast to secure network effects
Risk & underwriting analytics engine
Risk & underwriting analytics engine
Data-driven approvals at Synchrony lift conversion while managing losses, creating a measurable moat as originations scale: Synchrony reported robust credit-originations growth in 2024 that improved model performance and tightened loss trends. As originations expand, feedback loops and richer data widen the predictive gap vs. competitors. Sustaining this requires ongoing data, talent, and compute investment; keep fueling it—this engine converts growth into profitable growth.- Tag: conversion uplift — data-led approvals increase acceptance rates and revenue
- Tag: loss control — models preserve margin while growing book
- Tag: flywheel — more originations => better models => wider moat
- Tag: investments — continuous spend on data, talent, compute required
Private‑label, CareCredit, co‑brand & POS: 2024 tailwinds — invest to convert growth into profit
Synchrony’s Stars—private‑label, CareCredit, co‑brand and POS financing—benefit from strong 2024 tailwinds (U.S. ecommerce ~20% of retail sales) and sticky volumes across 1,000+ retail partners; 50M active accounts and CareCredit acceptance at ~200,000 providers fuel originations. Continued tech, marketing and analytics investment is required to convert growth into durable, profitable scale.
| Segment | 2024 metric | Implication |
|---|---|---|
| Private‑label | U.S. ecommerce ~20% of retail sales | High POS spend, sticky balances |
| CareCredit | ~200,000 provider locations | Rising originations |
| Co‑brand | 50M active accounts | High-frequency spend |
| POS financing | 1,000+ partners | Scale via integrations |
What is included in the product
Detailed Word Document
BCG Matrix for Synchrony Financial: maps Stars, Cash Cows, Question Marks, Dogs with clear invest, hold or divest guidance and trend context.
Customizable Excel Spreadsheet
One-page BCG Matrix for Synchrony Financial highlighting unit roles, easing portfolio decisions and executive alignment.
Cash Cows
Mature retail card portfolios
Mature retail card portfolios generate steady cash from large installed bases with predictable revolve behavior; as of 2024 Synchrony’s consumer credit portfolio was roughly $68 billion in loans receivable with about 60 million active accounts, producing consistent fee and interest income. Category growth is modest but market share is entrenched via deep retailer partnerships, requiring low incremental marketing spend. Milk efficiently while sustaining service quality and renewals to preserve lifetime value.
Interest & fee income on revolving balances
Interest and fee income on revolving balances generates stable yield on a scaled book, producing steady free cash flow — driven by managed receivables of about $82 billion (2023) and durable card yields. Growth is low, but utilization and pricing have held up, keeping returns resilient. Limited promotion spend is required, allowing proceeds to fund Stars and cushion credit cycles.
Deposit funding via Synchrony Bank
Sticky savings and CD balances at Synchrony—exceeding $80 billion in deposits in 2024—provide reliable, relatively low‑cost funding that supports high-yield lending. The retail deposit market is mature with consistent inflows and stable retention, allowing modest marketing spend to keep acquisition costs low. Optimizing the savings/CD mix and maturities can boost net interest margin and expand lending capacity.
Long‑standing merchant renewals
Long‑standing merchant renewals lock in card volume with minimal incremental cost, preserving interchange and loan yields across established portfolios; Synchrony served about 48 million active customers in 2024, so renewals protect a large, revenue‑dense base.
Market expansion is constrained by partner overlap and category saturation, but renewals sustain attractive unit economics—higher ROA and lower CAC versus new acquisition in 2024 funding conditions.
Prioritize relationship management over splashy spend: preserve negotiated terms, tighten SLAs, and convert predictable cash flow into retained earnings and liquidity.
- lock volume, low incremental cost
- 2024: ~48M active customers
- focus on SLAs and terms
- bank predictable cash
Collections & servicing scale
Collections and servicing at Synchrony operate as a cash cow: established operations lower cost per account through scale and automation while the mature private-label credit market yields little growth but high contribution to EBITDA.
Continuous process tuning and analytics-led recoveries incrementally increase cash flow and margin extraction without requiring significant new capital.
- scale-driven cost efficiency
- mature market, low growth
- high EBITDA contribution
- ongoing process optimization
Mature card portfolio: steady cash — $68B loans, > $80B deposits
Mature retail card portfolios generate steady cash: 2024 loans receivable ~$68B across ~60M active accounts and ~48M active customers, producing predictable fee/interest income and allowing low incremental marketing. Deposits >$80B in 2024 supply low‑cost funding, supporting margins and free cash flow. Scale and automation keep cost per account low, driving high EBITDA contribution.
| Metric | 2024 |
|---|---|
| Loans receivable | $68B |
| Active accounts | ~60M |
| Active customers | ~48M |
| Deposits | >$80B |
Preview = Final Product
Synchrony Financial BCG Matrix
The Synchrony Financial BCG Matrix you’re previewing here is the exact file you’ll receive after purchase. No watermarks, no placeholders—just the fully formatted, analysis-ready report. It’s designed for immediate editing, printing, or presenting to stakeholders. Buy once, download instantly, and plug it straight into your strategic planning.











