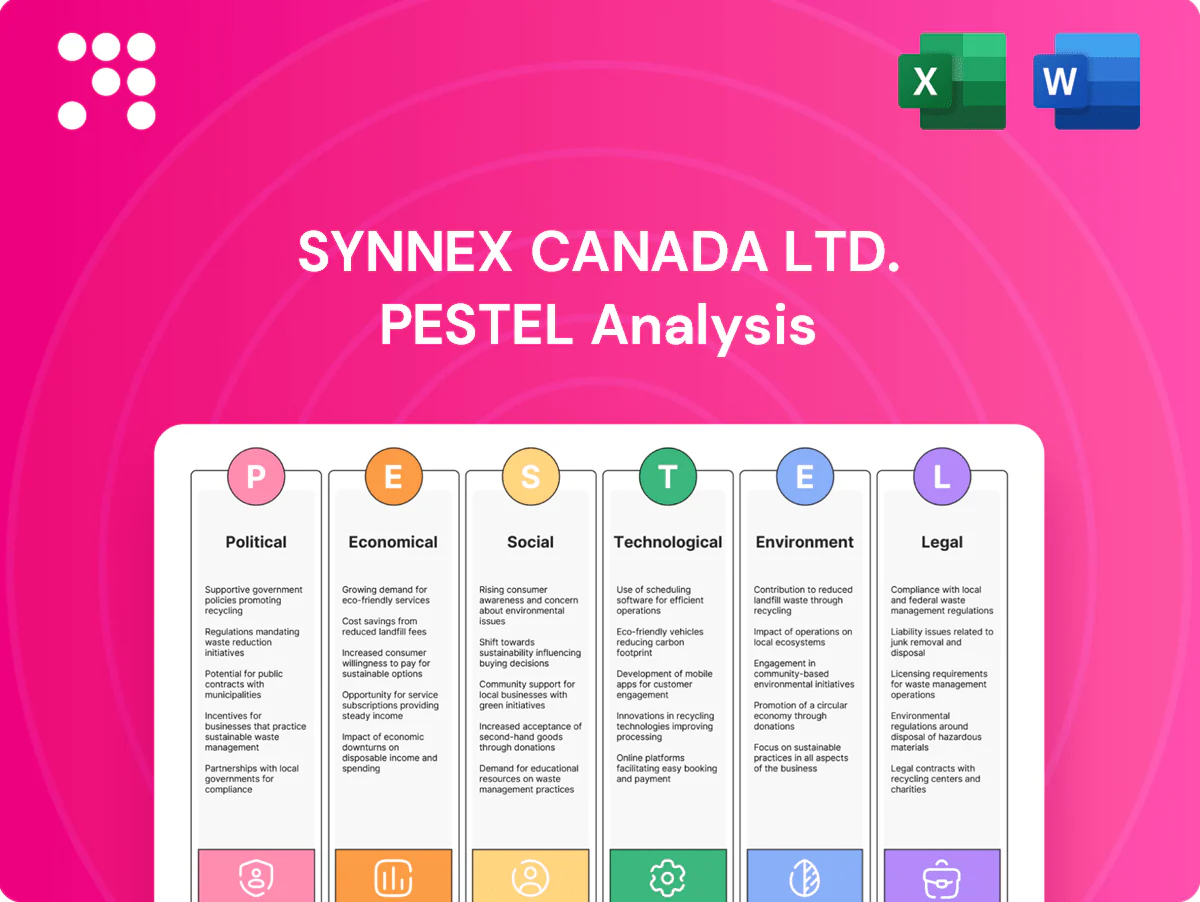
Synnex Canada Ltd. PESTLE Analysis

Your Competitive Advantage Starts with This Report
Our PESTLE analysis for Synnex Canada Ltd. reveals how regulatory shifts, economic cycles, and rapid tech change are reshaping its supply‑chain and growth prospects. Actionable insights highlight risks and untapped opportunities for investors and strategists. Purchase the full report to get the complete, ready‑to‑use breakdown and strengthen your decision-making.
Political factors

Federal–provincial policy alignment
Canada’s multi-level governance across 10 provinces and 3 territories shapes distribution, procurement and incentives, with provinces controlling health, education and many digital rules. Synnex must adapt to differing provincial tax regimes and labor rules—combined federal plus provincial corporate tax rates range about 26.5–31% (2024). Coordinated compliance and localized go-to-market strategies reduce friction, help win public-sector deals, and ongoing monitoring prevents policy-driven margin erosion.
Trade policy and USMCA exposure
Sourcing and cross-border flows for Synnex Canada hinge on USMCA stability (in force since July 1, 2020) and customs efficiency; the agreement preserves zero tariffs for qualifying goods but adds sector rules such as a 75% regional content requirement for autos. Tariffs, rules-of-origin disputes and border delays can raise landed costs and jeopardize delivery SLAs. Proactive tariff classification, use of bonded facilities and diversified routing mitigate shocks, while vendor negotiation can shift or share tariff risk.

Government tech procurement
Federal and provincial multi-billion-dollar digital modernization programs are driving channel demand for Synnex Canada, with government IT procurements often subject to certifications, security clearances and Canadian content rules that determine eligibility.
Strategic partnerships with local resellers improve bid competitiveness, while long procurement cycles of roughly 6–24 months require disciplined pipeline planning and working-capital management.

Cybersecurity and national resilience
Canada’s 2023 National Cyber Security Strategy (CA$1.6B over 5 years) raises critical‑infrastructure supply‑chain expectations, pushing procurement to demand attestations on cybersecurity controls and incident response; aligning Synnex Canada with CSE/GC guidance improves bid credibility. Gartner forecasts ~60% enterprise zero‑trust adoption by 2025, so zero‑trust‑aligned offerings can differentiate Synnex.
Industrial and innovation incentives
Industrial and innovation incentives in Canada—notably the 30% refundable Clean Technology Investment Tax Credit and SR&ED credits—push Synnex Canada to tilt vendor roadmaps toward AI, clean tech and advanced manufacturing, unlocking addressable demand and higher-margin SKUs. Steering portfolios into incentivized categories can materially increase uptake; eligible capital expenses qualify for up to 30% tax relief, while joint OEM/ISV applications expand grant access. Rigorous project-level reporting and ERP tagging are required to capture and audit incentives.
- Incentive types: tax credits (SR&ED, 30% clean tech)
- Impact: shifts vendor/channel mix toward AI/clean tech
- Execution: joint OEM/ISV applications boost grant success
- Governance: project reporting and cost-tracking required
Manage Canada tax, USMCA origin risk and stricter cyber procurement requirements
Multi-level Canadian governance (federal + 10 provinces) forces Synnex Canada to manage varying tax/labor regimes—federal+provincial corporate tax ~26.5–31% (2024)—and provincial procurement rules. USMCA (since 1 Jul 2020) keeps zero tariffs for qualifying goods but adds rules‑of‑origin risks affecting landed cost and SLAs. Federal CA$1.6B cyber strategy (2023) and ~60% zero‑trust adoption by 2025 raise procurement security requirements.
| Item | Key metric |
|---|---|
| Corp tax (2024) | 26.5–31% |
| USMCA | In force Jul 1, 2020 |
| Cyber funding | CA$1.6B (2023) |
| Zero trust | ~60% by 2025 |
What is included in the product
 Detailed Word Document
Provides a targeted PESTLE review of Synnex Canada Ltd., assessing Political, Economic, Social, Technological, Environmental and Legal forces with data-backed trends and sector-specific examples to pinpoint strategic risks and opportunities for executives, investors and planners.

 Customizable Excel Spreadsheet
A clean, summarized PESTLE of Synnex Canada Ltd.—visually segmented by category and written in plain language—provides an easily shareable reference to align teams, support risk discussions, and drop into presentations.
Economic factors

FX and CAD–USD volatility
Most OEM pricing remains USD‑linked while Synnex Canada reports revenues in CAD, exposing margins to FX; USD/CAD stood near 1.36 in July 2025 with a 12‑month trading range roughly 1.28–1.45. Currency swings directly alter rebate economics and partner pricing, compressing gross margins when CAD weakens. Active hedging, USD currency clauses and dynamic price lists are used to reduce exposure. Accurate forecasts are critical for inventory buy decisions to avoid FX losses.
Interest rates and working capital
Bank of Canada policy rate at 5.00% raises carrying costs on receivables and inventory, increasing financing expense for Synnex Canada and resellers. Higher rates tighten reseller credit and have historically lengthened DSO by 5–10 days in tech distribution cycles. Credit optimization and higher inventory turns are key margin levers. Vendor financing and floorplan programs (common in IT distribution) help sustain sell-through.

IT spending cycles
Enterprise refreshes on a 3–5 year cycle, cloud migration and rising public-sector IT budgets drive cadence for Synnex Canada, with cloud-first initiatives accelerating through 2025. Downturns shift mix toward mid-tier SKUs and services while upcycles pull premium and AI infrastructure demand. Diversification across verticals stabilizes revenue and data-driven demand planning cuts obsolescence and inventory write-downs.

Supply chain and freight costs
- Lead-time pressure: longer transits
- Fuel impact: ~85 USD/bbl H1 2025
- Mitigation: multi-node + nearshoring
- Protection: OEM priority allocation
- Trust: transparent ETA communication
Channel consolidation
Channel consolidation sees M&A among resellers and MSPs concentrating buying power—global IT distribution M&A deal value rose 27% in 2023, amplifying supplier leverage and compressing margins for smaller partners. Synnex Canada defends share via strategic agreements, marketplaces and co-marketing; value-added integration services shift competition from price to solutions. Tiered incentives keep long-tail partners engaged.
- Buying power concentration: +27% deal value 2023
- Strategic agreements and marketplaces defend share
- Value-added services reduce price-only competition
- Tiered incentives retain long-tail partners
Manage Canada tax, USMCA origin risk and stricter cyber procurement requirements
USD‑linked OEM pricing vs CAD revenue (USD/CAD ~1.36 Jul 2025) and BoC rate 5.00% squeeze margins and raise financing costs. Brent ~85 USD/bbl H1 2025 and longer lead times lift landed costs mid-single digits. Channel M&A (+27% deal value 2023) concentrates buying power, shifting competition to services and strategic agreements.
| Metric | Value |
|---|---|
| USD/CAD | ~1.36 (Jul 2025) |
| BoC rate | 5.00% |
| Brent | ~85 USD/bbl (H1 2025) |
| M&A deal value | +27% (2023) |
Same Document Delivered
Synnex Canada Ltd. PESTLE Analysis
The preview shown here is the exact document you’ll receive after purchase—fully formatted and ready to use. This Synnex Canada Ltd. PESTLE Analysis delivers concise political, economic, social, technological, legal and environmental insights tailored for strategic decisions. No placeholders or teasers—what you see is the final file. You’ll be able to download it immediately after checkout.

Your Competitive Advantage Starts with This Report
Our PESTLE analysis for Synnex Canada Ltd. reveals how regulatory shifts, economic cycles, and rapid tech change are reshaping its supply‑chain and growth prospects. Actionable insights highlight risks and untapped opportunities for investors and strategists. Purchase the full report to get the complete, ready‑to‑use breakdown and strengthen your decision-making.
Political factors
Federal–provincial policy alignment
Canada’s multi-level governance across 10 provinces and 3 territories shapes distribution, procurement and incentives, with provinces controlling health, education and many digital rules. Synnex must adapt to differing provincial tax regimes and labor rules—combined federal plus provincial corporate tax rates range about 26.5–31% (2024). Coordinated compliance and localized go-to-market strategies reduce friction, help win public-sector deals, and ongoing monitoring prevents policy-driven margin erosion.
Trade policy and USMCA exposure
Sourcing and cross-border flows for Synnex Canada hinge on USMCA stability (in force since July 1, 2020) and customs efficiency; the agreement preserves zero tariffs for qualifying goods but adds sector rules such as a 75% regional content requirement for autos. Tariffs, rules-of-origin disputes and border delays can raise landed costs and jeopardize delivery SLAs. Proactive tariff classification, use of bonded facilities and diversified routing mitigate shocks, while vendor negotiation can shift or share tariff risk.
Government tech procurement
Federal and provincial multi-billion-dollar digital modernization programs are driving channel demand for Synnex Canada, with government IT procurements often subject to certifications, security clearances and Canadian content rules that determine eligibility.
Strategic partnerships with local resellers improve bid competitiveness, while long procurement cycles of roughly 6–24 months require disciplined pipeline planning and working-capital management.
Cybersecurity and national resilience
Canada’s 2023 National Cyber Security Strategy (CA$1.6B over 5 years) raises critical‑infrastructure supply‑chain expectations, pushing procurement to demand attestations on cybersecurity controls and incident response; aligning Synnex Canada with CSE/GC guidance improves bid credibility. Gartner forecasts ~60% enterprise zero‑trust adoption by 2025, so zero‑trust‑aligned offerings can differentiate Synnex.
Industrial and innovation incentives
Industrial and innovation incentives in Canada—notably the 30% refundable Clean Technology Investment Tax Credit and SR&ED credits—push Synnex Canada to tilt vendor roadmaps toward AI, clean tech and advanced manufacturing, unlocking addressable demand and higher-margin SKUs. Steering portfolios into incentivized categories can materially increase uptake; eligible capital expenses qualify for up to 30% tax relief, while joint OEM/ISV applications expand grant access. Rigorous project-level reporting and ERP tagging are required to capture and audit incentives.
- Incentive types: tax credits (SR&ED, 30% clean tech)
- Impact: shifts vendor/channel mix toward AI/clean tech
- Execution: joint OEM/ISV applications boost grant success
- Governance: project reporting and cost-tracking required
Manage Canada tax, USMCA origin risk and stricter cyber procurement requirements
Multi-level Canadian governance (federal + 10 provinces) forces Synnex Canada to manage varying tax/labor regimes—federal+provincial corporate tax ~26.5–31% (2024)—and provincial procurement rules. USMCA (since 1 Jul 2020) keeps zero tariffs for qualifying goods but adds rules‑of‑origin risks affecting landed cost and SLAs. Federal CA$1.6B cyber strategy (2023) and ~60% zero‑trust adoption by 2025 raise procurement security requirements.
| Item | Key metric |
|---|---|
| Corp tax (2024) | 26.5–31% |
| USMCA | In force Jul 1, 2020 |
| Cyber funding | CA$1.6B (2023) |
| Zero trust | ~60% by 2025 |
What is included in the product
Detailed Word Document
Provides a targeted PESTLE review of Synnex Canada Ltd., assessing Political, Economic, Social, Technological, Environmental and Legal forces with data-backed trends and sector-specific examples to pinpoint strategic risks and opportunities for executives, investors and planners.
Customizable Excel Spreadsheet
A clean, summarized PESTLE of Synnex Canada Ltd.—visually segmented by category and written in plain language—provides an easily shareable reference to align teams, support risk discussions, and drop into presentations.
Economic factors
FX and CAD–USD volatility
Most OEM pricing remains USD‑linked while Synnex Canada reports revenues in CAD, exposing margins to FX; USD/CAD stood near 1.36 in July 2025 with a 12‑month trading range roughly 1.28–1.45. Currency swings directly alter rebate economics and partner pricing, compressing gross margins when CAD weakens. Active hedging, USD currency clauses and dynamic price lists are used to reduce exposure. Accurate forecasts are critical for inventory buy decisions to avoid FX losses.
Interest rates and working capital
Bank of Canada policy rate at 5.00% raises carrying costs on receivables and inventory, increasing financing expense for Synnex Canada and resellers. Higher rates tighten reseller credit and have historically lengthened DSO by 5–10 days in tech distribution cycles. Credit optimization and higher inventory turns are key margin levers. Vendor financing and floorplan programs (common in IT distribution) help sustain sell-through.
IT spending cycles
Enterprise refreshes on a 3–5 year cycle, cloud migration and rising public-sector IT budgets drive cadence for Synnex Canada, with cloud-first initiatives accelerating through 2025. Downturns shift mix toward mid-tier SKUs and services while upcycles pull premium and AI infrastructure demand. Diversification across verticals stabilizes revenue and data-driven demand planning cuts obsolescence and inventory write-downs.
Supply chain and freight costs
- Lead-time pressure: longer transits
- Fuel impact: ~85 USD/bbl H1 2025
- Mitigation: multi-node + nearshoring
- Protection: OEM priority allocation
- Trust: transparent ETA communication
Channel consolidation
Channel consolidation sees M&A among resellers and MSPs concentrating buying power—global IT distribution M&A deal value rose 27% in 2023, amplifying supplier leverage and compressing margins for smaller partners. Synnex Canada defends share via strategic agreements, marketplaces and co-marketing; value-added integration services shift competition from price to solutions. Tiered incentives keep long-tail partners engaged.
- Buying power concentration: +27% deal value 2023
- Strategic agreements and marketplaces defend share
- Value-added services reduce price-only competition
- Tiered incentives retain long-tail partners
Manage Canada tax, USMCA origin risk and stricter cyber procurement requirements
USD‑linked OEM pricing vs CAD revenue (USD/CAD ~1.36 Jul 2025) and BoC rate 5.00% squeeze margins and raise financing costs. Brent ~85 USD/bbl H1 2025 and longer lead times lift landed costs mid-single digits. Channel M&A (+27% deal value 2023) concentrates buying power, shifting competition to services and strategic agreements.
| Metric | Value |
|---|---|
| USD/CAD | ~1.36 (Jul 2025) |
| BoC rate | 5.00% |
| Brent | ~85 USD/bbl (H1 2025) |
| M&A deal value | +27% (2023) |
Same Document Delivered
Synnex Canada Ltd. PESTLE Analysis
The preview shown here is the exact document you’ll receive after purchase—fully formatted and ready to use. This Synnex Canada Ltd. PESTLE Analysis delivers concise political, economic, social, technological, legal and environmental insights tailored for strategic decisions. No placeholders or teasers—what you see is the final file. You’ll be able to download it immediately after checkout.
Original: $10.00
-65%$10.00
$3.50Description
Your Competitive Advantage Starts with This Report
Our PESTLE analysis for Synnex Canada Ltd. reveals how regulatory shifts, economic cycles, and rapid tech change are reshaping its supply‑chain and growth prospects. Actionable insights highlight risks and untapped opportunities for investors and strategists. Purchase the full report to get the complete, ready‑to‑use breakdown and strengthen your decision-making.
Political factors
Federal–provincial policy alignment
Canada’s multi-level governance across 10 provinces and 3 territories shapes distribution, procurement and incentives, with provinces controlling health, education and many digital rules. Synnex must adapt to differing provincial tax regimes and labor rules—combined federal plus provincial corporate tax rates range about 26.5–31% (2024). Coordinated compliance and localized go-to-market strategies reduce friction, help win public-sector deals, and ongoing monitoring prevents policy-driven margin erosion.
Trade policy and USMCA exposure
Sourcing and cross-border flows for Synnex Canada hinge on USMCA stability (in force since July 1, 2020) and customs efficiency; the agreement preserves zero tariffs for qualifying goods but adds sector rules such as a 75% regional content requirement for autos. Tariffs, rules-of-origin disputes and border delays can raise landed costs and jeopardize delivery SLAs. Proactive tariff classification, use of bonded facilities and diversified routing mitigate shocks, while vendor negotiation can shift or share tariff risk.
Government tech procurement
Federal and provincial multi-billion-dollar digital modernization programs are driving channel demand for Synnex Canada, with government IT procurements often subject to certifications, security clearances and Canadian content rules that determine eligibility.
Strategic partnerships with local resellers improve bid competitiveness, while long procurement cycles of roughly 6–24 months require disciplined pipeline planning and working-capital management.
Cybersecurity and national resilience
Canada’s 2023 National Cyber Security Strategy (CA$1.6B over 5 years) raises critical‑infrastructure supply‑chain expectations, pushing procurement to demand attestations on cybersecurity controls and incident response; aligning Synnex Canada with CSE/GC guidance improves bid credibility. Gartner forecasts ~60% enterprise zero‑trust adoption by 2025, so zero‑trust‑aligned offerings can differentiate Synnex.
Industrial and innovation incentives
Industrial and innovation incentives in Canada—notably the 30% refundable Clean Technology Investment Tax Credit and SR&ED credits—push Synnex Canada to tilt vendor roadmaps toward AI, clean tech and advanced manufacturing, unlocking addressable demand and higher-margin SKUs. Steering portfolios into incentivized categories can materially increase uptake; eligible capital expenses qualify for up to 30% tax relief, while joint OEM/ISV applications expand grant access. Rigorous project-level reporting and ERP tagging are required to capture and audit incentives.
- Incentive types: tax credits (SR&ED, 30% clean tech)
- Impact: shifts vendor/channel mix toward AI/clean tech
- Execution: joint OEM/ISV applications boost grant success
- Governance: project reporting and cost-tracking required
Manage Canada tax, USMCA origin risk and stricter cyber procurement requirements
Multi-level Canadian governance (federal + 10 provinces) forces Synnex Canada to manage varying tax/labor regimes—federal+provincial corporate tax ~26.5–31% (2024)—and provincial procurement rules. USMCA (since 1 Jul 2020) keeps zero tariffs for qualifying goods but adds rules‑of‑origin risks affecting landed cost and SLAs. Federal CA$1.6B cyber strategy (2023) and ~60% zero‑trust adoption by 2025 raise procurement security requirements.
| Item | Key metric |
|---|---|
| Corp tax (2024) | 26.5–31% |
| USMCA | In force Jul 1, 2020 |
| Cyber funding | CA$1.6B (2023) |
| Zero trust | ~60% by 2025 |
What is included in the product
Detailed Word Document
Provides a targeted PESTLE review of Synnex Canada Ltd., assessing Political, Economic, Social, Technological, Environmental and Legal forces with data-backed trends and sector-specific examples to pinpoint strategic risks and opportunities for executives, investors and planners.
Customizable Excel Spreadsheet
A clean, summarized PESTLE of Synnex Canada Ltd.—visually segmented by category and written in plain language—provides an easily shareable reference to align teams, support risk discussions, and drop into presentations.
Economic factors
FX and CAD–USD volatility
Most OEM pricing remains USD‑linked while Synnex Canada reports revenues in CAD, exposing margins to FX; USD/CAD stood near 1.36 in July 2025 with a 12‑month trading range roughly 1.28–1.45. Currency swings directly alter rebate economics and partner pricing, compressing gross margins when CAD weakens. Active hedging, USD currency clauses and dynamic price lists are used to reduce exposure. Accurate forecasts are critical for inventory buy decisions to avoid FX losses.
Interest rates and working capital
Bank of Canada policy rate at 5.00% raises carrying costs on receivables and inventory, increasing financing expense for Synnex Canada and resellers. Higher rates tighten reseller credit and have historically lengthened DSO by 5–10 days in tech distribution cycles. Credit optimization and higher inventory turns are key margin levers. Vendor financing and floorplan programs (common in IT distribution) help sustain sell-through.
IT spending cycles
Enterprise refreshes on a 3–5 year cycle, cloud migration and rising public-sector IT budgets drive cadence for Synnex Canada, with cloud-first initiatives accelerating through 2025. Downturns shift mix toward mid-tier SKUs and services while upcycles pull premium and AI infrastructure demand. Diversification across verticals stabilizes revenue and data-driven demand planning cuts obsolescence and inventory write-downs.
Supply chain and freight costs
- Lead-time pressure: longer transits
- Fuel impact: ~85 USD/bbl H1 2025
- Mitigation: multi-node + nearshoring
- Protection: OEM priority allocation
- Trust: transparent ETA communication
Channel consolidation
Channel consolidation sees M&A among resellers and MSPs concentrating buying power—global IT distribution M&A deal value rose 27% in 2023, amplifying supplier leverage and compressing margins for smaller partners. Synnex Canada defends share via strategic agreements, marketplaces and co-marketing; value-added integration services shift competition from price to solutions. Tiered incentives keep long-tail partners engaged.
- Buying power concentration: +27% deal value 2023
- Strategic agreements and marketplaces defend share
- Value-added services reduce price-only competition
- Tiered incentives retain long-tail partners
Manage Canada tax, USMCA origin risk and stricter cyber procurement requirements
USD‑linked OEM pricing vs CAD revenue (USD/CAD ~1.36 Jul 2025) and BoC rate 5.00% squeeze margins and raise financing costs. Brent ~85 USD/bbl H1 2025 and longer lead times lift landed costs mid-single digits. Channel M&A (+27% deal value 2023) concentrates buying power, shifting competition to services and strategic agreements.
| Metric | Value |
|---|---|
| USD/CAD | ~1.36 (Jul 2025) |
| BoC rate | 5.00% |
| Brent | ~85 USD/bbl (H1 2025) |
| M&A deal value | +27% (2023) |
Same Document Delivered
Synnex Canada Ltd. PESTLE Analysis
The preview shown here is the exact document you’ll receive after purchase—fully formatted and ready to use. This Synnex Canada Ltd. PESTLE Analysis delivers concise political, economic, social, technological, legal and environmental insights tailored for strategic decisions. No placeholders or teasers—what you see is the final file. You’ll be able to download it immediately after checkout.











