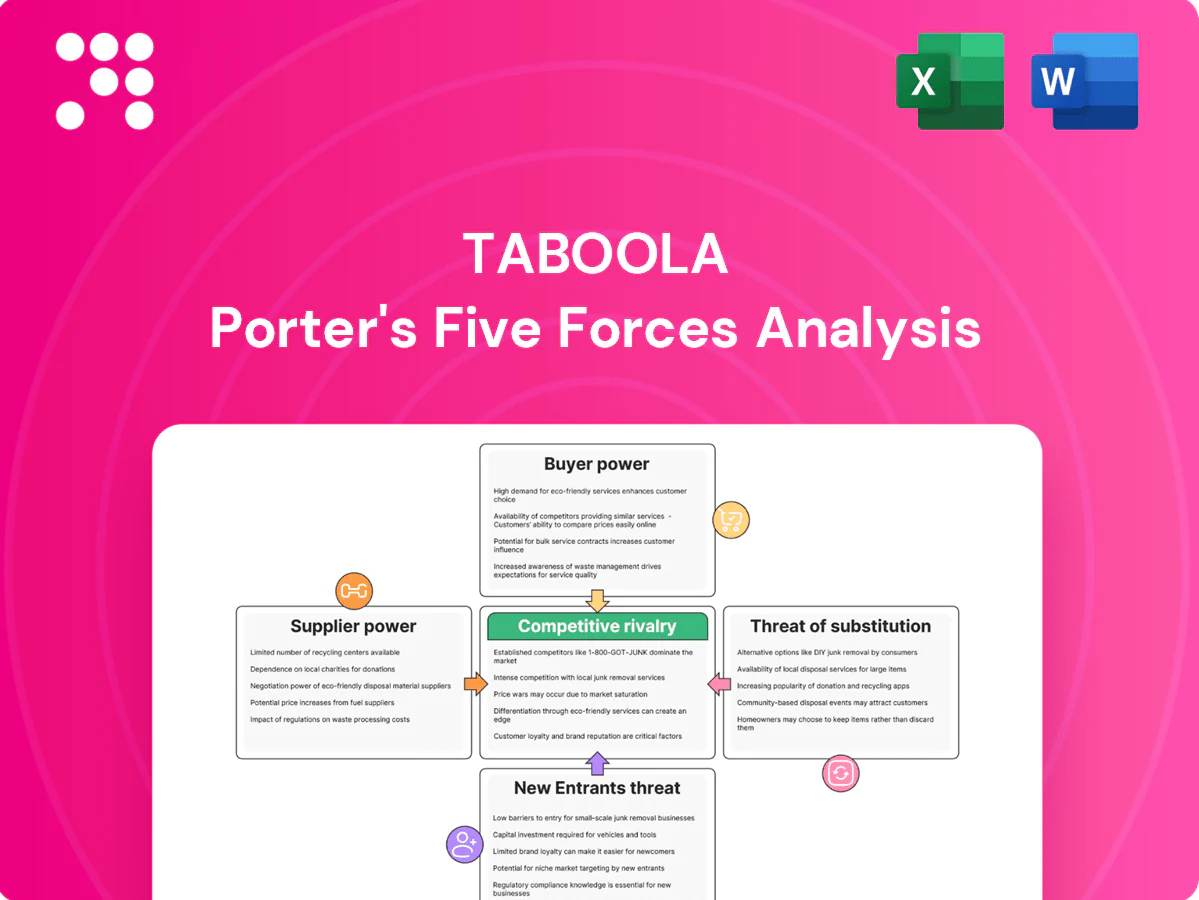
Taboola Porter's Five Forces Analysis

A Must-Have Tool for Decision-Makers
Taboola's Porter's Five Forces snapshot highlights competitive intensity from publishers and ad-tech rivals, moderating buyer power and rising substitute threats. It outlines supplier dynamics and barriers to entry shaping margins and growth. This brief glimpse surfaces key risks and strategic levers. Unlock the full Porter's Five Forces Analysis to get force-by-force ratings, visuals, and actionable recommendations tailored to Taboola.
Suppliers Bargaining Power

Premium publishers as key inventory source
Premium publishers supply the native placements Taboola monetizes, concentrating leverage among top news and lifestyle sites and driving a disproportionate share of engagement; Taboola reported roughly 1.4 billion monthly active users in 2024. Exclusive or semi-exclusive deals can raise pricing floors and rev-share demands, and losing a marquee publisher materially cuts reach, audience quality, and advertiser spend. Taboola counters with multi-year agreements, publisher tools and yield-optimization algorithms to retain supply.
Mobile platforms and browsers gate access
Distribution is tightly gated by iOS/Android (≈70% Android, ≈29% iOS in 2024) and browser engines whose policy or rendering changes can alter tracking and ad delivery. Platform privacy shifts (post-ATT) have driven industry attribution declines of roughly 30–50%, indirectly increasing supplier power. Compliance and contextual targeting reduce exposure to policy shocks. Deep SDK integrations and high SDK performance are critical to retain delivery and revenue continuity.

Data and identity partners influence targeting
Contextual signals, interest graphs and identity solutions like clean rooms materially affect targeting performance and CPMs; Taboola reaches roughly 1.4 billion monthly uniques (2024), so supplier data quality drives advertiser ROI. Vendors can raise fees or tighten usage, squeezing margins and raising CPMS. Taboola’s investments in first-party data and AI models reduce dependence on external suppliers, while multiple identity pathways lower switching costs from any single provider.

Cloud/AI infrastructure dependency
Cloud/AI infrastructure providers (AWS ~32%, Azure ~22%, GCP ~11% market share in 2024) underpin Taboola’s compute, storage and AI tooling for large-scale recommendation serving; pricing shifts or capacity constraints can compress margins and increase latency.
- Multi-cloud + in-house optimization reduce supplier power
- Model-efficiency (quantization/pruning) can cut inference costs ~20–40%
- Edge delivery lowers bandwidth and latency exposure
Measurement, brand safety, and fraud vendors
Verification, viewability, and anti-fraud partners are required by big advertisers; MRC viewability standards mandate 50% of pixels in view for 1 second (display) and 50% for 2 seconds (video), while many buyers target 70%+ measurable viewability. Certification and compatibility requirements create vendor lock-in and added fees, but Taboola’s proprietary safety layers plus support for third-party tags balance trust and costs; maintaining accreditations (TAG/MRC alignment) reduces single-vendor leverage.
- Verification: MRC 50%/1s (display) and 50%/2s (video)
- Advertiser targets: 70%+ viewability
- Vendor lock-in: certification/compatibility fees
- Mitigation: Taboola safety layers + third-party tag support
Publisher concentration fuels supplier leverage; ~1.4B MAUs, attribution down 30-50%
Premium publishers and exclusives concentrate supplier leverage; Taboola reported ~1.4B MAUs (2024) so losing key sites hurts reach and CPMs. Platform/privacy shifts (post-ATT) cut attribution ~30–50%, raising supplier power. Cloud, verification vendors and identity providers (AWS ~32%, Azure ~22%, GCP ~11% 2024) can squeeze margins; Taboola uses multi-cloud, first-party data and SDKs to mitigate.
| Metric | 2024 Value |
|---|---|
| MAUs | ~1.4B |
| Android/iOS | ≈70% / ≈29% |
| Cloud share | AWS 32% Azure 22% GCP 11% |
| Attribution decline | ~30–50% |
What is included in the product
 Detailed Word Document
Comprehensive Porter's Five Forces analysis of Taboola uncovering competitive drivers, buyer and supplier power, substitutes, and market entry risks. Highlights disruptive entrants, monetization pressures, and strategic defenses; fully editable for reports, investor materials, and strategy decks.

 Customizable Excel Spreadsheet
A concise, one-sheet Porter's Five Forces for Taboola that clarifies competitive pressures and strategic risks—perfect for rapid decision-making and slide-ready presentations; customizable inputs let you model scenarios (regulation, new entrants) without complex code.
Customers Bargaining Power

Large advertisers and agencies negotiate hard
Large holding companies such as WPP, Publicis and Omnicom aggregate client spend to demand preferential pricing, data access and reporting, and can reallocate budgets to search/social — Google and Meta together take roughly 60% of global digital ad spend. Agencies commonly require custom performance commitments and strict brand safety. Taboola defends by proving incremental reach (1.4B monthly users) and offering outcome-based buying.
Performance marketers are ROI-driven
Performance marketers are ROI-driven and in 2024 shift spend rapidly based on CAC/LTV, pressuring CPC/CPA rates and demanding fast optimization. They expect granular controls and accelerated creative testing to prevent churn, and rely on predictive bidding plus conversion modeling to hit CPA targets. Retention hinges on demonstrable, real-time performance improvements.

Publishers can multi-home with rivals
Publishers often multi-home with rivals like Outbrain and also act as suppliers for Taboola’s monetization tools, running competing widgets to directly benchmark yields; Taboola reports over 500 billion content recommendations per month, which raises comparability. This ability to A/B price and placement elevates publisher leverage in rev-share negotiations and product roadmap requests. Taboola’s cohort analytics and exclusive demand partnerships aim to justify premium CPMs and reduce churn.

SMBs have low switching costs
SMBs' low switching costs empower them to test small self-serve budgets across channels; in 2024 roughly 60% of SMBs used self-serve ad platforms, compressing pricing power for publishers like Taboola. Ease of onboarding elsewhere and ubiquitous programmatic options limit fee increases, though Taboola's education, templates, and automated optimization cut churn by improving ROI. Vertical playbooks (health, finance, retail) raise perceived value and stickiness for SMB advertisers.
- SMB self-serve adoption ~60% (2024)
- Low switching costs reduce pricing leverage
- Education + automation lower churn
- Vertical playbooks increase retention
Demand for transparent measurement
Buyers demand clear attribution, incrementality testing and strict brand safety; lack of transparency drives budget flight to walled gardens, which captured about 56% of US digital ad spend in 2024 (eMarketer). Providing log-level data and independent verification reduces buyer leverage, while stronger audience and performance insights let publishers justify premium placements and higher CPMs.
- Buyers insist on attribution, incrementality, brand safety
- 56% share: Google+Meta US digital ad spend, 2024 (eMarketer)
- Log-level data + independent verification lowers churn
- Better insights enable premium pricing
Buyers hold power as Google+Meta grab 56% of US digital ad spend (2024)
Buyers wield high bargaining power: large agencies and walled gardens (Google+Meta 56% US digital ad spend, 2024) shift budgets and demand attribution; performance marketers force rapid CPC/CPA moves; publishers multi-home (Taboola 500B recommendations/month) to negotiate rev-share; SMBs (60% self-serve, 2024) increase price sensitivity. Taboola defends with 1.4B monthly users, log-level data, outcome-based buying and vertical playbooks.
| Metric | Value (2024) |
|---|---|
| Monthly users | 1.4B |
| Recommendations/month | 500B |
| Google+Meta US share | 56% |
| SMB self-serve | 60% |
Full Version Awaits
Taboola Porter's Five Forces Analysis
This preview displays the exact Taboola Porter's Five Forces Analysis you'll receive after purchase—no samples, no placeholders. The full document is fully formatted, professionally written, and ready for immediate download and use upon payment. Purchase grants instant access to this same file.

A Must-Have Tool for Decision-Makers
Taboola's Porter's Five Forces snapshot highlights competitive intensity from publishers and ad-tech rivals, moderating buyer power and rising substitute threats. It outlines supplier dynamics and barriers to entry shaping margins and growth. This brief glimpse surfaces key risks and strategic levers. Unlock the full Porter's Five Forces Analysis to get force-by-force ratings, visuals, and actionable recommendations tailored to Taboola.
Suppliers Bargaining Power
Premium publishers as key inventory source
Premium publishers supply the native placements Taboola monetizes, concentrating leverage among top news and lifestyle sites and driving a disproportionate share of engagement; Taboola reported roughly 1.4 billion monthly active users in 2024. Exclusive or semi-exclusive deals can raise pricing floors and rev-share demands, and losing a marquee publisher materially cuts reach, audience quality, and advertiser spend. Taboola counters with multi-year agreements, publisher tools and yield-optimization algorithms to retain supply.
Mobile platforms and browsers gate access
Distribution is tightly gated by iOS/Android (≈70% Android, ≈29% iOS in 2024) and browser engines whose policy or rendering changes can alter tracking and ad delivery. Platform privacy shifts (post-ATT) have driven industry attribution declines of roughly 30–50%, indirectly increasing supplier power. Compliance and contextual targeting reduce exposure to policy shocks. Deep SDK integrations and high SDK performance are critical to retain delivery and revenue continuity.
Data and identity partners influence targeting
Contextual signals, interest graphs and identity solutions like clean rooms materially affect targeting performance and CPMs; Taboola reaches roughly 1.4 billion monthly uniques (2024), so supplier data quality drives advertiser ROI. Vendors can raise fees or tighten usage, squeezing margins and raising CPMS. Taboola’s investments in first-party data and AI models reduce dependence on external suppliers, while multiple identity pathways lower switching costs from any single provider.
Cloud/AI infrastructure dependency
Cloud/AI infrastructure providers (AWS ~32%, Azure ~22%, GCP ~11% market share in 2024) underpin Taboola’s compute, storage and AI tooling for large-scale recommendation serving; pricing shifts or capacity constraints can compress margins and increase latency.
- Multi-cloud + in-house optimization reduce supplier power
- Model-efficiency (quantization/pruning) can cut inference costs ~20–40%
- Edge delivery lowers bandwidth and latency exposure
Measurement, brand safety, and fraud vendors
Verification, viewability, and anti-fraud partners are required by big advertisers; MRC viewability standards mandate 50% of pixels in view for 1 second (display) and 50% for 2 seconds (video), while many buyers target 70%+ measurable viewability. Certification and compatibility requirements create vendor lock-in and added fees, but Taboola’s proprietary safety layers plus support for third-party tags balance trust and costs; maintaining accreditations (TAG/MRC alignment) reduces single-vendor leverage.
- Verification: MRC 50%/1s (display) and 50%/2s (video)
- Advertiser targets: 70%+ viewability
- Vendor lock-in: certification/compatibility fees
- Mitigation: Taboola safety layers + third-party tag support
Publisher concentration fuels supplier leverage; ~1.4B MAUs, attribution down 30-50%
Premium publishers and exclusives concentrate supplier leverage; Taboola reported ~1.4B MAUs (2024) so losing key sites hurts reach and CPMs. Platform/privacy shifts (post-ATT) cut attribution ~30–50%, raising supplier power. Cloud, verification vendors and identity providers (AWS ~32%, Azure ~22%, GCP ~11% 2024) can squeeze margins; Taboola uses multi-cloud, first-party data and SDKs to mitigate.
| Metric | 2024 Value |
|---|---|
| MAUs | ~1.4B |
| Android/iOS | ≈70% / ≈29% |
| Cloud share | AWS 32% Azure 22% GCP 11% |
| Attribution decline | ~30–50% |
What is included in the product
Detailed Word Document
Comprehensive Porter's Five Forces analysis of Taboola uncovering competitive drivers, buyer and supplier power, substitutes, and market entry risks. Highlights disruptive entrants, monetization pressures, and strategic defenses; fully editable for reports, investor materials, and strategy decks.
Customizable Excel Spreadsheet
A concise, one-sheet Porter's Five Forces for Taboola that clarifies competitive pressures and strategic risks—perfect for rapid decision-making and slide-ready presentations; customizable inputs let you model scenarios (regulation, new entrants) without complex code.
Customers Bargaining Power
Large advertisers and agencies negotiate hard
Large holding companies such as WPP, Publicis and Omnicom aggregate client spend to demand preferential pricing, data access and reporting, and can reallocate budgets to search/social — Google and Meta together take roughly 60% of global digital ad spend. Agencies commonly require custom performance commitments and strict brand safety. Taboola defends by proving incremental reach (1.4B monthly users) and offering outcome-based buying.
Performance marketers are ROI-driven
Performance marketers are ROI-driven and in 2024 shift spend rapidly based on CAC/LTV, pressuring CPC/CPA rates and demanding fast optimization. They expect granular controls and accelerated creative testing to prevent churn, and rely on predictive bidding plus conversion modeling to hit CPA targets. Retention hinges on demonstrable, real-time performance improvements.
Publishers can multi-home with rivals
Publishers often multi-home with rivals like Outbrain and also act as suppliers for Taboola’s monetization tools, running competing widgets to directly benchmark yields; Taboola reports over 500 billion content recommendations per month, which raises comparability. This ability to A/B price and placement elevates publisher leverage in rev-share negotiations and product roadmap requests. Taboola’s cohort analytics and exclusive demand partnerships aim to justify premium CPMs and reduce churn.
SMBs have low switching costs
SMBs' low switching costs empower them to test small self-serve budgets across channels; in 2024 roughly 60% of SMBs used self-serve ad platforms, compressing pricing power for publishers like Taboola. Ease of onboarding elsewhere and ubiquitous programmatic options limit fee increases, though Taboola's education, templates, and automated optimization cut churn by improving ROI. Vertical playbooks (health, finance, retail) raise perceived value and stickiness for SMB advertisers.
- SMB self-serve adoption ~60% (2024)
- Low switching costs reduce pricing leverage
- Education + automation lower churn
- Vertical playbooks increase retention
Demand for transparent measurement
Buyers demand clear attribution, incrementality testing and strict brand safety; lack of transparency drives budget flight to walled gardens, which captured about 56% of US digital ad spend in 2024 (eMarketer). Providing log-level data and independent verification reduces buyer leverage, while stronger audience and performance insights let publishers justify premium placements and higher CPMs.
- Buyers insist on attribution, incrementality, brand safety
- 56% share: Google+Meta US digital ad spend, 2024 (eMarketer)
- Log-level data + independent verification lowers churn
- Better insights enable premium pricing
Buyers hold power as Google+Meta grab 56% of US digital ad spend (2024)
Buyers wield high bargaining power: large agencies and walled gardens (Google+Meta 56% US digital ad spend, 2024) shift budgets and demand attribution; performance marketers force rapid CPC/CPA moves; publishers multi-home (Taboola 500B recommendations/month) to negotiate rev-share; SMBs (60% self-serve, 2024) increase price sensitivity. Taboola defends with 1.4B monthly users, log-level data, outcome-based buying and vertical playbooks.
| Metric | Value (2024) |
|---|---|
| Monthly users | 1.4B |
| Recommendations/month | 500B |
| Google+Meta US share | 56% |
| SMB self-serve | 60% |
Full Version Awaits
Taboola Porter's Five Forces Analysis
This preview displays the exact Taboola Porter's Five Forces Analysis you'll receive after purchase—no samples, no placeholders. The full document is fully formatted, professionally written, and ready for immediate download and use upon payment. Purchase grants instant access to this same file.
Original: $10.00
-65%$10.00
$3.50Description
A Must-Have Tool for Decision-Makers
Taboola's Porter's Five Forces snapshot highlights competitive intensity from publishers and ad-tech rivals, moderating buyer power and rising substitute threats. It outlines supplier dynamics and barriers to entry shaping margins and growth. This brief glimpse surfaces key risks and strategic levers. Unlock the full Porter's Five Forces Analysis to get force-by-force ratings, visuals, and actionable recommendations tailored to Taboola.
Suppliers Bargaining Power
Premium publishers as key inventory source
Premium publishers supply the native placements Taboola monetizes, concentrating leverage among top news and lifestyle sites and driving a disproportionate share of engagement; Taboola reported roughly 1.4 billion monthly active users in 2024. Exclusive or semi-exclusive deals can raise pricing floors and rev-share demands, and losing a marquee publisher materially cuts reach, audience quality, and advertiser spend. Taboola counters with multi-year agreements, publisher tools and yield-optimization algorithms to retain supply.
Mobile platforms and browsers gate access
Distribution is tightly gated by iOS/Android (≈70% Android, ≈29% iOS in 2024) and browser engines whose policy or rendering changes can alter tracking and ad delivery. Platform privacy shifts (post-ATT) have driven industry attribution declines of roughly 30–50%, indirectly increasing supplier power. Compliance and contextual targeting reduce exposure to policy shocks. Deep SDK integrations and high SDK performance are critical to retain delivery and revenue continuity.
Data and identity partners influence targeting
Contextual signals, interest graphs and identity solutions like clean rooms materially affect targeting performance and CPMs; Taboola reaches roughly 1.4 billion monthly uniques (2024), so supplier data quality drives advertiser ROI. Vendors can raise fees or tighten usage, squeezing margins and raising CPMS. Taboola’s investments in first-party data and AI models reduce dependence on external suppliers, while multiple identity pathways lower switching costs from any single provider.
Cloud/AI infrastructure dependency
Cloud/AI infrastructure providers (AWS ~32%, Azure ~22%, GCP ~11% market share in 2024) underpin Taboola’s compute, storage and AI tooling for large-scale recommendation serving; pricing shifts or capacity constraints can compress margins and increase latency.
- Multi-cloud + in-house optimization reduce supplier power
- Model-efficiency (quantization/pruning) can cut inference costs ~20–40%
- Edge delivery lowers bandwidth and latency exposure
Measurement, brand safety, and fraud vendors
Verification, viewability, and anti-fraud partners are required by big advertisers; MRC viewability standards mandate 50% of pixels in view for 1 second (display) and 50% for 2 seconds (video), while many buyers target 70%+ measurable viewability. Certification and compatibility requirements create vendor lock-in and added fees, but Taboola’s proprietary safety layers plus support for third-party tags balance trust and costs; maintaining accreditations (TAG/MRC alignment) reduces single-vendor leverage.
- Verification: MRC 50%/1s (display) and 50%/2s (video)
- Advertiser targets: 70%+ viewability
- Vendor lock-in: certification/compatibility fees
- Mitigation: Taboola safety layers + third-party tag support
Publisher concentration fuels supplier leverage; ~1.4B MAUs, attribution down 30-50%
Premium publishers and exclusives concentrate supplier leverage; Taboola reported ~1.4B MAUs (2024) so losing key sites hurts reach and CPMs. Platform/privacy shifts (post-ATT) cut attribution ~30–50%, raising supplier power. Cloud, verification vendors and identity providers (AWS ~32%, Azure ~22%, GCP ~11% 2024) can squeeze margins; Taboola uses multi-cloud, first-party data and SDKs to mitigate.
| Metric | 2024 Value |
|---|---|
| MAUs | ~1.4B |
| Android/iOS | ≈70% / ≈29% |
| Cloud share | AWS 32% Azure 22% GCP 11% |
| Attribution decline | ~30–50% |
What is included in the product
Detailed Word Document
Comprehensive Porter's Five Forces analysis of Taboola uncovering competitive drivers, buyer and supplier power, substitutes, and market entry risks. Highlights disruptive entrants, monetization pressures, and strategic defenses; fully editable for reports, investor materials, and strategy decks.
Customizable Excel Spreadsheet
A concise, one-sheet Porter's Five Forces for Taboola that clarifies competitive pressures and strategic risks—perfect for rapid decision-making and slide-ready presentations; customizable inputs let you model scenarios (regulation, new entrants) without complex code.
Customers Bargaining Power
Large advertisers and agencies negotiate hard
Large holding companies such as WPP, Publicis and Omnicom aggregate client spend to demand preferential pricing, data access and reporting, and can reallocate budgets to search/social — Google and Meta together take roughly 60% of global digital ad spend. Agencies commonly require custom performance commitments and strict brand safety. Taboola defends by proving incremental reach (1.4B monthly users) and offering outcome-based buying.
Performance marketers are ROI-driven
Performance marketers are ROI-driven and in 2024 shift spend rapidly based on CAC/LTV, pressuring CPC/CPA rates and demanding fast optimization. They expect granular controls and accelerated creative testing to prevent churn, and rely on predictive bidding plus conversion modeling to hit CPA targets. Retention hinges on demonstrable, real-time performance improvements.
Publishers can multi-home with rivals
Publishers often multi-home with rivals like Outbrain and also act as suppliers for Taboola’s monetization tools, running competing widgets to directly benchmark yields; Taboola reports over 500 billion content recommendations per month, which raises comparability. This ability to A/B price and placement elevates publisher leverage in rev-share negotiations and product roadmap requests. Taboola’s cohort analytics and exclusive demand partnerships aim to justify premium CPMs and reduce churn.
SMBs have low switching costs
SMBs' low switching costs empower them to test small self-serve budgets across channels; in 2024 roughly 60% of SMBs used self-serve ad platforms, compressing pricing power for publishers like Taboola. Ease of onboarding elsewhere and ubiquitous programmatic options limit fee increases, though Taboola's education, templates, and automated optimization cut churn by improving ROI. Vertical playbooks (health, finance, retail) raise perceived value and stickiness for SMB advertisers.
- SMB self-serve adoption ~60% (2024)
- Low switching costs reduce pricing leverage
- Education + automation lower churn
- Vertical playbooks increase retention
Demand for transparent measurement
Buyers demand clear attribution, incrementality testing and strict brand safety; lack of transparency drives budget flight to walled gardens, which captured about 56% of US digital ad spend in 2024 (eMarketer). Providing log-level data and independent verification reduces buyer leverage, while stronger audience and performance insights let publishers justify premium placements and higher CPMs.
- Buyers insist on attribution, incrementality, brand safety
- 56% share: Google+Meta US digital ad spend, 2024 (eMarketer)
- Log-level data + independent verification lowers churn
- Better insights enable premium pricing
Buyers hold power as Google+Meta grab 56% of US digital ad spend (2024)
Buyers wield high bargaining power: large agencies and walled gardens (Google+Meta 56% US digital ad spend, 2024) shift budgets and demand attribution; performance marketers force rapid CPC/CPA moves; publishers multi-home (Taboola 500B recommendations/month) to negotiate rev-share; SMBs (60% self-serve, 2024) increase price sensitivity. Taboola defends with 1.4B monthly users, log-level data, outcome-based buying and vertical playbooks.
| Metric | Value (2024) |
|---|---|
| Monthly users | 1.4B |
| Recommendations/month | 500B |
| Google+Meta US share | 56% |
| SMB self-serve | 60% |
Full Version Awaits
Taboola Porter's Five Forces Analysis
This preview displays the exact Taboola Porter's Five Forces Analysis you'll receive after purchase—no samples, no placeholders. The full document is fully formatted, professionally written, and ready for immediate download and use upon payment. Purchase grants instant access to this same file.











