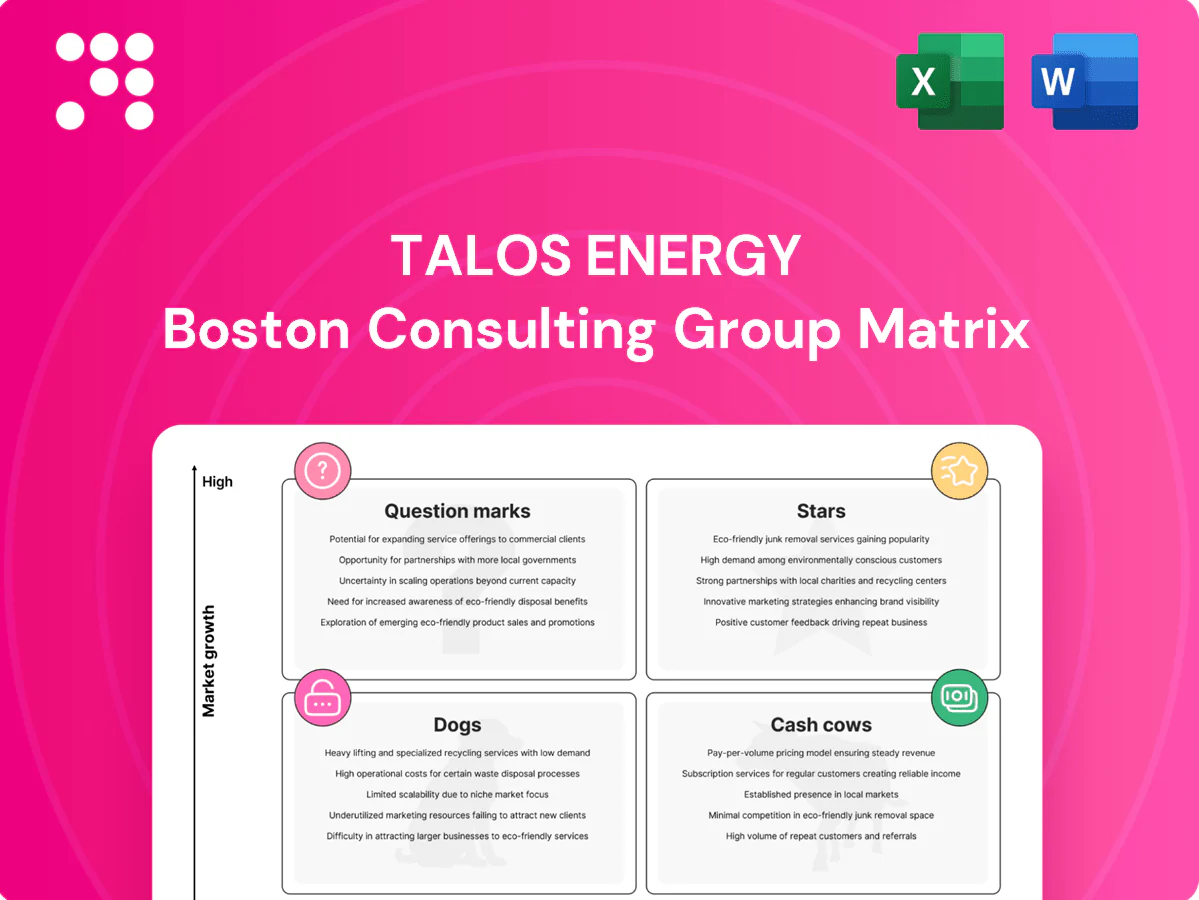
Talos Energy Boston Consulting Group Matrix

Visual. Strategic. Downloadable.
Curious how Talos Energy’s portfolio stacks up—what’s driving growth, what’s funding it, and what’s holding back returns? This preview flags the big moves; the full BCG Matrix delivers quadrant-by-quadrant placement, data-backed recommendations, and a ready-to-use strategy to allocate capital smarter. Purchase the complete report for a Word briefing and Excel summary you can present immediately—skip the guesswork and get straight to strategic clarity.
Stars

Operated deepwater hubs
Talos’s operated deepwater hubs in the U.S. Gulf function as basin anchors, producing roughly 75,000 boe/d in 2024 and attracting capital for low-breakeven barrels. Strong operator control over facilities enables faster tie-backs and high uptime, supporting margins and unit economics. Maintaining share through rigorous safety and reliability keeps these hubs leading; targeted reinvestment is required to protect the moat while tie-back activity remains elevated.
Subsea tie-back program
Tie-backs ride on existing platforms so cycle times can be under 12 months and returns punchy, with typical paybacks often below 18 months. The niche is expanding as operators chase capital-light barrels; Talos leverages scale and relationships to secure inventory and pursue projects that can cut field development capex by ~30–40%. Drilling waves burn cash, so stay aggressive on prospect quality and execution to compound share.

Gulf Coast CCS leadership
CCS on the Gulf Coast is ramping fast with policy tailwinds—45Q incentives now reach up to $60/ton for point-source sequestration and $85/ton for DAC—and regional storage potential exceeds 100 gigatonnes, anchored by heavy industry. Talos is early, visible, and partnered, giving it a real shot at outsized share; early-stage work burns capital and time, but the runway’s large. Keep permitting momentum and customer capture, and this matures into a powerhouse.

Safety and operations culture
Safety and operations culture at Talos is a competitive weapon in offshore: safety excellence keeps platforms online, maintains regulator confidence, reduces cost-of-risk, and improves crew and partner retention; it underwrites every growth move they make. Strong HS&E performance translates directly into operational continuity and commercial optionality for the company.
- HS&E as strategic asset
- Reduces downtime and insurance exposure
- Builds regulator trust
- Improves crew retention
Data-driven prospect maturation
Modern subsurface analytics and smart risk gating in the GoM lifted selective operators’ exploratory hit rates from around 25% to roughly 45% in 2024, with targeted seismic and tech spend—often 10–15% of project budgets—driving deal-winning wells and measurable reserve additions.
Deepwater hubs driving growth: 75k boe/d, tie-backs pay back under 18 months
Stars: Talos’s deepwater hubs (≈75,000 boe/d in 2024) are high-growth, high-share assets with tie-backs delivering paybacks <18 months and ~30–40% FDEV capex savings; CCS upside (45Q $60/$85/ton, >100 Gt storage) and HS&E-driven uptime sustain margins and moat—reinvest to defend share as tie-back activity scales.
| Metric | 2024 | Note |
|---|---|---|
| Production | 75,000 boe/d | Operated GoM hubs |
| Tie-back payback | <18 months | Cycle-driven returns |
| FDEV capex save | 30–40% | Scale & tie-backs |
| Expl hit rate | ≈45% | Modern analytics |
| 45Q | $60/$85 | PS/DAC $/ton |
What is included in the product
 Detailed Word Document
Clear quadrant analysis of Talos Energy's assets, advising which fields to grow, harvest, monitor, or exit.

 Customizable Excel Spreadsheet
One-page Talos Energy BCG Matrix mapping each unit to quadrants for faster, C-suite-ready portfolio decisions
Cash Cows

Legacy GoM production (PDP)
Legacy GoM PDP fields deliver steady cash flow—about 35,000 boe/d net in 2024 with roughly $150 million annualized operating cash generation, benefiting from an infrastructure-rich basin and predictable declines. Low promotional spend required; disciplined operations keep LOE and ARO costs known and manageable. Milk these assets to fund growth projects and cover corporate overhead.
LOE and uptime optimization
Small LOE improvements and uptime gains in 2024 convert directly to meaningful free cash in Talos Energy’s mature Gulf of Mexico portfolio; reliability programs, tighter vendor discipline, and digital monitoring drove steady downward pressure on unit operating costs. Growth remains low while margins expand as LOE per boe declines and uptime stabilizes. Capital spending is calibrated to sustain the machine, not chase growth.

Owned platforms and pipelines
Owned platforms and pipelines lower unit operating costs and create optionality to take third-party volumes; installed kit converts fixed capital into tolling or throughput fees. Replacement cost in the Gulf of Mexico exceeds hundreds of millions of dollars as of 2024, while regional market growth remains modest—classic cash-cow dynamics. Incremental throughput converts directly to incremental cash; maintain assets and toll where economics justify.

Hedging and marketing program
Talos 2024 hedging and marketing program stabilizes cash flow and protects committed capex, delivering predictable funding for Gulf of Mexico operations rather than upside chasing; unsexy but high value. The goal in 2024 is margin preservation over market-share growth, enabling steady funding of exploration without budgetary whiplash. Maintain pragmatic, not speculative, execution.
- 2024 focus: cash-flow stability
- Protects capex and drilling plans
- Preserves margins vs. chasing price spikes
- Funds exploration with minimal volatility
Workovers and recompletions
Workovers and recompletions are short-cycle, repeatable projects with predictable uplift that deliver excellent cash-on-cash returns when prioritized, requiring minimal promotion and largely execution-focused efforts; they act as reliable cash cows within Talos Energy to buffer and smooth free cash flow volatility.
- Short-cycle, high IRR operations
- Low growth profile, strong cash yield
- Minimal capital marketing needed
- Buffers free cash swings
Legacy GoM: 35,000 boe/d, $150M ops cash, low LOE
Legacy GoM PDP ~35,000 boe/d (2024), ~$150M annual operating cash, low LOE/ARO, owned platforms enable tolling; hedging stabilizes cash; capex focused on sustainment and high-IRR workovers.
| Metric | 2024 |
|---|---|
| Net production | 35,000 boe/d |
| Operating cash | $150M |
| LOE trend | Downward |
| Replacement cost | Hundreds $M |
Delivered as Shown
Talos Energy BCG Matrix
The file you're previewing is the exact Talos Energy BCG Matrix you'll receive after purchase. No watermarks, no demo notes—just a fully formatted, ready-to-use report crafted by strategy experts. Once bought it’s immediately downloadable and editable for presentations or planning. No surprises, just practical analysis you can plug right into your workflow.

Visual. Strategic. Downloadable.
Curious how Talos Energy’s portfolio stacks up—what’s driving growth, what’s funding it, and what’s holding back returns? This preview flags the big moves; the full BCG Matrix delivers quadrant-by-quadrant placement, data-backed recommendations, and a ready-to-use strategy to allocate capital smarter. Purchase the complete report for a Word briefing and Excel summary you can present immediately—skip the guesswork and get straight to strategic clarity.
Stars
Operated deepwater hubs
Talos’s operated deepwater hubs in the U.S. Gulf function as basin anchors, producing roughly 75,000 boe/d in 2024 and attracting capital for low-breakeven barrels. Strong operator control over facilities enables faster tie-backs and high uptime, supporting margins and unit economics. Maintaining share through rigorous safety and reliability keeps these hubs leading; targeted reinvestment is required to protect the moat while tie-back activity remains elevated.
Subsea tie-back program
Tie-backs ride on existing platforms so cycle times can be under 12 months and returns punchy, with typical paybacks often below 18 months. The niche is expanding as operators chase capital-light barrels; Talos leverages scale and relationships to secure inventory and pursue projects that can cut field development capex by ~30–40%. Drilling waves burn cash, so stay aggressive on prospect quality and execution to compound share.
Gulf Coast CCS leadership
CCS on the Gulf Coast is ramping fast with policy tailwinds—45Q incentives now reach up to $60/ton for point-source sequestration and $85/ton for DAC—and regional storage potential exceeds 100 gigatonnes, anchored by heavy industry. Talos is early, visible, and partnered, giving it a real shot at outsized share; early-stage work burns capital and time, but the runway’s large. Keep permitting momentum and customer capture, and this matures into a powerhouse.
Safety and operations culture
Safety and operations culture at Talos is a competitive weapon in offshore: safety excellence keeps platforms online, maintains regulator confidence, reduces cost-of-risk, and improves crew and partner retention; it underwrites every growth move they make. Strong HS&E performance translates directly into operational continuity and commercial optionality for the company.
- HS&E as strategic asset
- Reduces downtime and insurance exposure
- Builds regulator trust
- Improves crew retention
Data-driven prospect maturation
Modern subsurface analytics and smart risk gating in the GoM lifted selective operators’ exploratory hit rates from around 25% to roughly 45% in 2024, with targeted seismic and tech spend—often 10–15% of project budgets—driving deal-winning wells and measurable reserve additions.
Deepwater hubs driving growth: 75k boe/d, tie-backs pay back under 18 months
Stars: Talos’s deepwater hubs (≈75,000 boe/d in 2024) are high-growth, high-share assets with tie-backs delivering paybacks <18 months and ~30–40% FDEV capex savings; CCS upside (45Q $60/$85/ton, >100 Gt storage) and HS&E-driven uptime sustain margins and moat—reinvest to defend share as tie-back activity scales.
| Metric | 2024 | Note |
|---|---|---|
| Production | 75,000 boe/d | Operated GoM hubs |
| Tie-back payback | <18 months | Cycle-driven returns |
| FDEV capex save | 30–40% | Scale & tie-backs |
| Expl hit rate | ≈45% | Modern analytics |
| 45Q | $60/$85 | PS/DAC $/ton |
What is included in the product
Detailed Word Document
Clear quadrant analysis of Talos Energy's assets, advising which fields to grow, harvest, monitor, or exit.
Customizable Excel Spreadsheet
One-page Talos Energy BCG Matrix mapping each unit to quadrants for faster, C-suite-ready portfolio decisions
Cash Cows
Legacy GoM production (PDP)
Legacy GoM PDP fields deliver steady cash flow—about 35,000 boe/d net in 2024 with roughly $150 million annualized operating cash generation, benefiting from an infrastructure-rich basin and predictable declines. Low promotional spend required; disciplined operations keep LOE and ARO costs known and manageable. Milk these assets to fund growth projects and cover corporate overhead.
LOE and uptime optimization
Small LOE improvements and uptime gains in 2024 convert directly to meaningful free cash in Talos Energy’s mature Gulf of Mexico portfolio; reliability programs, tighter vendor discipline, and digital monitoring drove steady downward pressure on unit operating costs. Growth remains low while margins expand as LOE per boe declines and uptime stabilizes. Capital spending is calibrated to sustain the machine, not chase growth.
Owned platforms and pipelines
Owned platforms and pipelines lower unit operating costs and create optionality to take third-party volumes; installed kit converts fixed capital into tolling or throughput fees. Replacement cost in the Gulf of Mexico exceeds hundreds of millions of dollars as of 2024, while regional market growth remains modest—classic cash-cow dynamics. Incremental throughput converts directly to incremental cash; maintain assets and toll where economics justify.
Hedging and marketing program
Talos 2024 hedging and marketing program stabilizes cash flow and protects committed capex, delivering predictable funding for Gulf of Mexico operations rather than upside chasing; unsexy but high value. The goal in 2024 is margin preservation over market-share growth, enabling steady funding of exploration without budgetary whiplash. Maintain pragmatic, not speculative, execution.
- 2024 focus: cash-flow stability
- Protects capex and drilling plans
- Preserves margins vs. chasing price spikes
- Funds exploration with minimal volatility
Workovers and recompletions
Workovers and recompletions are short-cycle, repeatable projects with predictable uplift that deliver excellent cash-on-cash returns when prioritized, requiring minimal promotion and largely execution-focused efforts; they act as reliable cash cows within Talos Energy to buffer and smooth free cash flow volatility.
- Short-cycle, high IRR operations
- Low growth profile, strong cash yield
- Minimal capital marketing needed
- Buffers free cash swings
Legacy GoM: 35,000 boe/d, $150M ops cash, low LOE
Legacy GoM PDP ~35,000 boe/d (2024), ~$150M annual operating cash, low LOE/ARO, owned platforms enable tolling; hedging stabilizes cash; capex focused on sustainment and high-IRR workovers.
| Metric | 2024 |
|---|---|
| Net production | 35,000 boe/d |
| Operating cash | $150M |
| LOE trend | Downward |
| Replacement cost | Hundreds $M |
Delivered as Shown
Talos Energy BCG Matrix
The file you're previewing is the exact Talos Energy BCG Matrix you'll receive after purchase. No watermarks, no demo notes—just a fully formatted, ready-to-use report crafted by strategy experts. Once bought it’s immediately downloadable and editable for presentations or planning. No surprises, just practical analysis you can plug right into your workflow.
Description
Visual. Strategic. Downloadable.
Curious how Talos Energy’s portfolio stacks up—what’s driving growth, what’s funding it, and what’s holding back returns? This preview flags the big moves; the full BCG Matrix delivers quadrant-by-quadrant placement, data-backed recommendations, and a ready-to-use strategy to allocate capital smarter. Purchase the complete report for a Word briefing and Excel summary you can present immediately—skip the guesswork and get straight to strategic clarity.
Stars
Operated deepwater hubs
Talos’s operated deepwater hubs in the U.S. Gulf function as basin anchors, producing roughly 75,000 boe/d in 2024 and attracting capital for low-breakeven barrels. Strong operator control over facilities enables faster tie-backs and high uptime, supporting margins and unit economics. Maintaining share through rigorous safety and reliability keeps these hubs leading; targeted reinvestment is required to protect the moat while tie-back activity remains elevated.
Subsea tie-back program
Tie-backs ride on existing platforms so cycle times can be under 12 months and returns punchy, with typical paybacks often below 18 months. The niche is expanding as operators chase capital-light barrels; Talos leverages scale and relationships to secure inventory and pursue projects that can cut field development capex by ~30–40%. Drilling waves burn cash, so stay aggressive on prospect quality and execution to compound share.
Gulf Coast CCS leadership
CCS on the Gulf Coast is ramping fast with policy tailwinds—45Q incentives now reach up to $60/ton for point-source sequestration and $85/ton for DAC—and regional storage potential exceeds 100 gigatonnes, anchored by heavy industry. Talos is early, visible, and partnered, giving it a real shot at outsized share; early-stage work burns capital and time, but the runway’s large. Keep permitting momentum and customer capture, and this matures into a powerhouse.
Safety and operations culture
Safety and operations culture at Talos is a competitive weapon in offshore: safety excellence keeps platforms online, maintains regulator confidence, reduces cost-of-risk, and improves crew and partner retention; it underwrites every growth move they make. Strong HS&E performance translates directly into operational continuity and commercial optionality for the company.
- HS&E as strategic asset
- Reduces downtime and insurance exposure
- Builds regulator trust
- Improves crew retention
Data-driven prospect maturation
Modern subsurface analytics and smart risk gating in the GoM lifted selective operators’ exploratory hit rates from around 25% to roughly 45% in 2024, with targeted seismic and tech spend—often 10–15% of project budgets—driving deal-winning wells and measurable reserve additions.
Deepwater hubs driving growth: 75k boe/d, tie-backs pay back under 18 months
Stars: Talos’s deepwater hubs (≈75,000 boe/d in 2024) are high-growth, high-share assets with tie-backs delivering paybacks <18 months and ~30–40% FDEV capex savings; CCS upside (45Q $60/$85/ton, >100 Gt storage) and HS&E-driven uptime sustain margins and moat—reinvest to defend share as tie-back activity scales.
| Metric | 2024 | Note |
|---|---|---|
| Production | 75,000 boe/d | Operated GoM hubs |
| Tie-back payback | <18 months | Cycle-driven returns |
| FDEV capex save | 30–40% | Scale & tie-backs |
| Expl hit rate | ≈45% | Modern analytics |
| 45Q | $60/$85 | PS/DAC $/ton |
What is included in the product
Detailed Word Document
Clear quadrant analysis of Talos Energy's assets, advising which fields to grow, harvest, monitor, or exit.
Customizable Excel Spreadsheet
One-page Talos Energy BCG Matrix mapping each unit to quadrants for faster, C-suite-ready portfolio decisions
Cash Cows
Legacy GoM production (PDP)
Legacy GoM PDP fields deliver steady cash flow—about 35,000 boe/d net in 2024 with roughly $150 million annualized operating cash generation, benefiting from an infrastructure-rich basin and predictable declines. Low promotional spend required; disciplined operations keep LOE and ARO costs known and manageable. Milk these assets to fund growth projects and cover corporate overhead.
LOE and uptime optimization
Small LOE improvements and uptime gains in 2024 convert directly to meaningful free cash in Talos Energy’s mature Gulf of Mexico portfolio; reliability programs, tighter vendor discipline, and digital monitoring drove steady downward pressure on unit operating costs. Growth remains low while margins expand as LOE per boe declines and uptime stabilizes. Capital spending is calibrated to sustain the machine, not chase growth.
Owned platforms and pipelines
Owned platforms and pipelines lower unit operating costs and create optionality to take third-party volumes; installed kit converts fixed capital into tolling or throughput fees. Replacement cost in the Gulf of Mexico exceeds hundreds of millions of dollars as of 2024, while regional market growth remains modest—classic cash-cow dynamics. Incremental throughput converts directly to incremental cash; maintain assets and toll where economics justify.
Hedging and marketing program
Talos 2024 hedging and marketing program stabilizes cash flow and protects committed capex, delivering predictable funding for Gulf of Mexico operations rather than upside chasing; unsexy but high value. The goal in 2024 is margin preservation over market-share growth, enabling steady funding of exploration without budgetary whiplash. Maintain pragmatic, not speculative, execution.
- 2024 focus: cash-flow stability
- Protects capex and drilling plans
- Preserves margins vs. chasing price spikes
- Funds exploration with minimal volatility
Workovers and recompletions
Workovers and recompletions are short-cycle, repeatable projects with predictable uplift that deliver excellent cash-on-cash returns when prioritized, requiring minimal promotion and largely execution-focused efforts; they act as reliable cash cows within Talos Energy to buffer and smooth free cash flow volatility.
- Short-cycle, high IRR operations
- Low growth profile, strong cash yield
- Minimal capital marketing needed
- Buffers free cash swings
Legacy GoM: 35,000 boe/d, $150M ops cash, low LOE
Legacy GoM PDP ~35,000 boe/d (2024), ~$150M annual operating cash, low LOE/ARO, owned platforms enable tolling; hedging stabilizes cash; capex focused on sustainment and high-IRR workovers.
| Metric | 2024 |
|---|---|
| Net production | 35,000 boe/d |
| Operating cash | $150M |
| LOE trend | Downward |
| Replacement cost | Hundreds $M |
Delivered as Shown
Talos Energy BCG Matrix
The file you're previewing is the exact Talos Energy BCG Matrix you'll receive after purchase. No watermarks, no demo notes—just a fully formatted, ready-to-use report crafted by strategy experts. Once bought it’s immediately downloadable and editable for presentations or planning. No surprises, just practical analysis you can plug right into your workflow.











