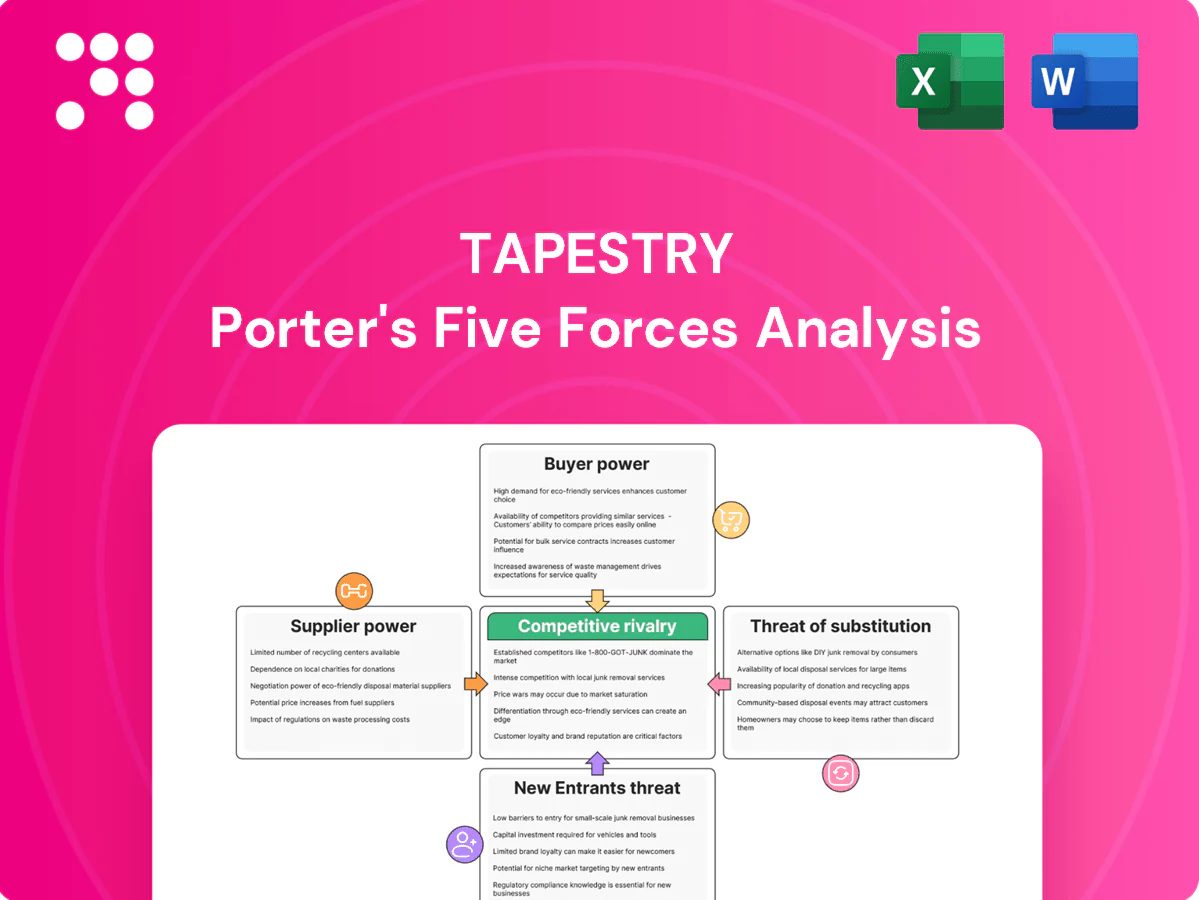
Tapestry Porter's Five Forces Analysis

Don't Miss the Bigger Picture
Tapestry’s Porter's Five Forces snapshot highlights competitive intensity across brands, buyers, suppliers and substitutes, revealing where margins and market share are most at risk. Explore how supplier power, buyer dynamics, and substitute threats shape strategic choices and growth potential. Unlock the full report—consultant-grade, with visuals, force ratings, and ready-to-use Excel/Word deliverables to inform investment or strategy decisions.
Suppliers Bargaining Power

Diverse but specialized material sources
Diverse but specialized material sources: Core inputs—leather, specialty textiles, hardware and embellishments—are often from specialized suppliers; limited availability of premium hides or unique trims increases supplier leverage. Tapestry reported net sales of $6.8 billion in FY2024 and mitigates risk via multi-sourcing and qualifying alternates, yet stringent premium quality specs limit easy substitution.
Manufacturing concentration risk
Production partners remain concentrated in Asia, with roughly 70% of apparel and leather goods manufacturing industry-wide located there, creating exposure to capacity constraints and geopolitical disruptions.
Factory compliance costs, extended lead times and wage inflation have increased vendor leverage; industry lead times rose about 10% in 2023–24, pressuring supply reliability.
Tapestry offsets risk through vendor diversification, nearshoring and dual-sourcing programs that management said reduced single-region dependency in 2024 while raising supply-chain complexity and operating costs.

ESG and compliance requirements
Rising traceability, labor and sustainability standards shrink the qualified supplier pool, enabling compliant vendors to command better commercial terms; Tapestry’s strict brand requirements increase switching costs and amplify supplier leverage. Tapestry mitigates this by cultivating long-term partnerships that trade price concessions for verified compliance and improved supply-chain resilience.

Commodity and FX volatility
Leather, metals and ocean freight costs remain tied to global commodity and FX moves; container rates eased roughly 60-70% from 2021 peaks by 2024 while the US dollar (DXY) averaged near 103 in 2024, enabling some margin relief. Suppliers can pass through spikes, testing Tapestry's margins, but hedging and cost engineering have cushioned shocks. Design agility lets Tapestry shift material mix to reduce supplier leverage.
- Commodity exposure: leather, metals, freight
- 2024: freight ~60-70% down vs 2021 peaks; DXY ~103
- Mitigants: hedging, cost engineering, design agility
Limited vertical integration
Tapestry largely outsources production rather than vertically integrating, limiting control over capacity and cost during demand spikes; in FY2024 the company reported roughly $7.9 billion in net sales, exposing it to supplier constraints. Long-term supplier commitments secure priority manufacturing but reduce negotiating flexibility, though Tapestry's scale and global purchases provide countervailing bargaining power.
- Outsourced production reliance
- FY2024 net sales ~7.9 billion
- Long-term commitments = priority but less price leverage
- Scale purchases partially offset supplier power
High supplier leverage from Asian concentration; scale, multi-sourcing and lower freight ease risk
Suppliers hold moderate-to-high leverage due to specialized inputs (leather, hardware), concentrated Asian manufacturing (~70%), rising compliance costs and ~10% longer lead times in 2023–24, but Tapestry's scale, multi-sourcing and nearshoring reduce risk. Freight fell ~60–70% vs 2021 and DXY ~103 in 2024, easing margin pressure; hedging and cost engineering further mitigate shocks.
| Metric | 2024 |
|---|---|
| Net sales | $7.9B |
| Manufacturing in Asia | ~70% |
| Lead time change | +10% |
| Freight vs 2021 | -60–70% |
| DXY avg | ~103 |
What is included in the product
 Detailed Word Document
Uncovers key competitive drivers—supplier and buyer power, threats of substitutes and new entrants—tailored to Tapestry’s luxury-fashion position, highlighting disruptive risks, pricing leverage, and strategic levers to defend and grow market share.

 Customizable Excel Spreadsheet
One-sheet Porter's Five Forces for Tapestry that visualizes supplier/buyer power, new entrant and substitute threats, and competitive rivalry with editable pressure sliders and scenario tabs—perfect for fast strategic decisions and slide-ready reports.
Customers Bargaining Power

Abundant accessible-luxury choices
Consumers can substitute among Coach, Kate Spade, Michael Kors and Tory Burch with low friction, elevating buyer power in accessible luxury; Tapestry reported $6.53 billion net sales in FY2024, reflecting intense competition. Differentiated design and heritage storytelling by Coach and Kate Spade help curb switching. Pricing ladders and limited capsule drops create perceived uniqueness and moment-driven demand.
Price transparency via e-commerce
Price transparency via e-commerce lets shoppers compare prices and promo calendars instantly, driving many to wait for sales, outlets and event promotions and pressuring ASPs; Tapestry manages this through DTC control and markdown cadence (DTC represented roughly 45% of net sales in FY2024). Loyalty programs and exclusive online drops lower price elasticity by fostering repeat purchase and higher AOVs, reducing markdown dependency.

Wholesale and marketplace leverage
Department stores and online marketplaces retain strong leverage, routinely negotiating markdown allowances and return terms that squeeze margins; wholesale accounted for roughly 40% of Tapestry’s FY2024 net sales of about $6.2 billion, sustaining that pressure. Tapestry’s ~60% DTC mix mitigates but does not eliminate buyer power by preserving margin and customer data. Assortment differentiation and disciplined allocation protect brand equity while data sharing with partners improved joint sell-through and reduced clearance rates in 2024.

Trend and experience sensitivity
Buyers pivot rapidly with fashion cycles and social trends; Tapestry's relevance risk rose in 2024 as rapid shifts can erase demand within seasons, amplifying buyer bargaining power. Missed design relevance pressures markdowns and channel promotions, while Tapestry's data-driven design and faster product refresh shorten response times. Omni-channel experiences—digital, stores, and clienteling—sustain engagement beyond price.
- FY2024 net sales: 6.7 billion USD
- Faster refresh reduces lead time to weeks
- Omni-channel drives loyalty, not just price
Global macro sensitivity
Global macro sensitivity raises customer bargaining power as consumers pull back in economic downturns or shift with FX-driven tourism changes, pressuring Tapestry to increase promotions and markdowns. Demand cyclicality amplifies discounting frequency, while diversified geographies and categories smooth volatility across regions. Entry-price products sustain store traffic and protect core icons.
Buyers wield leverage; DTC loyalty cushions margins while wholesale fuels promotional pressure
Buyers hold strong leverage via low-friction substitution; Tapestry reported $6.53B net sales in FY2024. DTC (~45% FY2024) and loyalty lower price elasticity, while wholesale (~40%) and retailers pressure margins. Omni-channel, faster refresh and entry-price assortments mitigate power but cyclicality increases promotional cadence.
| Metric | FY2024 |
|---|---|
| Net sales | $6.53B |
| DTC mix | ~45% |
| Wholesale mix | ~40% |
| Brands | Coach, Kate Spade, Stuart Weitzman |
Preview Before You Purchase
Tapestry Porter's Five Forces Analysis
This preview presents the complete Tapestry Porter's Five Forces Analysis and is the exact file you'll receive after purchase. It covers competitive rivalry, supplier and buyer power, threats of entry and substitutes, and strategic implications. No samples or placeholders—fully formatted and ready to use.

Don't Miss the Bigger Picture
Tapestry’s Porter's Five Forces snapshot highlights competitive intensity across brands, buyers, suppliers and substitutes, revealing where margins and market share are most at risk. Explore how supplier power, buyer dynamics, and substitute threats shape strategic choices and growth potential. Unlock the full report—consultant-grade, with visuals, force ratings, and ready-to-use Excel/Word deliverables to inform investment or strategy decisions.
Suppliers Bargaining Power
Diverse but specialized material sources
Diverse but specialized material sources: Core inputs—leather, specialty textiles, hardware and embellishments—are often from specialized suppliers; limited availability of premium hides or unique trims increases supplier leverage. Tapestry reported net sales of $6.8 billion in FY2024 and mitigates risk via multi-sourcing and qualifying alternates, yet stringent premium quality specs limit easy substitution.
Manufacturing concentration risk
Production partners remain concentrated in Asia, with roughly 70% of apparel and leather goods manufacturing industry-wide located there, creating exposure to capacity constraints and geopolitical disruptions.
Factory compliance costs, extended lead times and wage inflation have increased vendor leverage; industry lead times rose about 10% in 2023–24, pressuring supply reliability.
Tapestry offsets risk through vendor diversification, nearshoring and dual-sourcing programs that management said reduced single-region dependency in 2024 while raising supply-chain complexity and operating costs.
ESG and compliance requirements
Rising traceability, labor and sustainability standards shrink the qualified supplier pool, enabling compliant vendors to command better commercial terms; Tapestry’s strict brand requirements increase switching costs and amplify supplier leverage. Tapestry mitigates this by cultivating long-term partnerships that trade price concessions for verified compliance and improved supply-chain resilience.
Commodity and FX volatility
Leather, metals and ocean freight costs remain tied to global commodity and FX moves; container rates eased roughly 60-70% from 2021 peaks by 2024 while the US dollar (DXY) averaged near 103 in 2024, enabling some margin relief. Suppliers can pass through spikes, testing Tapestry's margins, but hedging and cost engineering have cushioned shocks. Design agility lets Tapestry shift material mix to reduce supplier leverage.
- Commodity exposure: leather, metals, freight
- 2024: freight ~60-70% down vs 2021 peaks; DXY ~103
- Mitigants: hedging, cost engineering, design agility
Limited vertical integration
Tapestry largely outsources production rather than vertically integrating, limiting control over capacity and cost during demand spikes; in FY2024 the company reported roughly $7.9 billion in net sales, exposing it to supplier constraints. Long-term supplier commitments secure priority manufacturing but reduce negotiating flexibility, though Tapestry's scale and global purchases provide countervailing bargaining power.
- Outsourced production reliance
- FY2024 net sales ~7.9 billion
- Long-term commitments = priority but less price leverage
- Scale purchases partially offset supplier power
High supplier leverage from Asian concentration; scale, multi-sourcing and lower freight ease risk
Suppliers hold moderate-to-high leverage due to specialized inputs (leather, hardware), concentrated Asian manufacturing (~70%), rising compliance costs and ~10% longer lead times in 2023–24, but Tapestry's scale, multi-sourcing and nearshoring reduce risk. Freight fell ~60–70% vs 2021 and DXY ~103 in 2024, easing margin pressure; hedging and cost engineering further mitigate shocks.
| Metric | 2024 |
|---|---|
| Net sales | $7.9B |
| Manufacturing in Asia | ~70% |
| Lead time change | +10% |
| Freight vs 2021 | -60–70% |
| DXY avg | ~103 |
What is included in the product
Detailed Word Document
Uncovers key competitive drivers—supplier and buyer power, threats of substitutes and new entrants—tailored to Tapestry’s luxury-fashion position, highlighting disruptive risks, pricing leverage, and strategic levers to defend and grow market share.
Customizable Excel Spreadsheet
One-sheet Porter's Five Forces for Tapestry that visualizes supplier/buyer power, new entrant and substitute threats, and competitive rivalry with editable pressure sliders and scenario tabs—perfect for fast strategic decisions and slide-ready reports.
Customers Bargaining Power
Abundant accessible-luxury choices
Consumers can substitute among Coach, Kate Spade, Michael Kors and Tory Burch with low friction, elevating buyer power in accessible luxury; Tapestry reported $6.53 billion net sales in FY2024, reflecting intense competition. Differentiated design and heritage storytelling by Coach and Kate Spade help curb switching. Pricing ladders and limited capsule drops create perceived uniqueness and moment-driven demand.
Price transparency via e-commerce
Price transparency via e-commerce lets shoppers compare prices and promo calendars instantly, driving many to wait for sales, outlets and event promotions and pressuring ASPs; Tapestry manages this through DTC control and markdown cadence (DTC represented roughly 45% of net sales in FY2024). Loyalty programs and exclusive online drops lower price elasticity by fostering repeat purchase and higher AOVs, reducing markdown dependency.
Wholesale and marketplace leverage
Department stores and online marketplaces retain strong leverage, routinely negotiating markdown allowances and return terms that squeeze margins; wholesale accounted for roughly 40% of Tapestry’s FY2024 net sales of about $6.2 billion, sustaining that pressure. Tapestry’s ~60% DTC mix mitigates but does not eliminate buyer power by preserving margin and customer data. Assortment differentiation and disciplined allocation protect brand equity while data sharing with partners improved joint sell-through and reduced clearance rates in 2024.
Trend and experience sensitivity
Buyers pivot rapidly with fashion cycles and social trends; Tapestry's relevance risk rose in 2024 as rapid shifts can erase demand within seasons, amplifying buyer bargaining power. Missed design relevance pressures markdowns and channel promotions, while Tapestry's data-driven design and faster product refresh shorten response times. Omni-channel experiences—digital, stores, and clienteling—sustain engagement beyond price.
- FY2024 net sales: 6.7 billion USD
- Faster refresh reduces lead time to weeks
- Omni-channel drives loyalty, not just price
Global macro sensitivity
Global macro sensitivity raises customer bargaining power as consumers pull back in economic downturns or shift with FX-driven tourism changes, pressuring Tapestry to increase promotions and markdowns. Demand cyclicality amplifies discounting frequency, while diversified geographies and categories smooth volatility across regions. Entry-price products sustain store traffic and protect core icons.
Buyers wield leverage; DTC loyalty cushions margins while wholesale fuels promotional pressure
Buyers hold strong leverage via low-friction substitution; Tapestry reported $6.53B net sales in FY2024. DTC (~45% FY2024) and loyalty lower price elasticity, while wholesale (~40%) and retailers pressure margins. Omni-channel, faster refresh and entry-price assortments mitigate power but cyclicality increases promotional cadence.
| Metric | FY2024 |
|---|---|
| Net sales | $6.53B |
| DTC mix | ~45% |
| Wholesale mix | ~40% |
| Brands | Coach, Kate Spade, Stuart Weitzman |
Preview Before You Purchase
Tapestry Porter's Five Forces Analysis
This preview presents the complete Tapestry Porter's Five Forces Analysis and is the exact file you'll receive after purchase. It covers competitive rivalry, supplier and buyer power, threats of entry and substitutes, and strategic implications. No samples or placeholders—fully formatted and ready to use.
Original: $10.00
-65%$10.00
$3.50Description
Don't Miss the Bigger Picture
Tapestry’s Porter's Five Forces snapshot highlights competitive intensity across brands, buyers, suppliers and substitutes, revealing where margins and market share are most at risk. Explore how supplier power, buyer dynamics, and substitute threats shape strategic choices and growth potential. Unlock the full report—consultant-grade, with visuals, force ratings, and ready-to-use Excel/Word deliverables to inform investment or strategy decisions.
Suppliers Bargaining Power
Diverse but specialized material sources
Diverse but specialized material sources: Core inputs—leather, specialty textiles, hardware and embellishments—are often from specialized suppliers; limited availability of premium hides or unique trims increases supplier leverage. Tapestry reported net sales of $6.8 billion in FY2024 and mitigates risk via multi-sourcing and qualifying alternates, yet stringent premium quality specs limit easy substitution.
Manufacturing concentration risk
Production partners remain concentrated in Asia, with roughly 70% of apparel and leather goods manufacturing industry-wide located there, creating exposure to capacity constraints and geopolitical disruptions.
Factory compliance costs, extended lead times and wage inflation have increased vendor leverage; industry lead times rose about 10% in 2023–24, pressuring supply reliability.
Tapestry offsets risk through vendor diversification, nearshoring and dual-sourcing programs that management said reduced single-region dependency in 2024 while raising supply-chain complexity and operating costs.
ESG and compliance requirements
Rising traceability, labor and sustainability standards shrink the qualified supplier pool, enabling compliant vendors to command better commercial terms; Tapestry’s strict brand requirements increase switching costs and amplify supplier leverage. Tapestry mitigates this by cultivating long-term partnerships that trade price concessions for verified compliance and improved supply-chain resilience.
Commodity and FX volatility
Leather, metals and ocean freight costs remain tied to global commodity and FX moves; container rates eased roughly 60-70% from 2021 peaks by 2024 while the US dollar (DXY) averaged near 103 in 2024, enabling some margin relief. Suppliers can pass through spikes, testing Tapestry's margins, but hedging and cost engineering have cushioned shocks. Design agility lets Tapestry shift material mix to reduce supplier leverage.
- Commodity exposure: leather, metals, freight
- 2024: freight ~60-70% down vs 2021 peaks; DXY ~103
- Mitigants: hedging, cost engineering, design agility
Limited vertical integration
Tapestry largely outsources production rather than vertically integrating, limiting control over capacity and cost during demand spikes; in FY2024 the company reported roughly $7.9 billion in net sales, exposing it to supplier constraints. Long-term supplier commitments secure priority manufacturing but reduce negotiating flexibility, though Tapestry's scale and global purchases provide countervailing bargaining power.
- Outsourced production reliance
- FY2024 net sales ~7.9 billion
- Long-term commitments = priority but less price leverage
- Scale purchases partially offset supplier power
High supplier leverage from Asian concentration; scale, multi-sourcing and lower freight ease risk
Suppliers hold moderate-to-high leverage due to specialized inputs (leather, hardware), concentrated Asian manufacturing (~70%), rising compliance costs and ~10% longer lead times in 2023–24, but Tapestry's scale, multi-sourcing and nearshoring reduce risk. Freight fell ~60–70% vs 2021 and DXY ~103 in 2024, easing margin pressure; hedging and cost engineering further mitigate shocks.
| Metric | 2024 |
|---|---|
| Net sales | $7.9B |
| Manufacturing in Asia | ~70% |
| Lead time change | +10% |
| Freight vs 2021 | -60–70% |
| DXY avg | ~103 |
What is included in the product
Detailed Word Document
Uncovers key competitive drivers—supplier and buyer power, threats of substitutes and new entrants—tailored to Tapestry’s luxury-fashion position, highlighting disruptive risks, pricing leverage, and strategic levers to defend and grow market share.
Customizable Excel Spreadsheet
One-sheet Porter's Five Forces for Tapestry that visualizes supplier/buyer power, new entrant and substitute threats, and competitive rivalry with editable pressure sliders and scenario tabs—perfect for fast strategic decisions and slide-ready reports.
Customers Bargaining Power
Abundant accessible-luxury choices
Consumers can substitute among Coach, Kate Spade, Michael Kors and Tory Burch with low friction, elevating buyer power in accessible luxury; Tapestry reported $6.53 billion net sales in FY2024, reflecting intense competition. Differentiated design and heritage storytelling by Coach and Kate Spade help curb switching. Pricing ladders and limited capsule drops create perceived uniqueness and moment-driven demand.
Price transparency via e-commerce
Price transparency via e-commerce lets shoppers compare prices and promo calendars instantly, driving many to wait for sales, outlets and event promotions and pressuring ASPs; Tapestry manages this through DTC control and markdown cadence (DTC represented roughly 45% of net sales in FY2024). Loyalty programs and exclusive online drops lower price elasticity by fostering repeat purchase and higher AOVs, reducing markdown dependency.
Wholesale and marketplace leverage
Department stores and online marketplaces retain strong leverage, routinely negotiating markdown allowances and return terms that squeeze margins; wholesale accounted for roughly 40% of Tapestry’s FY2024 net sales of about $6.2 billion, sustaining that pressure. Tapestry’s ~60% DTC mix mitigates but does not eliminate buyer power by preserving margin and customer data. Assortment differentiation and disciplined allocation protect brand equity while data sharing with partners improved joint sell-through and reduced clearance rates in 2024.
Trend and experience sensitivity
Buyers pivot rapidly with fashion cycles and social trends; Tapestry's relevance risk rose in 2024 as rapid shifts can erase demand within seasons, amplifying buyer bargaining power. Missed design relevance pressures markdowns and channel promotions, while Tapestry's data-driven design and faster product refresh shorten response times. Omni-channel experiences—digital, stores, and clienteling—sustain engagement beyond price.
- FY2024 net sales: 6.7 billion USD
- Faster refresh reduces lead time to weeks
- Omni-channel drives loyalty, not just price
Global macro sensitivity
Global macro sensitivity raises customer bargaining power as consumers pull back in economic downturns or shift with FX-driven tourism changes, pressuring Tapestry to increase promotions and markdowns. Demand cyclicality amplifies discounting frequency, while diversified geographies and categories smooth volatility across regions. Entry-price products sustain store traffic and protect core icons.
Buyers wield leverage; DTC loyalty cushions margins while wholesale fuels promotional pressure
Buyers hold strong leverage via low-friction substitution; Tapestry reported $6.53B net sales in FY2024. DTC (~45% FY2024) and loyalty lower price elasticity, while wholesale (~40%) and retailers pressure margins. Omni-channel, faster refresh and entry-price assortments mitigate power but cyclicality increases promotional cadence.
| Metric | FY2024 |
|---|---|
| Net sales | $6.53B |
| DTC mix | ~45% |
| Wholesale mix | ~40% |
| Brands | Coach, Kate Spade, Stuart Weitzman |
Preview Before You Purchase
Tapestry Porter's Five Forces Analysis
This preview presents the complete Tapestry Porter's Five Forces Analysis and is the exact file you'll receive after purchase. It covers competitive rivalry, supplier and buyer power, threats of entry and substitutes, and strategic implications. No samples or placeholders—fully formatted and ready to use.











