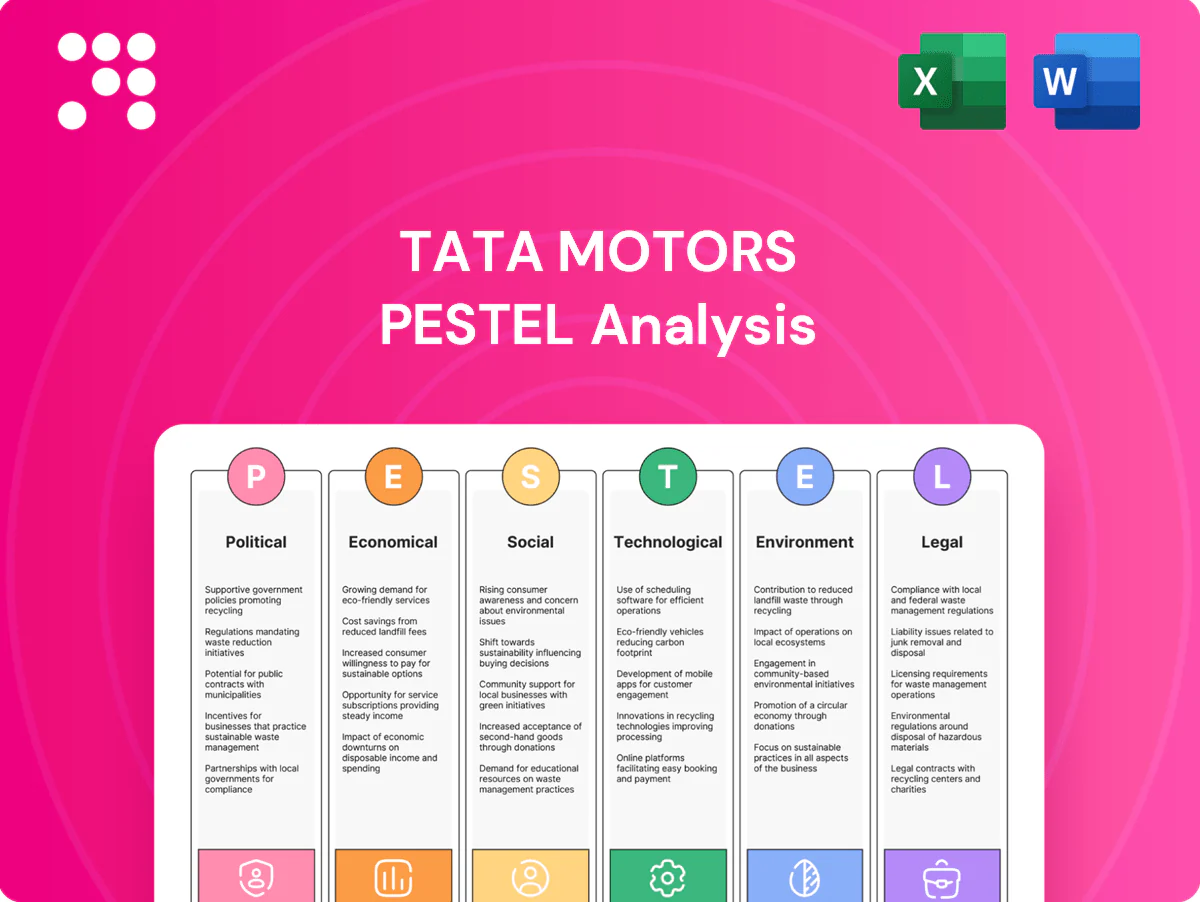
Tata Motors PESTLE Analysis

Skip the Research. Get the Strategy.
Unlock strategic clarity with our concise PESTLE Analysis of Tata Motors — three to five expert insights on how political shifts, economic cycles, technology adoption, social trends, and regulatory pressures shape its roadmap. Ideal for investors and strategists seeking actionable context. Purchase the full report to get the complete, editable analysis and immediate competitive advantage.
Political factors

Industrial policy and incentives
Production-linked incentives such as the ACC PLI (₹18,100 crore) and Make in India drive lower capex barriers and accelerate local EV/component manufacturing for Tata Motors. Access to central schemes like FAME-II (₹10,000 crore) and state EV subsidies affects vehicle roadmaps, pricing and total cost of ownership. Any reallocation or timeline shifts in these incentives can materially change IRR, so Tata Motors must align capex cadence with evolving policy windows.
Trade policy and tariffs
Import duties — India’s high basic customs duty on CBUs (~60%) versus much lower rates on components (0–15%) — drive Tata Motors toward local sourcing and affects margin recovery on premium models. Shifts in FTAs (eg. ongoing India-EU talks), stricter local-content rules or anti-dumping probes can force supply-chain reshuffles and nearshoring. Export competitiveness hinges on stable tariff corridors; modular platforms and multi-country sourcing hedge tariff volatility and protect EBITDA.

Geopolitical risk and supply chain security
Geopolitical tensions (Russia-Ukraine, US-China/Taiwan) threaten semiconductors, batteries and critical minerals; chips now account for roughly $300–500 of content per vehicle and battery raw materials are ~30–40% of pack cost. Sanctions and shipping-route volatility push lead times to 20–40 weeks and strain working capital. Diversifying suppliers and near-shoring key components mitigates exposure. Scenario planning is essential for high-value models and commercial fleets.

Public infrastructure and mobility policy
Rising public capex—central capital expenditure set at INR 10 lakh crore for 2024–25—plus PM Gati Shakti logistics and urban transport investments lift CV and bus demand; national and state electrification mandates and large public tenders increasingly determine order pipelines. Policy support for charging hubs and proposed hydrogen corridors shifts Tata Motors toward BEV/FCEV R&D, while close engagement with transport agencies secures long-duration fleet contracts.
- Capex: INR 10 lakh crore (2024–25)
- Bus electrification: public tenders driving fleet renewals
- Charging/hydrogen corridors: shapes tech investment
- Transport agency engagement: long-term contracts
Government procurement and defense
Defense and public-sector procurement provide countercyclical demand for Tata Motors, with FY 2024-25 procurement programs sustaining orders even during OEM cyclic downturns. Localization mandates and indigenization targets set in 2024 reshape product specs and supplier sourcing. Long approval cycles and heavy compliance inflate working capital needs, while strategic alignment with national defence roadmaps can deepen Tata Motors’ portfolio moat.
- Countercyclical demand: FY 2024-25 procurement
- Localization: indigenization-driven specs
- Working capital: long approvals, compliance
- Moat: alignment with defence roadmaps
Policy incentives and capex spur India EV/CV demand; localization and chip, battery cost risks
Policy incentives (ACC PLI ₹18,100 crore, FAME‑II ₹10,000 crore) and INR 10 lakh crore public capex (2024‑25) accelerate EV and CV demand but create timing risk for IRR. High CBU duties (~60%) push localization; India‑EU FTA talks and anti‑dumping actions can alter supply chains. Geopolitics raise chip lead times to 20–40 weeks; chips $300–500/vehicle, battery materials ~30–40% of pack cost.
| Metric | Value |
|---|---|
| ACC PLI | ₹18,100 cr |
| FAME‑II | ₹10,000 cr |
| Public capex (24‑25) | ₹10 lakh cr |
| CBU duty | ~60% |
| Chip content | $300–500/veh |
What is included in the product
 Detailed Word Document
Explores how Political, Economic, Social, Technological, Environmental and Legal forces uniquely affect Tata Motors, using data-driven trends and region-specific examples to identify risks and opportunities. Designed for executives and investors with forward-looking insights for strategy and scenario planning.

 Customizable Excel Spreadsheet
A clean, summarized Tata Motors PESTLE that’s visually segmented by category for quick interpretation, ideal for dropping into presentations or sharing across teams. Allows users to add region- or line-specific notes to support planning discussions on external risk and market positioning.
Economic factors

Macroeconomic growth and income elasticity
Passenger and commercial vehicle volumes closely follow GDP and capex cycles—India grew ~7.2% in FY24—so demand, replacement rates and fleet expansion swing with consumer confidence. Rising incomes and formalization have lifted premium mix and financing penetration to roughly 60% for passenger cars, while slowdowns compress replacement cycles; Tata Motors must balance high-volume models with margin-accretive trims and feature-rich variants.
Commodity and energy costs
Steel, aluminium, rubber and battery metals drive cost volatility for Tata Motors; lithium carbonate plunged about 80% from 2022 peaks to 2024 while global HRC steel eased roughly 15–25% in 2024, tightening margins and sourcing risks. Diesel levels and industrial electricity tariffs (circa ₹8–10/kWh) materially affect TCO for CVs and EVs. Pricing power and pass-through depend on competitive intensity and demand; long-term contracts and design-to-cost remain critical levers.

Currency movements and global exposure
INR-GBP volatility (GBP roughly averaging 103 INR in 2024) materially affects Tata Motors through higher costs for imported components and JLR revenues booked in pounds (JLR reported ~£19bn revenue in FY2024), creating translation and transaction risks that compress reported profitability. Localization of parts and export-driven natural hedges have partially offset FX swings, but management needs active hedging and regional pricing to protect margins and cashflows.

Interest rates and credit availability
Auto demand for Tata Motors is highly sensitive to retail finance and fleet leasing costs; India’s policy repo rate stood at 6.5% as of July 2025, which raises EMI burdens and can reduce affordability and dealer inventory financing.
- OEM captive finance sustains throughput
- Higher rates tighten dealer working capital
- Flexible incentives manage rate cycles
Inflation and consumer mix shifts
Sustained inflation (India CPI ~5.7% in FY2023-24; RBI target 4%±2%) nudges retail buyers toward value trims and the used-vehicle market, while premiumization endures where features/perceived value justify higher prices. Fleet operators increasingly optimize total cost of ownership, steering powertrain mix toward fuel-efficient or low-maintenance options. Agile trim planning and strict discount discipline are essential to protect Tata Motors margins.
- value-shift: buyers favor lower trims/used cars
- premiumization: persists if feature-value aligned
- fleet-TCO: drives powertrain choices
- margin-protection: agile trims + discount discipline
Policy incentives and capex spur India EV/CV demand; localization and chip, battery cost risks
India GDP ~7.2% in FY24 drives vehicle volumes; financing penetration ~60% for passenger cars, boosting premium mix but raising rate sensitivity. Input-cost swings (lithium -80% from 2022 to 2024; HRC steel down ~15–25% in 2024) compress margins. GBP avg ~103 INR (2024) and JLR revenue ~£19bn (FY2024) create FX risks. RBI repo 6.5% (Jul 2025) tightens EMIs and dealer working capital.
| Metric | Value |
|---|---|
| India GDP FY24 | ~7.2% |
| Repo rate Jul 2025 | 6.5% |
| Passenger car finance | ~60% |
| JLR rev FY2024 | ~£19bn |
What You See Is What You Get
Tata Motors PESTLE Analysis
The Tata Motors PESTLE analysis examines political, economic, social, technological, legal, and environmental factors shaping the company’s strategic risks and opportunities. It highlights regulatory shifts, market trends, innovation drivers, and sustainability pressures with clear implications for strategy. The preview shown here is the exact document you’ll receive after purchase—fully formatted and ready to use. Use it to inform investment or strategic decisions immediately.

Skip the Research. Get the Strategy.
Unlock strategic clarity with our concise PESTLE Analysis of Tata Motors — three to five expert insights on how political shifts, economic cycles, technology adoption, social trends, and regulatory pressures shape its roadmap. Ideal for investors and strategists seeking actionable context. Purchase the full report to get the complete, editable analysis and immediate competitive advantage.
Political factors
Industrial policy and incentives
Production-linked incentives such as the ACC PLI (₹18,100 crore) and Make in India drive lower capex barriers and accelerate local EV/component manufacturing for Tata Motors. Access to central schemes like FAME-II (₹10,000 crore) and state EV subsidies affects vehicle roadmaps, pricing and total cost of ownership. Any reallocation or timeline shifts in these incentives can materially change IRR, so Tata Motors must align capex cadence with evolving policy windows.
Trade policy and tariffs
Import duties — India’s high basic customs duty on CBUs (~60%) versus much lower rates on components (0–15%) — drive Tata Motors toward local sourcing and affects margin recovery on premium models. Shifts in FTAs (eg. ongoing India-EU talks), stricter local-content rules or anti-dumping probes can force supply-chain reshuffles and nearshoring. Export competitiveness hinges on stable tariff corridors; modular platforms and multi-country sourcing hedge tariff volatility and protect EBITDA.
Geopolitical risk and supply chain security
Geopolitical tensions (Russia-Ukraine, US-China/Taiwan) threaten semiconductors, batteries and critical minerals; chips now account for roughly $300–500 of content per vehicle and battery raw materials are ~30–40% of pack cost. Sanctions and shipping-route volatility push lead times to 20–40 weeks and strain working capital. Diversifying suppliers and near-shoring key components mitigates exposure. Scenario planning is essential for high-value models and commercial fleets.
Public infrastructure and mobility policy
Rising public capex—central capital expenditure set at INR 10 lakh crore for 2024–25—plus PM Gati Shakti logistics and urban transport investments lift CV and bus demand; national and state electrification mandates and large public tenders increasingly determine order pipelines. Policy support for charging hubs and proposed hydrogen corridors shifts Tata Motors toward BEV/FCEV R&D, while close engagement with transport agencies secures long-duration fleet contracts.
- Capex: INR 10 lakh crore (2024–25)
- Bus electrification: public tenders driving fleet renewals
- Charging/hydrogen corridors: shapes tech investment
- Transport agency engagement: long-term contracts
Government procurement and defense
Defense and public-sector procurement provide countercyclical demand for Tata Motors, with FY 2024-25 procurement programs sustaining orders even during OEM cyclic downturns. Localization mandates and indigenization targets set in 2024 reshape product specs and supplier sourcing. Long approval cycles and heavy compliance inflate working capital needs, while strategic alignment with national defence roadmaps can deepen Tata Motors’ portfolio moat.
- Countercyclical demand: FY 2024-25 procurement
- Localization: indigenization-driven specs
- Working capital: long approvals, compliance
- Moat: alignment with defence roadmaps
Policy incentives and capex spur India EV/CV demand; localization and chip, battery cost risks
Policy incentives (ACC PLI ₹18,100 crore, FAME‑II ₹10,000 crore) and INR 10 lakh crore public capex (2024‑25) accelerate EV and CV demand but create timing risk for IRR. High CBU duties (~60%) push localization; India‑EU FTA talks and anti‑dumping actions can alter supply chains. Geopolitics raise chip lead times to 20–40 weeks; chips $300–500/vehicle, battery materials ~30–40% of pack cost.
| Metric | Value |
|---|---|
| ACC PLI | ₹18,100 cr |
| FAME‑II | ₹10,000 cr |
| Public capex (24‑25) | ₹10 lakh cr |
| CBU duty | ~60% |
| Chip content | $300–500/veh |
What is included in the product
Detailed Word Document
Explores how Political, Economic, Social, Technological, Environmental and Legal forces uniquely affect Tata Motors, using data-driven trends and region-specific examples to identify risks and opportunities. Designed for executives and investors with forward-looking insights for strategy and scenario planning.
Customizable Excel Spreadsheet
A clean, summarized Tata Motors PESTLE that’s visually segmented by category for quick interpretation, ideal for dropping into presentations or sharing across teams. Allows users to add region- or line-specific notes to support planning discussions on external risk and market positioning.
Economic factors
Macroeconomic growth and income elasticity
Passenger and commercial vehicle volumes closely follow GDP and capex cycles—India grew ~7.2% in FY24—so demand, replacement rates and fleet expansion swing with consumer confidence. Rising incomes and formalization have lifted premium mix and financing penetration to roughly 60% for passenger cars, while slowdowns compress replacement cycles; Tata Motors must balance high-volume models with margin-accretive trims and feature-rich variants.
Commodity and energy costs
Steel, aluminium, rubber and battery metals drive cost volatility for Tata Motors; lithium carbonate plunged about 80% from 2022 peaks to 2024 while global HRC steel eased roughly 15–25% in 2024, tightening margins and sourcing risks. Diesel levels and industrial electricity tariffs (circa ₹8–10/kWh) materially affect TCO for CVs and EVs. Pricing power and pass-through depend on competitive intensity and demand; long-term contracts and design-to-cost remain critical levers.
Currency movements and global exposure
INR-GBP volatility (GBP roughly averaging 103 INR in 2024) materially affects Tata Motors through higher costs for imported components and JLR revenues booked in pounds (JLR reported ~£19bn revenue in FY2024), creating translation and transaction risks that compress reported profitability. Localization of parts and export-driven natural hedges have partially offset FX swings, but management needs active hedging and regional pricing to protect margins and cashflows.
Interest rates and credit availability
Auto demand for Tata Motors is highly sensitive to retail finance and fleet leasing costs; India’s policy repo rate stood at 6.5% as of July 2025, which raises EMI burdens and can reduce affordability and dealer inventory financing.
- OEM captive finance sustains throughput
- Higher rates tighten dealer working capital
- Flexible incentives manage rate cycles
Inflation and consumer mix shifts
Sustained inflation (India CPI ~5.7% in FY2023-24; RBI target 4%±2%) nudges retail buyers toward value trims and the used-vehicle market, while premiumization endures where features/perceived value justify higher prices. Fleet operators increasingly optimize total cost of ownership, steering powertrain mix toward fuel-efficient or low-maintenance options. Agile trim planning and strict discount discipline are essential to protect Tata Motors margins.
- value-shift: buyers favor lower trims/used cars
- premiumization: persists if feature-value aligned
- fleet-TCO: drives powertrain choices
- margin-protection: agile trims + discount discipline
Policy incentives and capex spur India EV/CV demand; localization and chip, battery cost risks
India GDP ~7.2% in FY24 drives vehicle volumes; financing penetration ~60% for passenger cars, boosting premium mix but raising rate sensitivity. Input-cost swings (lithium -80% from 2022 to 2024; HRC steel down ~15–25% in 2024) compress margins. GBP avg ~103 INR (2024) and JLR revenue ~£19bn (FY2024) create FX risks. RBI repo 6.5% (Jul 2025) tightens EMIs and dealer working capital.
| Metric | Value |
|---|---|
| India GDP FY24 | ~7.2% |
| Repo rate Jul 2025 | 6.5% |
| Passenger car finance | ~60% |
| JLR rev FY2024 | ~£19bn |
What You See Is What You Get
Tata Motors PESTLE Analysis
The Tata Motors PESTLE analysis examines political, economic, social, technological, legal, and environmental factors shaping the company’s strategic risks and opportunities. It highlights regulatory shifts, market trends, innovation drivers, and sustainability pressures with clear implications for strategy. The preview shown here is the exact document you’ll receive after purchase—fully formatted and ready to use. Use it to inform investment or strategic decisions immediately.
Original: $10.00
-65%$10.00
$3.50Description
Skip the Research. Get the Strategy.
Unlock strategic clarity with our concise PESTLE Analysis of Tata Motors — three to five expert insights on how political shifts, economic cycles, technology adoption, social trends, and regulatory pressures shape its roadmap. Ideal for investors and strategists seeking actionable context. Purchase the full report to get the complete, editable analysis and immediate competitive advantage.
Political factors
Industrial policy and incentives
Production-linked incentives such as the ACC PLI (₹18,100 crore) and Make in India drive lower capex barriers and accelerate local EV/component manufacturing for Tata Motors. Access to central schemes like FAME-II (₹10,000 crore) and state EV subsidies affects vehicle roadmaps, pricing and total cost of ownership. Any reallocation or timeline shifts in these incentives can materially change IRR, so Tata Motors must align capex cadence with evolving policy windows.
Trade policy and tariffs
Import duties — India’s high basic customs duty on CBUs (~60%) versus much lower rates on components (0–15%) — drive Tata Motors toward local sourcing and affects margin recovery on premium models. Shifts in FTAs (eg. ongoing India-EU talks), stricter local-content rules or anti-dumping probes can force supply-chain reshuffles and nearshoring. Export competitiveness hinges on stable tariff corridors; modular platforms and multi-country sourcing hedge tariff volatility and protect EBITDA.
Geopolitical risk and supply chain security
Geopolitical tensions (Russia-Ukraine, US-China/Taiwan) threaten semiconductors, batteries and critical minerals; chips now account for roughly $300–500 of content per vehicle and battery raw materials are ~30–40% of pack cost. Sanctions and shipping-route volatility push lead times to 20–40 weeks and strain working capital. Diversifying suppliers and near-shoring key components mitigates exposure. Scenario planning is essential for high-value models and commercial fleets.
Public infrastructure and mobility policy
Rising public capex—central capital expenditure set at INR 10 lakh crore for 2024–25—plus PM Gati Shakti logistics and urban transport investments lift CV and bus demand; national and state electrification mandates and large public tenders increasingly determine order pipelines. Policy support for charging hubs and proposed hydrogen corridors shifts Tata Motors toward BEV/FCEV R&D, while close engagement with transport agencies secures long-duration fleet contracts.
- Capex: INR 10 lakh crore (2024–25)
- Bus electrification: public tenders driving fleet renewals
- Charging/hydrogen corridors: shapes tech investment
- Transport agency engagement: long-term contracts
Government procurement and defense
Defense and public-sector procurement provide countercyclical demand for Tata Motors, with FY 2024-25 procurement programs sustaining orders even during OEM cyclic downturns. Localization mandates and indigenization targets set in 2024 reshape product specs and supplier sourcing. Long approval cycles and heavy compliance inflate working capital needs, while strategic alignment with national defence roadmaps can deepen Tata Motors’ portfolio moat.
- Countercyclical demand: FY 2024-25 procurement
- Localization: indigenization-driven specs
- Working capital: long approvals, compliance
- Moat: alignment with defence roadmaps
Policy incentives and capex spur India EV/CV demand; localization and chip, battery cost risks
Policy incentives (ACC PLI ₹18,100 crore, FAME‑II ₹10,000 crore) and INR 10 lakh crore public capex (2024‑25) accelerate EV and CV demand but create timing risk for IRR. High CBU duties (~60%) push localization; India‑EU FTA talks and anti‑dumping actions can alter supply chains. Geopolitics raise chip lead times to 20–40 weeks; chips $300–500/vehicle, battery materials ~30–40% of pack cost.
| Metric | Value |
|---|---|
| ACC PLI | ₹18,100 cr |
| FAME‑II | ₹10,000 cr |
| Public capex (24‑25) | ₹10 lakh cr |
| CBU duty | ~60% |
| Chip content | $300–500/veh |
What is included in the product
Detailed Word Document
Explores how Political, Economic, Social, Technological, Environmental and Legal forces uniquely affect Tata Motors, using data-driven trends and region-specific examples to identify risks and opportunities. Designed for executives and investors with forward-looking insights for strategy and scenario planning.
Customizable Excel Spreadsheet
A clean, summarized Tata Motors PESTLE that’s visually segmented by category for quick interpretation, ideal for dropping into presentations or sharing across teams. Allows users to add region- or line-specific notes to support planning discussions on external risk and market positioning.
Economic factors
Macroeconomic growth and income elasticity
Passenger and commercial vehicle volumes closely follow GDP and capex cycles—India grew ~7.2% in FY24—so demand, replacement rates and fleet expansion swing with consumer confidence. Rising incomes and formalization have lifted premium mix and financing penetration to roughly 60% for passenger cars, while slowdowns compress replacement cycles; Tata Motors must balance high-volume models with margin-accretive trims and feature-rich variants.
Commodity and energy costs
Steel, aluminium, rubber and battery metals drive cost volatility for Tata Motors; lithium carbonate plunged about 80% from 2022 peaks to 2024 while global HRC steel eased roughly 15–25% in 2024, tightening margins and sourcing risks. Diesel levels and industrial electricity tariffs (circa ₹8–10/kWh) materially affect TCO for CVs and EVs. Pricing power and pass-through depend on competitive intensity and demand; long-term contracts and design-to-cost remain critical levers.
Currency movements and global exposure
INR-GBP volatility (GBP roughly averaging 103 INR in 2024) materially affects Tata Motors through higher costs for imported components and JLR revenues booked in pounds (JLR reported ~£19bn revenue in FY2024), creating translation and transaction risks that compress reported profitability. Localization of parts and export-driven natural hedges have partially offset FX swings, but management needs active hedging and regional pricing to protect margins and cashflows.
Interest rates and credit availability
Auto demand for Tata Motors is highly sensitive to retail finance and fleet leasing costs; India’s policy repo rate stood at 6.5% as of July 2025, which raises EMI burdens and can reduce affordability and dealer inventory financing.
- OEM captive finance sustains throughput
- Higher rates tighten dealer working capital
- Flexible incentives manage rate cycles
Inflation and consumer mix shifts
Sustained inflation (India CPI ~5.7% in FY2023-24; RBI target 4%±2%) nudges retail buyers toward value trims and the used-vehicle market, while premiumization endures where features/perceived value justify higher prices. Fleet operators increasingly optimize total cost of ownership, steering powertrain mix toward fuel-efficient or low-maintenance options. Agile trim planning and strict discount discipline are essential to protect Tata Motors margins.
- value-shift: buyers favor lower trims/used cars
- premiumization: persists if feature-value aligned
- fleet-TCO: drives powertrain choices
- margin-protection: agile trims + discount discipline
Policy incentives and capex spur India EV/CV demand; localization and chip, battery cost risks
India GDP ~7.2% in FY24 drives vehicle volumes; financing penetration ~60% for passenger cars, boosting premium mix but raising rate sensitivity. Input-cost swings (lithium -80% from 2022 to 2024; HRC steel down ~15–25% in 2024) compress margins. GBP avg ~103 INR (2024) and JLR revenue ~£19bn (FY2024) create FX risks. RBI repo 6.5% (Jul 2025) tightens EMIs and dealer working capital.
| Metric | Value |
|---|---|
| India GDP FY24 | ~7.2% |
| Repo rate Jul 2025 | 6.5% |
| Passenger car finance | ~60% |
| JLR rev FY2024 | ~£19bn |
What You See Is What You Get
Tata Motors PESTLE Analysis
The Tata Motors PESTLE analysis examines political, economic, social, technological, legal, and environmental factors shaping the company’s strategic risks and opportunities. It highlights regulatory shifts, market trends, innovation drivers, and sustainability pressures with clear implications for strategy. The preview shown here is the exact document you’ll receive after purchase—fully formatted and ready to use. Use it to inform investment or strategic decisions immediately.











