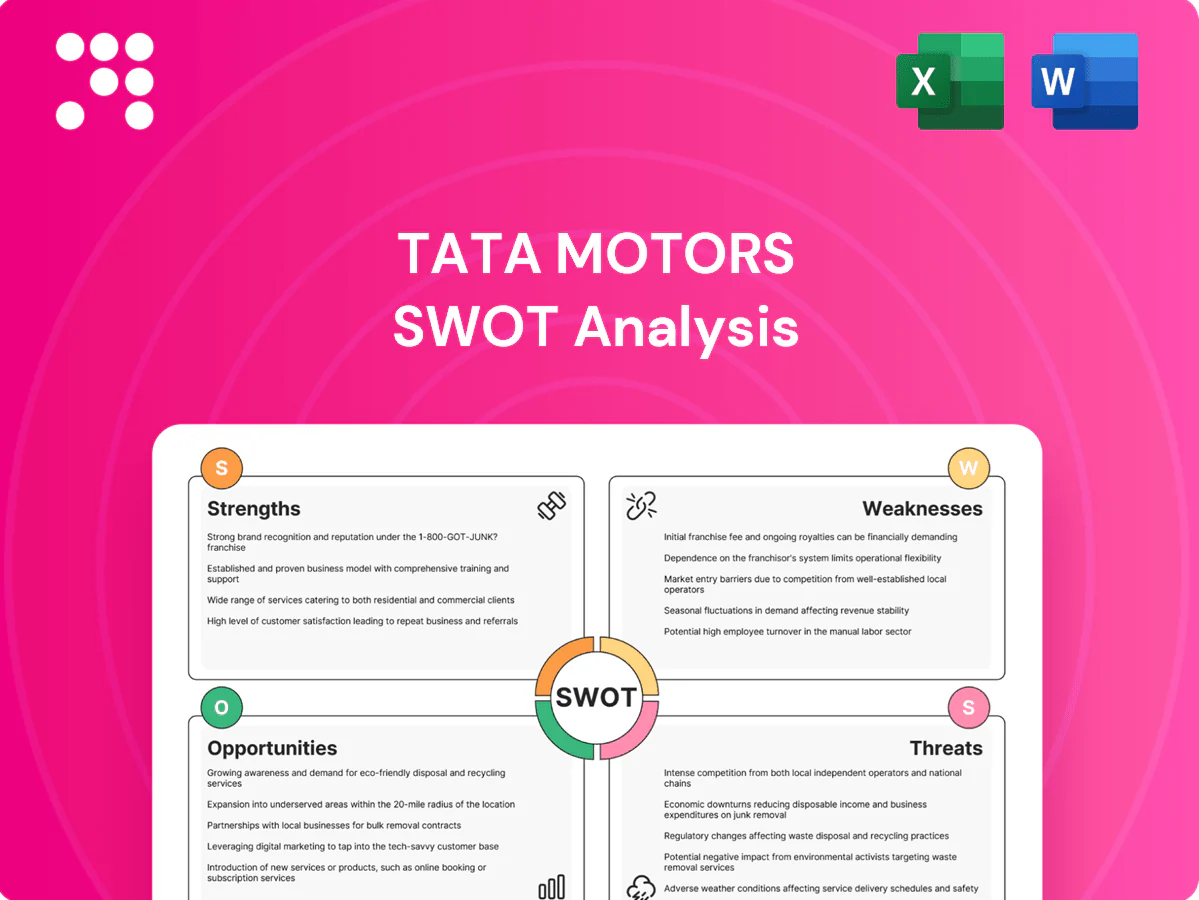
Tata Motors SWOT Analysis

Elevate Your Analysis with the Complete SWOT Report
Tata Motors combines strong domestic market leadership, a growing EV portfolio, and global JV exposure with challenges from margin pressure, legacy product cycles, and regulatory risks; opportunities include EV adoption and aftermarket growth while competition and supply-chain volatility remain threats. Want the full story behind the company’s strengths, risks, and growth drivers? Purchase the complete SWOT analysis to gain a professionally written, fully editable report.
Strengths

Diversified vehicle portfolio
Tata Motors spans passenger, commercial and defence vehicles, which balances cyclical exposures across segments. Its breadth enables cross-selling and platform sharing to lower development and production costs. Serving multiple price points and use-cases enhances resilience against demand shocks. Reliance on any single segment or geography is reduced, supported by exports to over 125 countries.
Global footprint with scale
Operations across India, the UK, Europe and other markets — selling in over 125 countries — provide demand diversity and reduce single‑market exposure. Scale across passenger and commercial vehicle businesses drives purchasing power and manufacturing efficiency through shared platforms and large volume sourcing. Broad distribution and service networks, including extensive dealer and service footprints in India and Europe, extend brand reach. This geographic spread improves resilience to regional downturns.

JLR premium technology edge
Access to Jaguar Land Rover, acquired by Tata Motors in 2008, gives Tata premium design, AWD systems and electrification know‑how—Jaguar launched the I‑PACE BEV in 2018 and Jaguar was pledged to be electric‑only from 2025. Technology transfer has enabled features and platforms to trickle down to mass models, improving perceived quality and pricing power in select segments. This supports faster rollouts of ADAS and EV tech across Tata's portfolio.

Tata Group ecosystem synergies
Tata Group synergies let Tata Motors leverage Tata Power's 6,000+ chargers (2024), Tata Group battery and software teams, and Tata Capital financing to offer integrated EV solutions that boost adoption and customer stickiness. This vertical integration lowers supply‑chain TCO and accelerates speed to market, supporting Tata Motors' ~70% India EV passenger‑car market share in FY24.
- Charging: Tata Power 6,000+ chargers (2024)
- Market share: ~70% India EV cars FY24
- Benefits: lower TCO, faster tech rollout
- Support: in‑house batteries, software, financing
Leadership in Indian CV market
Leadership in Indian CV market: over 40% market share in Indian commercial vehicles (2024) provides stable volumes and recurring aftermarket revenues; extensive network of ~3,000 dealers and service centres improves fleet uptime; scale advantages lower per-unit costs and position Tata Motors to capture infrastructure-led demand upcycles.
- MarketShare: over 40% (2024)
- Dealers: ~3,000+
- VolumeStability: strong truck & bus sales
- CostEdge: scale-driven competitiveness
Diversified automaker: exports to 125+ countries, dominant EV & CV shares
Tata Motors' diversified portfolio across PV, CV and defence plus exports to 125+ countries reduces single‑market risk and smooths cyclicality. Ownership of Jaguar Land Rover accelerates EV/ADAS tech transfer. Tata Group synergies (Tata Power chargers, in‑house batteries, financing) support market leadership. Strong Indian CV and EV shares sustain volumes and aftermarket revenues.
| Metric | Value (FY24/2024) |
|---|---|
| Exports reach | 125+ countries |
| India EV market share | ~70% (FY24) |
| India CV market share | >40% (2024) |
| Tata Power chargers | 6,000+ (2024) |
| Dealers/service centres | ~3,000+ |
What is included in the product
 Detailed Word Document
Delivers a strategic overview of Tata Motors’s internal strengths and weaknesses and external opportunities and threats, analyzing competitive position, growth drivers, operational gaps, and market risks that will shape the company’s future performance.

 Customizable Excel Spreadsheet
Provides a concise Tata Motors SWOT matrix for fast, visual strategy alignment, enabling executives to quickly spot strengths like EV leadership and weaknesses like debt, while addressing threats and opportunities for decisive action.
Weaknesses

Margin volatility
Exposure to cyclical commercial-vehicle and luxury-car segments drives wide earnings swings, with volumes and margins shifting sharply across cycles. Pricing pressure and discounting in key markets have periodically eroded profitability. A high fixed-cost base amplifies downturn impacts on operating margins. Currency moves and commodity-price volatility (notably steel and oil) add further earnings variability.
High capex and complexity
Multiple platforms and technologies require sustained investment, increasing Tata Motors capital intensity and R&D spend over successive cycles. Complex global operations—spanning India, UK and joint ventures—raise execution and coordination risk, making program management harder. Program delays or quality issues can inflate costs and erode margins. High capex requirements squeeze free cash flow during demand slowdowns.

Quality and recall risks
Past quality issues have dented Tata Motors’ brand trust and can depress residual values in used-vehicle markets. Recalls increase warranty and service costs and divert senior management focus from product and growth initiatives. Inconsistent supplier quality elevates field-failure risk across ICE and EV lines. Maintaining continuous process discipline and stricter supplier controls is essential to limit financial and reputational exposure.

Dependence on key markets
India and a few international markets drive the majority of Tata Motors volumes and earnings, so demand shocks there materially swing consolidated results; regulatory or tax changes (import duties, emission norms) can have outsized P&L effects. JLR returned to profit in FY2023–24, underscoring concentration risk.
- Concentration: India + select intl markets dominate volumes
- Demand shocks: material impact on revenue/profits
- Regulatory/tax sensitivity: outsized P&L effects
- Limited diversification despite JLR FY2023–24 recovery
Working capital sensitivity
Working capital sensitivity: inventory and receivables can build during demand slowdowns, lengthening cash conversion; weak dealer balance sheets reduce sell-through and delay collections; timing of aftermarket parts sales creates quarter-to-quarter cash volatility; stress periods increase reliance on external financing to bridge working capital gaps.
- Inventory buildup
- Dealer solvency risk
- Aftermarket timing
- Higher financing need
Premium automaker's return to profit masks volatile earnings, high capex and market risk
Exposure to cyclical CV and luxury segments drives wide earnings swings; JLR returned to profit in FY2023–24, underscoring volatility. High fixed costs and heavy capex/R&D needs compress free cash flow in downturns. Past quality/recall issues hurt brand trust and resale values, raising warranty costs. India and a few markets account for the majority of volumes (>60%), concentrating demand risk.
| Metric | Latest (FY2023–24) |
|---|---|
| JLR status | Returned to profit (FY2023–24) |
| Market concentration | India + select intl >60% volumes |
Preview Before You Purchase
Tata Motors SWOT Analysis
This is the actual SWOT analysis document you’ll receive upon purchase—no surprises, just professional quality. The preview below is taken directly from the full SWOT report you'll get, covering Tata Motors' strengths, weaknesses, opportunities and threats in a clear, actionable format. Purchase unlocks the complete, editable file ready for download and use in presentations or strategic planning.

Elevate Your Analysis with the Complete SWOT Report
Tata Motors combines strong domestic market leadership, a growing EV portfolio, and global JV exposure with challenges from margin pressure, legacy product cycles, and regulatory risks; opportunities include EV adoption and aftermarket growth while competition and supply-chain volatility remain threats. Want the full story behind the company’s strengths, risks, and growth drivers? Purchase the complete SWOT analysis to gain a professionally written, fully editable report.
Strengths
Diversified vehicle portfolio
Tata Motors spans passenger, commercial and defence vehicles, which balances cyclical exposures across segments. Its breadth enables cross-selling and platform sharing to lower development and production costs. Serving multiple price points and use-cases enhances resilience against demand shocks. Reliance on any single segment or geography is reduced, supported by exports to over 125 countries.
Global footprint with scale
Operations across India, the UK, Europe and other markets — selling in over 125 countries — provide demand diversity and reduce single‑market exposure. Scale across passenger and commercial vehicle businesses drives purchasing power and manufacturing efficiency through shared platforms and large volume sourcing. Broad distribution and service networks, including extensive dealer and service footprints in India and Europe, extend brand reach. This geographic spread improves resilience to regional downturns.
JLR premium technology edge
Access to Jaguar Land Rover, acquired by Tata Motors in 2008, gives Tata premium design, AWD systems and electrification know‑how—Jaguar launched the I‑PACE BEV in 2018 and Jaguar was pledged to be electric‑only from 2025. Technology transfer has enabled features and platforms to trickle down to mass models, improving perceived quality and pricing power in select segments. This supports faster rollouts of ADAS and EV tech across Tata's portfolio.
Tata Group ecosystem synergies
Tata Group synergies let Tata Motors leverage Tata Power's 6,000+ chargers (2024), Tata Group battery and software teams, and Tata Capital financing to offer integrated EV solutions that boost adoption and customer stickiness. This vertical integration lowers supply‑chain TCO and accelerates speed to market, supporting Tata Motors' ~70% India EV passenger‑car market share in FY24.
- Charging: Tata Power 6,000+ chargers (2024)
- Market share: ~70% India EV cars FY24
- Benefits: lower TCO, faster tech rollout
- Support: in‑house batteries, software, financing
Leadership in Indian CV market
Leadership in Indian CV market: over 40% market share in Indian commercial vehicles (2024) provides stable volumes and recurring aftermarket revenues; extensive network of ~3,000 dealers and service centres improves fleet uptime; scale advantages lower per-unit costs and position Tata Motors to capture infrastructure-led demand upcycles.
- MarketShare: over 40% (2024)
- Dealers: ~3,000+
- VolumeStability: strong truck & bus sales
- CostEdge: scale-driven competitiveness
Diversified automaker: exports to 125+ countries, dominant EV & CV shares
Tata Motors' diversified portfolio across PV, CV and defence plus exports to 125+ countries reduces single‑market risk and smooths cyclicality. Ownership of Jaguar Land Rover accelerates EV/ADAS tech transfer. Tata Group synergies (Tata Power chargers, in‑house batteries, financing) support market leadership. Strong Indian CV and EV shares sustain volumes and aftermarket revenues.
| Metric | Value (FY24/2024) |
|---|---|
| Exports reach | 125+ countries |
| India EV market share | ~70% (FY24) |
| India CV market share | >40% (2024) |
| Tata Power chargers | 6,000+ (2024) |
| Dealers/service centres | ~3,000+ |
What is included in the product
Detailed Word Document
Delivers a strategic overview of Tata Motors’s internal strengths and weaknesses and external opportunities and threats, analyzing competitive position, growth drivers, operational gaps, and market risks that will shape the company’s future performance.
Customizable Excel Spreadsheet
Provides a concise Tata Motors SWOT matrix for fast, visual strategy alignment, enabling executives to quickly spot strengths like EV leadership and weaknesses like debt, while addressing threats and opportunities for decisive action.
Weaknesses
Margin volatility
Exposure to cyclical commercial-vehicle and luxury-car segments drives wide earnings swings, with volumes and margins shifting sharply across cycles. Pricing pressure and discounting in key markets have periodically eroded profitability. A high fixed-cost base amplifies downturn impacts on operating margins. Currency moves and commodity-price volatility (notably steel and oil) add further earnings variability.
High capex and complexity
Multiple platforms and technologies require sustained investment, increasing Tata Motors capital intensity and R&D spend over successive cycles. Complex global operations—spanning India, UK and joint ventures—raise execution and coordination risk, making program management harder. Program delays or quality issues can inflate costs and erode margins. High capex requirements squeeze free cash flow during demand slowdowns.
Quality and recall risks
Past quality issues have dented Tata Motors’ brand trust and can depress residual values in used-vehicle markets. Recalls increase warranty and service costs and divert senior management focus from product and growth initiatives. Inconsistent supplier quality elevates field-failure risk across ICE and EV lines. Maintaining continuous process discipline and stricter supplier controls is essential to limit financial and reputational exposure.
Dependence on key markets
India and a few international markets drive the majority of Tata Motors volumes and earnings, so demand shocks there materially swing consolidated results; regulatory or tax changes (import duties, emission norms) can have outsized P&L effects. JLR returned to profit in FY2023–24, underscoring concentration risk.
- Concentration: India + select intl markets dominate volumes
- Demand shocks: material impact on revenue/profits
- Regulatory/tax sensitivity: outsized P&L effects
- Limited diversification despite JLR FY2023–24 recovery
Working capital sensitivity
Working capital sensitivity: inventory and receivables can build during demand slowdowns, lengthening cash conversion; weak dealer balance sheets reduce sell-through and delay collections; timing of aftermarket parts sales creates quarter-to-quarter cash volatility; stress periods increase reliance on external financing to bridge working capital gaps.
- Inventory buildup
- Dealer solvency risk
- Aftermarket timing
- Higher financing need
Premium automaker's return to profit masks volatile earnings, high capex and market risk
Exposure to cyclical CV and luxury segments drives wide earnings swings; JLR returned to profit in FY2023–24, underscoring volatility. High fixed costs and heavy capex/R&D needs compress free cash flow in downturns. Past quality/recall issues hurt brand trust and resale values, raising warranty costs. India and a few markets account for the majority of volumes (>60%), concentrating demand risk.
| Metric | Latest (FY2023–24) |
|---|---|
| JLR status | Returned to profit (FY2023–24) |
| Market concentration | India + select intl >60% volumes |
Preview Before You Purchase
Tata Motors SWOT Analysis
This is the actual SWOT analysis document you’ll receive upon purchase—no surprises, just professional quality. The preview below is taken directly from the full SWOT report you'll get, covering Tata Motors' strengths, weaknesses, opportunities and threats in a clear, actionable format. Purchase unlocks the complete, editable file ready for download and use in presentations or strategic planning.
Description
Elevate Your Analysis with the Complete SWOT Report
Tata Motors combines strong domestic market leadership, a growing EV portfolio, and global JV exposure with challenges from margin pressure, legacy product cycles, and regulatory risks; opportunities include EV adoption and aftermarket growth while competition and supply-chain volatility remain threats. Want the full story behind the company’s strengths, risks, and growth drivers? Purchase the complete SWOT analysis to gain a professionally written, fully editable report.
Strengths
Diversified vehicle portfolio
Tata Motors spans passenger, commercial and defence vehicles, which balances cyclical exposures across segments. Its breadth enables cross-selling and platform sharing to lower development and production costs. Serving multiple price points and use-cases enhances resilience against demand shocks. Reliance on any single segment or geography is reduced, supported by exports to over 125 countries.
Global footprint with scale
Operations across India, the UK, Europe and other markets — selling in over 125 countries — provide demand diversity and reduce single‑market exposure. Scale across passenger and commercial vehicle businesses drives purchasing power and manufacturing efficiency through shared platforms and large volume sourcing. Broad distribution and service networks, including extensive dealer and service footprints in India and Europe, extend brand reach. This geographic spread improves resilience to regional downturns.
JLR premium technology edge
Access to Jaguar Land Rover, acquired by Tata Motors in 2008, gives Tata premium design, AWD systems and electrification know‑how—Jaguar launched the I‑PACE BEV in 2018 and Jaguar was pledged to be electric‑only from 2025. Technology transfer has enabled features and platforms to trickle down to mass models, improving perceived quality and pricing power in select segments. This supports faster rollouts of ADAS and EV tech across Tata's portfolio.
Tata Group ecosystem synergies
Tata Group synergies let Tata Motors leverage Tata Power's 6,000+ chargers (2024), Tata Group battery and software teams, and Tata Capital financing to offer integrated EV solutions that boost adoption and customer stickiness. This vertical integration lowers supply‑chain TCO and accelerates speed to market, supporting Tata Motors' ~70% India EV passenger‑car market share in FY24.
- Charging: Tata Power 6,000+ chargers (2024)
- Market share: ~70% India EV cars FY24
- Benefits: lower TCO, faster tech rollout
- Support: in‑house batteries, software, financing
Leadership in Indian CV market
Leadership in Indian CV market: over 40% market share in Indian commercial vehicles (2024) provides stable volumes and recurring aftermarket revenues; extensive network of ~3,000 dealers and service centres improves fleet uptime; scale advantages lower per-unit costs and position Tata Motors to capture infrastructure-led demand upcycles.
- MarketShare: over 40% (2024)
- Dealers: ~3,000+
- VolumeStability: strong truck & bus sales
- CostEdge: scale-driven competitiveness
Diversified automaker: exports to 125+ countries, dominant EV & CV shares
Tata Motors' diversified portfolio across PV, CV and defence plus exports to 125+ countries reduces single‑market risk and smooths cyclicality. Ownership of Jaguar Land Rover accelerates EV/ADAS tech transfer. Tata Group synergies (Tata Power chargers, in‑house batteries, financing) support market leadership. Strong Indian CV and EV shares sustain volumes and aftermarket revenues.
| Metric | Value (FY24/2024) |
|---|---|
| Exports reach | 125+ countries |
| India EV market share | ~70% (FY24) |
| India CV market share | >40% (2024) |
| Tata Power chargers | 6,000+ (2024) |
| Dealers/service centres | ~3,000+ |
What is included in the product
Detailed Word Document
Delivers a strategic overview of Tata Motors’s internal strengths and weaknesses and external opportunities and threats, analyzing competitive position, growth drivers, operational gaps, and market risks that will shape the company’s future performance.
Customizable Excel Spreadsheet
Provides a concise Tata Motors SWOT matrix for fast, visual strategy alignment, enabling executives to quickly spot strengths like EV leadership and weaknesses like debt, while addressing threats and opportunities for decisive action.
Weaknesses
Margin volatility
Exposure to cyclical commercial-vehicle and luxury-car segments drives wide earnings swings, with volumes and margins shifting sharply across cycles. Pricing pressure and discounting in key markets have periodically eroded profitability. A high fixed-cost base amplifies downturn impacts on operating margins. Currency moves and commodity-price volatility (notably steel and oil) add further earnings variability.
High capex and complexity
Multiple platforms and technologies require sustained investment, increasing Tata Motors capital intensity and R&D spend over successive cycles. Complex global operations—spanning India, UK and joint ventures—raise execution and coordination risk, making program management harder. Program delays or quality issues can inflate costs and erode margins. High capex requirements squeeze free cash flow during demand slowdowns.
Quality and recall risks
Past quality issues have dented Tata Motors’ brand trust and can depress residual values in used-vehicle markets. Recalls increase warranty and service costs and divert senior management focus from product and growth initiatives. Inconsistent supplier quality elevates field-failure risk across ICE and EV lines. Maintaining continuous process discipline and stricter supplier controls is essential to limit financial and reputational exposure.
Dependence on key markets
India and a few international markets drive the majority of Tata Motors volumes and earnings, so demand shocks there materially swing consolidated results; regulatory or tax changes (import duties, emission norms) can have outsized P&L effects. JLR returned to profit in FY2023–24, underscoring concentration risk.
- Concentration: India + select intl markets dominate volumes
- Demand shocks: material impact on revenue/profits
- Regulatory/tax sensitivity: outsized P&L effects
- Limited diversification despite JLR FY2023–24 recovery
Working capital sensitivity
Working capital sensitivity: inventory and receivables can build during demand slowdowns, lengthening cash conversion; weak dealer balance sheets reduce sell-through and delay collections; timing of aftermarket parts sales creates quarter-to-quarter cash volatility; stress periods increase reliance on external financing to bridge working capital gaps.
- Inventory buildup
- Dealer solvency risk
- Aftermarket timing
- Higher financing need
Premium automaker's return to profit masks volatile earnings, high capex and market risk
Exposure to cyclical CV and luxury segments drives wide earnings swings; JLR returned to profit in FY2023–24, underscoring volatility. High fixed costs and heavy capex/R&D needs compress free cash flow in downturns. Past quality/recall issues hurt brand trust and resale values, raising warranty costs. India and a few markets account for the majority of volumes (>60%), concentrating demand risk.
| Metric | Latest (FY2023–24) |
|---|---|
| JLR status | Returned to profit (FY2023–24) |
| Market concentration | India + select intl >60% volumes |
Preview Before You Purchase
Tata Motors SWOT Analysis
This is the actual SWOT analysis document you’ll receive upon purchase—no surprises, just professional quality. The preview below is taken directly from the full SWOT report you'll get, covering Tata Motors' strengths, weaknesses, opportunities and threats in a clear, actionable format. Purchase unlocks the complete, editable file ready for download and use in presentations or strategic planning.











