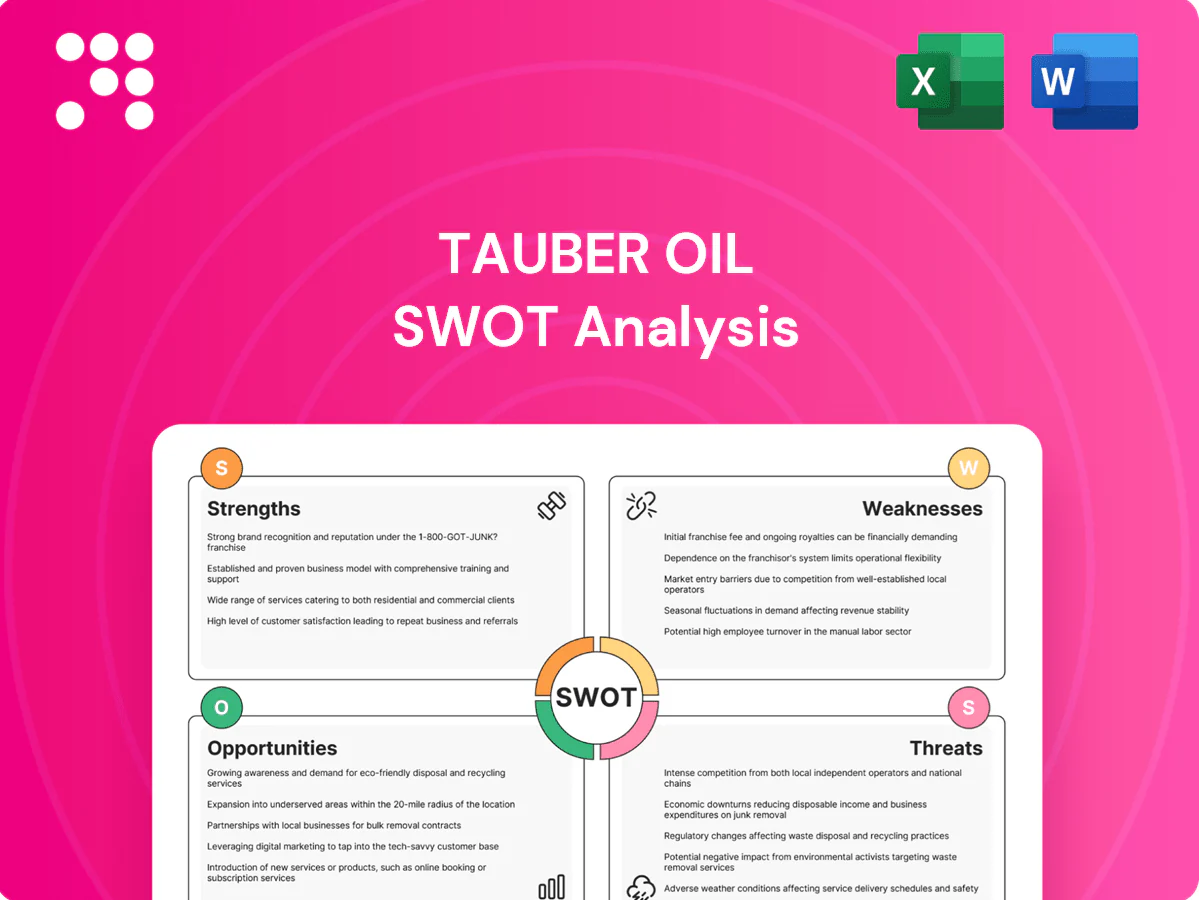
Tauber Oil SWOT Analysis

Dive Deeper Into the Company’s Strategic Blueprint
Tauber Oil's SWOT analysis highlights resilient upstream assets, cost-efficiency gains, and exposure to volatile oil prices and regulatory risks. Competitive positioning and supply-chain strengths are weighed against environmental and capital constraints. Want the full story behind strengths, risks, and growth drivers? Purchase the complete SWOT analysis for a professionally written, editable report.
Strengths

Diverse energy product portfolio
Tauber Oil’s offering of crude, refined products and petrochemicals spreads risk across segments as global oil demand reached about 101.7 million barrels/day in 2024 (IEA), reducing exposure to single-cycle downturns. Product optionality enables grade and regional arbitrage, improving margin capture when regional cracks diverge. Breadth deepens relevance to upstream producers and downstream users, supporting volume resilience during market shifts.
Logistics and supply chain expertise
Coordinating procurement, scheduling and delivery drives reliability and cost control across flows comparable to U.S. crude output (~12.5 million b/d in 2024), reducing stockouts and turnaround times. Mastery of terminals, pipelines, barges, rail and trucking cuts bottlenecks and demurrage exposure. Operational know-how lowers per-barrel handling costs and creates a service edge over pure traders.

Strong producer–end-user connectivity
Deep producer–end-user relationships secure supply and offtake, improving utilization and margins by enabling steady flows within a market consuming roughly 101.6 million barrels per day (IEA 2023). Repeat business and trust shorten negotiation cycles, accelerating deal closure and cash conversion. Network effects match molecules to optimal markets, lifting realized prices. This connectivity enhances information flow and deal origination.

Multi-modal transportation capability
Multi-modal transportation capability gives Tauber Oil routing flexibility and resilience, enabling rapid mode switches around outages, severe weather, or regional price spreads; trucks, rail, and pipelines can be reallocated to optimize delivered cost and timing. This versatility supports improved on-time performance and higher customer satisfaction, leveraging industry modal diversity (trucks move ~72% of US freight by tonnage, BTS 2022).
- Routing flexibility
- Rapid outage/weather response
- Cost/timing optimization via mode switching
- Better on-time performance & customer satisfaction
Market intelligence and trading agility
Real-time insights on basis, cracks and freight let Tauber Oil reposition rapidly; during 2024 Brent averaged about 89 USD/bbl, increasing the value of nimble capture of spreads. Short decision cycles seize transient spreads and reduce exposure, while data-driven dispatch optimizes liftings and deliveries, protecting margins in volatile markets.
- Real-time data = faster spread capture
- Short cycles minimize market risk
- Dispatch analytics improve load efficiency
Integrated product mix and multimodal logistics drive margin resilience
Integrated product mix, multi-modal logistics and deep producer–buyer relationships give Tauber Oil margin resilience and volume stability amid ~101.7 million b/d global oil demand (IEA 2024). Operational mastery reduces per-barrel handling and demurrage versus pure traders, while real-time data capture boosts spread capture during volatile Brent (~89 USD/bbl in 2024). Routing flexibility and network effects shorten cycles and improve utilization.
| Metric | 2024 | Relevance |
|---|---|---|
| Global oil demand | 101.7 m b/d | Market size for diversification |
| US crude output | 12.5 m b/d | Logistics benchmark |
| Brent avg | 89 USD/bbl | Value of nimble spread capture |
What is included in the product
 Detailed Word Document
Delivers a strategic overview of Tauber Oil’s internal and external business factors, outlining strengths, weaknesses, opportunities, and threats to assess its competitive position and guide strategic decisions.

 Customizable Excel Spreadsheet
Provides a clear, editable SWOT matrix for Tauber Oil, enabling rapid identification of strategic risks and opportunities and streamlining stakeholder alignment; ideal for executives needing a quick snapshot to update plans and make fast, informed decisions.
Weaknesses

Thin margins in commodity distribution
Wholesale commodity distribution earns low unit margins—industry wholesale fuel distribution gross margins commonly run below 5%, so profitability hinges on volume, efficiency and spread capture. Small execution errors, logistics or hedging losses can erase single-digit margins and swing EBITDA materially. Scale disadvantages—higher per-unit overheads and weaker supply clout—amplify pressure on returns.
Counterparty and credit exposure
Trading and physical deliveries extend receivables and performance risk, increasing Tauber Oil's exposure to customer defaults and delayed payments that can quickly strain liquidity. Hedging programs reduce market risk but do not eliminate counterparty credit exposure or settlement risk. Robust credit controls and collateral management are essential to contain losses but add operational cost and capital strain.

Limited consumer brand visibility
As a B2B marketer Tauber Oil has minimal end-user brand equity, meaning retail brand pull is weak and pricing power versus integrated majors is constrained. Industry data show branded fuel often commands only a 3–6 cents/gal premium (NACS 2023), limiting margin uplift from consumer loyalty. Low switching costs in commodity fuel markets make customers price-sensitive and prone to churn. Tauber must deepen account relationships and service differentiation to offset brand deficits.

High working capital intensity
Purchasing, storing and transporting hydrocarbons ties up large capital—Brent at ~$83/bbl (July 2025) means inventories quickly reach tens of millions in working capital for mid‑sized traders. Margin calls and volatile inventory swings repeatedly elevate cash needs, while higher financing costs in late 2024–2025 compressed trading spreads. Liquidity management is therefore a continuous operational focus.
- High stock value: Brent ~83/bbl (Jul 2025)
- Margin volatility: frequent cash calls
- Financing pressure: tighter spreads 2024–25
- Operational risk: continuous liquidity focus
Complex regulatory compliance load
Multi-jurisdictional environmental, safety and trade rules force Tauber Oil into high compliance costs and complex processes; documentation for custody transfer and quality control adds measurable overhead and staff hours. Non-compliance risks fines often in the millions and operational delays that hit throughput. This burden rises with product and geographic breadth.
- High multi-jurisdictional compliance costs
- Custody transfer and quality documentation overhead
- Fines and delays from non-compliance (often million-dollar scale)
- Costs scale with product and geographic expansion
Sub-5% margins | Brent $83/bbl | Tens $M WC
Thin wholesale margins (<5%) make profitability volume‑sensitive; small logistics or hedging losses can wipe EBITDA. Brent ~83/bbl (Jul 2025) drives inventory WC into tens of millions and frequent margin calls. Branded premium only 3–6¢/gal (NACS 2023), limiting pricing power. Multi‑jurisdiction compliance and potential million‑dollar fines raise fixed costs and operational risk.
| Metric | Value |
|---|---|
| Gross margin | <5% |
| Brent | $83/bbl (Jul 2025) |
| Branded premium | 3–6¢/gal |
| Inventory WC | Tens of $M |
| Compliance fines | Often $M+ |
Preview the Actual Deliverable
Tauber Oil SWOT Analysis
This is the actual Tauber Oil SWOT analysis document you’ll receive upon purchase—no surprises, just professional quality. The preview below is taken directly from the full report; buying unlocks the complete, editable version. You’re viewing a live excerpt of the real file, ready to use in strategy or valuation work.

Dive Deeper Into the Company’s Strategic Blueprint
Tauber Oil's SWOT analysis highlights resilient upstream assets, cost-efficiency gains, and exposure to volatile oil prices and regulatory risks. Competitive positioning and supply-chain strengths are weighed against environmental and capital constraints. Want the full story behind strengths, risks, and growth drivers? Purchase the complete SWOT analysis for a professionally written, editable report.
Strengths
Diverse energy product portfolio
Tauber Oil’s offering of crude, refined products and petrochemicals spreads risk across segments as global oil demand reached about 101.7 million barrels/day in 2024 (IEA), reducing exposure to single-cycle downturns. Product optionality enables grade and regional arbitrage, improving margin capture when regional cracks diverge. Breadth deepens relevance to upstream producers and downstream users, supporting volume resilience during market shifts.
Logistics and supply chain expertise
Coordinating procurement, scheduling and delivery drives reliability and cost control across flows comparable to U.S. crude output (~12.5 million b/d in 2024), reducing stockouts and turnaround times. Mastery of terminals, pipelines, barges, rail and trucking cuts bottlenecks and demurrage exposure. Operational know-how lowers per-barrel handling costs and creates a service edge over pure traders.
Strong producer–end-user connectivity
Deep producer–end-user relationships secure supply and offtake, improving utilization and margins by enabling steady flows within a market consuming roughly 101.6 million barrels per day (IEA 2023). Repeat business and trust shorten negotiation cycles, accelerating deal closure and cash conversion. Network effects match molecules to optimal markets, lifting realized prices. This connectivity enhances information flow and deal origination.
Multi-modal transportation capability
Multi-modal transportation capability gives Tauber Oil routing flexibility and resilience, enabling rapid mode switches around outages, severe weather, or regional price spreads; trucks, rail, and pipelines can be reallocated to optimize delivered cost and timing. This versatility supports improved on-time performance and higher customer satisfaction, leveraging industry modal diversity (trucks move ~72% of US freight by tonnage, BTS 2022).
- Routing flexibility
- Rapid outage/weather response
- Cost/timing optimization via mode switching
- Better on-time performance & customer satisfaction
Market intelligence and trading agility
Real-time insights on basis, cracks and freight let Tauber Oil reposition rapidly; during 2024 Brent averaged about 89 USD/bbl, increasing the value of nimble capture of spreads. Short decision cycles seize transient spreads and reduce exposure, while data-driven dispatch optimizes liftings and deliveries, protecting margins in volatile markets.
- Real-time data = faster spread capture
- Short cycles minimize market risk
- Dispatch analytics improve load efficiency
Integrated product mix and multimodal logistics drive margin resilience
Integrated product mix, multi-modal logistics and deep producer–buyer relationships give Tauber Oil margin resilience and volume stability amid ~101.7 million b/d global oil demand (IEA 2024). Operational mastery reduces per-barrel handling and demurrage versus pure traders, while real-time data capture boosts spread capture during volatile Brent (~89 USD/bbl in 2024). Routing flexibility and network effects shorten cycles and improve utilization.
| Metric | 2024 | Relevance |
|---|---|---|
| Global oil demand | 101.7 m b/d | Market size for diversification |
| US crude output | 12.5 m b/d | Logistics benchmark |
| Brent avg | 89 USD/bbl | Value of nimble spread capture |
What is included in the product
Detailed Word Document
Delivers a strategic overview of Tauber Oil’s internal and external business factors, outlining strengths, weaknesses, opportunities, and threats to assess its competitive position and guide strategic decisions.
Customizable Excel Spreadsheet
Provides a clear, editable SWOT matrix for Tauber Oil, enabling rapid identification of strategic risks and opportunities and streamlining stakeholder alignment; ideal for executives needing a quick snapshot to update plans and make fast, informed decisions.
Weaknesses
Thin margins in commodity distribution
Wholesale commodity distribution earns low unit margins—industry wholesale fuel distribution gross margins commonly run below 5%, so profitability hinges on volume, efficiency and spread capture. Small execution errors, logistics or hedging losses can erase single-digit margins and swing EBITDA materially. Scale disadvantages—higher per-unit overheads and weaker supply clout—amplify pressure on returns.
Counterparty and credit exposure
Trading and physical deliveries extend receivables and performance risk, increasing Tauber Oil's exposure to customer defaults and delayed payments that can quickly strain liquidity. Hedging programs reduce market risk but do not eliminate counterparty credit exposure or settlement risk. Robust credit controls and collateral management are essential to contain losses but add operational cost and capital strain.
Limited consumer brand visibility
As a B2B marketer Tauber Oil has minimal end-user brand equity, meaning retail brand pull is weak and pricing power versus integrated majors is constrained. Industry data show branded fuel often commands only a 3–6 cents/gal premium (NACS 2023), limiting margin uplift from consumer loyalty. Low switching costs in commodity fuel markets make customers price-sensitive and prone to churn. Tauber must deepen account relationships and service differentiation to offset brand deficits.
High working capital intensity
Purchasing, storing and transporting hydrocarbons ties up large capital—Brent at ~$83/bbl (July 2025) means inventories quickly reach tens of millions in working capital for mid‑sized traders. Margin calls and volatile inventory swings repeatedly elevate cash needs, while higher financing costs in late 2024–2025 compressed trading spreads. Liquidity management is therefore a continuous operational focus.
- High stock value: Brent ~83/bbl (Jul 2025)
- Margin volatility: frequent cash calls
- Financing pressure: tighter spreads 2024–25
- Operational risk: continuous liquidity focus
Complex regulatory compliance load
Multi-jurisdictional environmental, safety and trade rules force Tauber Oil into high compliance costs and complex processes; documentation for custody transfer and quality control adds measurable overhead and staff hours. Non-compliance risks fines often in the millions and operational delays that hit throughput. This burden rises with product and geographic breadth.
- High multi-jurisdictional compliance costs
- Custody transfer and quality documentation overhead
- Fines and delays from non-compliance (often million-dollar scale)
- Costs scale with product and geographic expansion
Sub-5% margins | Brent $83/bbl | Tens $M WC
Thin wholesale margins (<5%) make profitability volume‑sensitive; small logistics or hedging losses can wipe EBITDA. Brent ~83/bbl (Jul 2025) drives inventory WC into tens of millions and frequent margin calls. Branded premium only 3–6¢/gal (NACS 2023), limiting pricing power. Multi‑jurisdiction compliance and potential million‑dollar fines raise fixed costs and operational risk.
| Metric | Value |
|---|---|
| Gross margin | <5% |
| Brent | $83/bbl (Jul 2025) |
| Branded premium | 3–6¢/gal |
| Inventory WC | Tens of $M |
| Compliance fines | Often $M+ |
Preview the Actual Deliverable
Tauber Oil SWOT Analysis
This is the actual Tauber Oil SWOT analysis document you’ll receive upon purchase—no surprises, just professional quality. The preview below is taken directly from the full report; buying unlocks the complete, editable version. You’re viewing a live excerpt of the real file, ready to use in strategy or valuation work.
Original: $10.00
-65%$10.00
$3.50Description
Dive Deeper Into the Company’s Strategic Blueprint
Tauber Oil's SWOT analysis highlights resilient upstream assets, cost-efficiency gains, and exposure to volatile oil prices and regulatory risks. Competitive positioning and supply-chain strengths are weighed against environmental and capital constraints. Want the full story behind strengths, risks, and growth drivers? Purchase the complete SWOT analysis for a professionally written, editable report.
Strengths
Diverse energy product portfolio
Tauber Oil’s offering of crude, refined products and petrochemicals spreads risk across segments as global oil demand reached about 101.7 million barrels/day in 2024 (IEA), reducing exposure to single-cycle downturns. Product optionality enables grade and regional arbitrage, improving margin capture when regional cracks diverge. Breadth deepens relevance to upstream producers and downstream users, supporting volume resilience during market shifts.
Logistics and supply chain expertise
Coordinating procurement, scheduling and delivery drives reliability and cost control across flows comparable to U.S. crude output (~12.5 million b/d in 2024), reducing stockouts and turnaround times. Mastery of terminals, pipelines, barges, rail and trucking cuts bottlenecks and demurrage exposure. Operational know-how lowers per-barrel handling costs and creates a service edge over pure traders.
Strong producer–end-user connectivity
Deep producer–end-user relationships secure supply and offtake, improving utilization and margins by enabling steady flows within a market consuming roughly 101.6 million barrels per day (IEA 2023). Repeat business and trust shorten negotiation cycles, accelerating deal closure and cash conversion. Network effects match molecules to optimal markets, lifting realized prices. This connectivity enhances information flow and deal origination.
Multi-modal transportation capability
Multi-modal transportation capability gives Tauber Oil routing flexibility and resilience, enabling rapid mode switches around outages, severe weather, or regional price spreads; trucks, rail, and pipelines can be reallocated to optimize delivered cost and timing. This versatility supports improved on-time performance and higher customer satisfaction, leveraging industry modal diversity (trucks move ~72% of US freight by tonnage, BTS 2022).
- Routing flexibility
- Rapid outage/weather response
- Cost/timing optimization via mode switching
- Better on-time performance & customer satisfaction
Market intelligence and trading agility
Real-time insights on basis, cracks and freight let Tauber Oil reposition rapidly; during 2024 Brent averaged about 89 USD/bbl, increasing the value of nimble capture of spreads. Short decision cycles seize transient spreads and reduce exposure, while data-driven dispatch optimizes liftings and deliveries, protecting margins in volatile markets.
- Real-time data = faster spread capture
- Short cycles minimize market risk
- Dispatch analytics improve load efficiency
Integrated product mix and multimodal logistics drive margin resilience
Integrated product mix, multi-modal logistics and deep producer–buyer relationships give Tauber Oil margin resilience and volume stability amid ~101.7 million b/d global oil demand (IEA 2024). Operational mastery reduces per-barrel handling and demurrage versus pure traders, while real-time data capture boosts spread capture during volatile Brent (~89 USD/bbl in 2024). Routing flexibility and network effects shorten cycles and improve utilization.
| Metric | 2024 | Relevance |
|---|---|---|
| Global oil demand | 101.7 m b/d | Market size for diversification |
| US crude output | 12.5 m b/d | Logistics benchmark |
| Brent avg | 89 USD/bbl | Value of nimble spread capture |
What is included in the product
Detailed Word Document
Delivers a strategic overview of Tauber Oil’s internal and external business factors, outlining strengths, weaknesses, opportunities, and threats to assess its competitive position and guide strategic decisions.
Customizable Excel Spreadsheet
Provides a clear, editable SWOT matrix for Tauber Oil, enabling rapid identification of strategic risks and opportunities and streamlining stakeholder alignment; ideal for executives needing a quick snapshot to update plans and make fast, informed decisions.
Weaknesses
Thin margins in commodity distribution
Wholesale commodity distribution earns low unit margins—industry wholesale fuel distribution gross margins commonly run below 5%, so profitability hinges on volume, efficiency and spread capture. Small execution errors, logistics or hedging losses can erase single-digit margins and swing EBITDA materially. Scale disadvantages—higher per-unit overheads and weaker supply clout—amplify pressure on returns.
Counterparty and credit exposure
Trading and physical deliveries extend receivables and performance risk, increasing Tauber Oil's exposure to customer defaults and delayed payments that can quickly strain liquidity. Hedging programs reduce market risk but do not eliminate counterparty credit exposure or settlement risk. Robust credit controls and collateral management are essential to contain losses but add operational cost and capital strain.
Limited consumer brand visibility
As a B2B marketer Tauber Oil has minimal end-user brand equity, meaning retail brand pull is weak and pricing power versus integrated majors is constrained. Industry data show branded fuel often commands only a 3–6 cents/gal premium (NACS 2023), limiting margin uplift from consumer loyalty. Low switching costs in commodity fuel markets make customers price-sensitive and prone to churn. Tauber must deepen account relationships and service differentiation to offset brand deficits.
High working capital intensity
Purchasing, storing and transporting hydrocarbons ties up large capital—Brent at ~$83/bbl (July 2025) means inventories quickly reach tens of millions in working capital for mid‑sized traders. Margin calls and volatile inventory swings repeatedly elevate cash needs, while higher financing costs in late 2024–2025 compressed trading spreads. Liquidity management is therefore a continuous operational focus.
- High stock value: Brent ~83/bbl (Jul 2025)
- Margin volatility: frequent cash calls
- Financing pressure: tighter spreads 2024–25
- Operational risk: continuous liquidity focus
Complex regulatory compliance load
Multi-jurisdictional environmental, safety and trade rules force Tauber Oil into high compliance costs and complex processes; documentation for custody transfer and quality control adds measurable overhead and staff hours. Non-compliance risks fines often in the millions and operational delays that hit throughput. This burden rises with product and geographic breadth.
- High multi-jurisdictional compliance costs
- Custody transfer and quality documentation overhead
- Fines and delays from non-compliance (often million-dollar scale)
- Costs scale with product and geographic expansion
Sub-5% margins | Brent $83/bbl | Tens $M WC
Thin wholesale margins (<5%) make profitability volume‑sensitive; small logistics or hedging losses can wipe EBITDA. Brent ~83/bbl (Jul 2025) drives inventory WC into tens of millions and frequent margin calls. Branded premium only 3–6¢/gal (NACS 2023), limiting pricing power. Multi‑jurisdiction compliance and potential million‑dollar fines raise fixed costs and operational risk.
| Metric | Value |
|---|---|
| Gross margin | <5% |
| Brent | $83/bbl (Jul 2025) |
| Branded premium | 3–6¢/gal |
| Inventory WC | Tens of $M |
| Compliance fines | Often $M+ |
Preview the Actual Deliverable
Tauber Oil SWOT Analysis
This is the actual Tauber Oil SWOT analysis document you’ll receive upon purchase—no surprises, just professional quality. The preview below is taken directly from the full report; buying unlocks the complete, editable version. You’re viewing a live excerpt of the real file, ready to use in strategy or valuation work.











