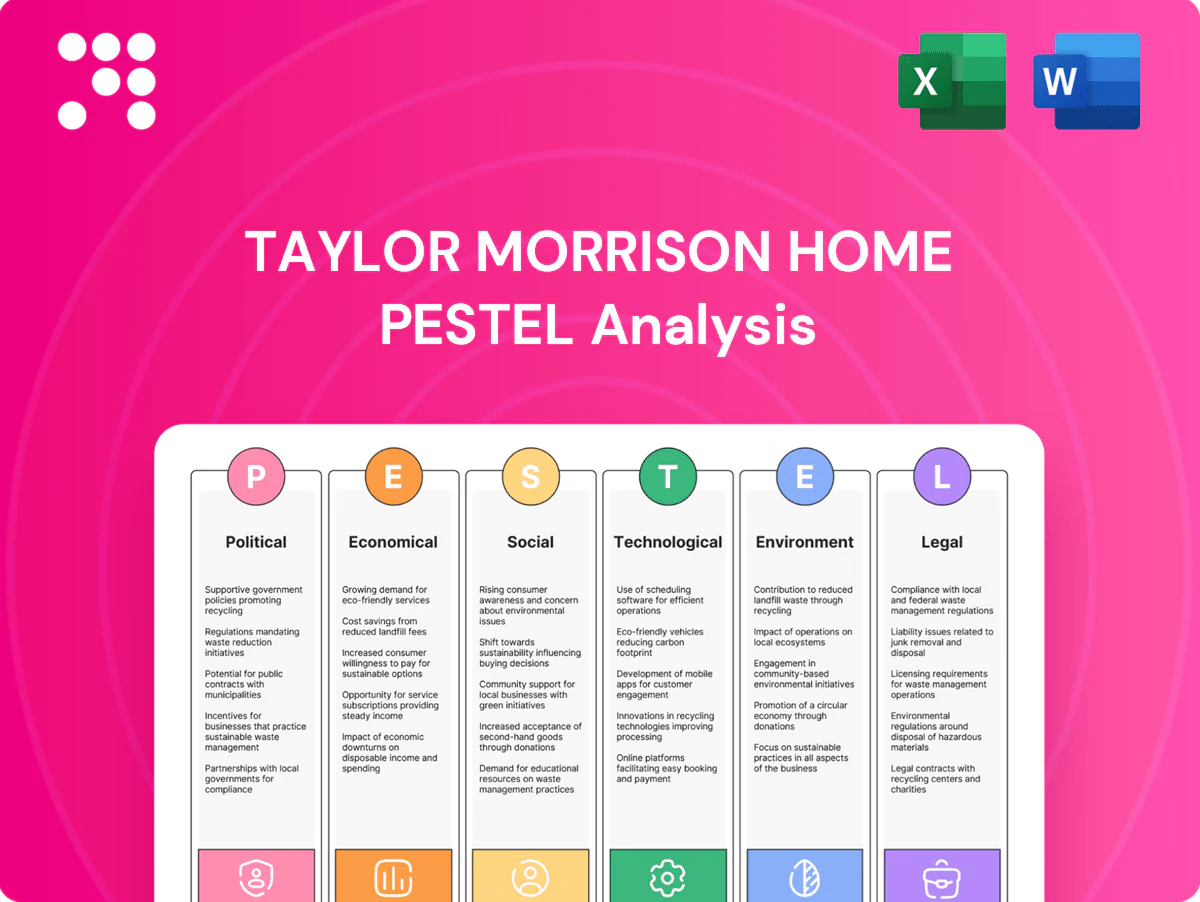
Taylor Morrison Home PESTLE Analysis

Skip the Research. Get the Strategy.
Unlock how political shifts, housing market cycles, and sustainability trends are reshaping Taylor Morrison Home with our concise PESTLE overview—insights that inform investment and strategy decisions. This analysis highlights regulatory risks, economic drivers, and technological opportunities you need to know. Purchase the full PESTLE to access detailed, actionable intelligence and ready-to-use charts for immediate strategic use.
Political factors

Zoning and land-use controls
Local governments dictate density, setbacks and allowable uses that directly shape Taylor Morrison’s community layouts and profitability, with most approvals handled at the municipal level. Wide variability across jurisdictions complicates standardization and extends development timelines, increasing carrying costs and scheduling risk. Proactive local engagement and entitlement expertise accelerate approvals, secure premium lots and allow Taylor Morrison (NYSE: TMHC) to capitalize when policy shifts favor higher-density or mixed-use product niches.
Permitting and approvals
Lengthy local permitting cycles, often exceeding 12 months, delay starts and raise carrying costs as capital tied up during higher interest-rate environments (around 7% for 30-year fixed in 2024) amplifies financing expense. Streamlined by-right approvals and fast-track housing initiatives, seen in several 2023–24 state reforms, improve velocity and reduce holding time. Political prioritization of housing supply cuts bottlenecks, but NIMBY opposition can reintroduce delays; strong municipal relationships preserve pipeline predictability.

Housing incentives and subsidies
Federal and state incentives—including the LIHTC program that has financed over 3 million affordable units since 1986—plus fee waivers and infrastructure credits can shift Taylor Morrison toward attainable product and improve absorption against a 2024 US new-home median sale price near $444,400; policy pullbacks would tighten entry-level economics, while alignment with workforce-housing priorities eases approvals and sustains demand.

Trade and tariff policy
Tariffs on inputs such as steel (US Section 232 tariffs of 25% on many steel imports) and duties on timber materially raise Taylor Morrison’s construction costs and compress margins, while geopolitical disruptions (for example, global supply-chain shocks since 2020) can spike lead times and input pricing. Diversifying suppliers and hedging contracts reduce exposure to raw-material volatility. Company advocacy for stable trade policy supports predictable build budgets and forecasting.
- tariff-steel: 25% US Section 232
- sourcing-diversification: reduces single-supplier risk
- hedging-contracts: stabilise input pricing
- policy-advocacy: improves budget predictability
Immigration and labor policy
Construction labor availability is highly sensitive to immigration enforcement and visa programs; foreign-born workers account for roughly 20–25% of the US construction workforce (Pew/ACS). Tight labor markets—with construction employment about 7.6 million in 2024 (BLS)—have extended cycle times and elevated build costs, sometimes adding roughly 10–15% in high-cost metros. Policies expanding skilled-labor access and workforce-development partnerships can unlock starts and improve quality for Taylor Morrison.
- labor-share: foreign-born ~20–25%
- employment-level: construction ~7.6M (2024 BLS)
- impact: labor tightness → build-costs +10–15% in some markets
- mitigation: visa expansion + training partnerships reduce policy risk
Permits >12m, 7% rates and 25% tariffs squeeze housing
Municipal zoning and lengthy permitting (often >12 months) drive timing and carrying costs; higher rates (30y ~7% in 2024) amplify financing pressure. Incentives like LIHTC (3.1M+ units since 1986) support attainable product demand, while 25% steel tariffs and 20–25% foreign-born construction share raise input and labor risk.
| Factor | Metric | Impact |
|---|---|---|
| Permitting | >12 months | Schedule delay, higher carrying cost |
| Rates | 30y ~7% (2024) | Higher financing expense |
| LIHTC | 3.1M+ units | Supports entry-level demand |
| Tariffs | Steel 25% | Raises material costs |
| Labor | Foreign-born 20–25%; construction 7.6M (2024) | Tight labor → +10–15% costs |
What is included in the product
 Detailed Word Document
Explores how Political, Economic, Social, Technological, Environmental and Legal forces uniquely impact Taylor Morrison Home, with data-backed, forward-looking insights and sub-point examples tied to regional market and regulatory dynamics; designed to help executives, consultants and investors identify risks, opportunities and strategic responses.

 Customizable Excel Spreadsheet
A concise, visually segmented PESTLE summary of Taylor Morrison Home that highlights external risks and market positioning for quick inclusion in meetings or slide decks, easily shared across teams and annotated with region- or business-specific notes.
Economic factors

Interest rates and mortgage costs
Interest rate levels drive affordability, conversion rates and backlog churn for Taylor Morrison: the 30-year fixed mortgage peaked near 7.79% in Oct 2023 and elevated rates since then (Fed funds ~5.25–5.50%) have compressed buyer purchasing power, pushing many toward smaller footprints or delaying purchases. Rate buydowns and incentives have been used to stabilize absorption and protect backlog. A falling-rate environment can catalyze sidelined demand to re-enter the market.
Housing affordability and wages
Income growth lags home price inflation, with US median household income at $74,580 (Census Bureau, 2023) versus a 2023 existing-home median near $390,000 (NAR), narrowing attainable price points for Taylor Morrison.
Affordability pressure boosts demand for townhomes and smaller single-family plans, shifting product mix toward lower-cost footprints and denser communities.
Price elasticity varies by market, altering incentive needs and option mixes; monitoring local wage trends and BLS earnings data guides community positioning and pricing strategies.

Land prices and availability
Entitled lot scarcity elevates land residuals and compresses margins for Taylor Morrison, pushing the firm toward optioned land strategies that reduce balance-sheet risk and can improve ROIC by shifting fixed costs off the balance sheet. Market cycles periodically create opportunities to acquire finished lots at discounts, lowering entry costs and protecting margins. Geographic diversification smooths lot-pipeline risk across markets.

Materials and labor inflation
Materials and labor inflation compress gross margins as volatility in lumber (down ~40% from 2021 peaks to 2024), concrete and HVAC parts raises cost of sales; Taylor Morrison reported a FY2024 gross margin near 19.3%, highlighting sensitivity to input swings. Supplier agreements and value engineering have trimmed cost pressure, while construction wage growth (~6% Y/Y in 2024) and labor scarcity extend cycle times. Active cycle-time management preserves cash conversion and inventory turns.
- Material volatility: lumber -40% from 2021 highs (through 2024)
- FY2024 gross margin: ~19.3%
- Construction wage growth: ~6% Y/Y (2024)
- Mitigants: supplier contracts, value engineering, cycle-time focus
Macro demand and migration
Strong job growth and roughly 1.2M annual household formations in 2023–24 shifted demand toward Sun Belt metros, where IRS and Census flows (Texas and Florida netting ~800k combined 2023–24) boosted community absorption and gave Taylor Morrison pricing power in key markets.
- Job growth: supports demand
- Household formation ~1.2M (2023–24)
- Sun Belt inflows ~800k (TX+FL, 2023–24)
- Recessions: higher cancellations, incentive spend rises
- Balanced 20+ MSA exposure reduces cyclicality
Permits >12m, 7% rates and 25% tariffs squeeze housing
Higher rates (30-yr ~6.7% mid-2025; fed funds ~5.25–5.50%) compress affordability and elevate incentives; falling rates would re-mobilize sidelined demand. Median household income $74,580 (2023) vs existing-home median ~$390k (2023) tightens attainable mix, pushing smaller footprints. FY2024 gross margin ~19.3%; material/labor inflation and lot scarcity pressure margins but Sun Belt flows and 1.2M household formations support absorption.
| Metric | Value |
|---|---|
| 30-yr mortgage | ~6.7% (mid-2025) |
| Fed funds | 5.25–5.50% |
| Median HH income | $74,580 (2023) |
| Median home price | ~$390k (2023) |
| FY2024 gross margin | ~19.3% |
| Household formation | ~1.2M (2023–24) |
Preview Before You Purchase
Taylor Morrison Home PESTLE Analysis
The preview shown here is the exact Taylor Morrison Home PESTLE Analysis document you’ll receive after purchase—fully formatted and ready to use. This screenshot reflects the real file with no placeholders or edits, covering political, economic, social, technological, legal and environmental factors. After checkout you’ll instantly download this exact, professionally structured analysis.

Skip the Research. Get the Strategy.
Unlock how political shifts, housing market cycles, and sustainability trends are reshaping Taylor Morrison Home with our concise PESTLE overview—insights that inform investment and strategy decisions. This analysis highlights regulatory risks, economic drivers, and technological opportunities you need to know. Purchase the full PESTLE to access detailed, actionable intelligence and ready-to-use charts for immediate strategic use.
Political factors
Zoning and land-use controls
Local governments dictate density, setbacks and allowable uses that directly shape Taylor Morrison’s community layouts and profitability, with most approvals handled at the municipal level. Wide variability across jurisdictions complicates standardization and extends development timelines, increasing carrying costs and scheduling risk. Proactive local engagement and entitlement expertise accelerate approvals, secure premium lots and allow Taylor Morrison (NYSE: TMHC) to capitalize when policy shifts favor higher-density or mixed-use product niches.
Permitting and approvals
Lengthy local permitting cycles, often exceeding 12 months, delay starts and raise carrying costs as capital tied up during higher interest-rate environments (around 7% for 30-year fixed in 2024) amplifies financing expense. Streamlined by-right approvals and fast-track housing initiatives, seen in several 2023–24 state reforms, improve velocity and reduce holding time. Political prioritization of housing supply cuts bottlenecks, but NIMBY opposition can reintroduce delays; strong municipal relationships preserve pipeline predictability.
Housing incentives and subsidies
Federal and state incentives—including the LIHTC program that has financed over 3 million affordable units since 1986—plus fee waivers and infrastructure credits can shift Taylor Morrison toward attainable product and improve absorption against a 2024 US new-home median sale price near $444,400; policy pullbacks would tighten entry-level economics, while alignment with workforce-housing priorities eases approvals and sustains demand.
Trade and tariff policy
Tariffs on inputs such as steel (US Section 232 tariffs of 25% on many steel imports) and duties on timber materially raise Taylor Morrison’s construction costs and compress margins, while geopolitical disruptions (for example, global supply-chain shocks since 2020) can spike lead times and input pricing. Diversifying suppliers and hedging contracts reduce exposure to raw-material volatility. Company advocacy for stable trade policy supports predictable build budgets and forecasting.
- tariff-steel: 25% US Section 232
- sourcing-diversification: reduces single-supplier risk
- hedging-contracts: stabilise input pricing
- policy-advocacy: improves budget predictability
Immigration and labor policy
Construction labor availability is highly sensitive to immigration enforcement and visa programs; foreign-born workers account for roughly 20–25% of the US construction workforce (Pew/ACS). Tight labor markets—with construction employment about 7.6 million in 2024 (BLS)—have extended cycle times and elevated build costs, sometimes adding roughly 10–15% in high-cost metros. Policies expanding skilled-labor access and workforce-development partnerships can unlock starts and improve quality for Taylor Morrison.
- labor-share: foreign-born ~20–25%
- employment-level: construction ~7.6M (2024 BLS)
- impact: labor tightness → build-costs +10–15% in some markets
- mitigation: visa expansion + training partnerships reduce policy risk
Permits >12m, 7% rates and 25% tariffs squeeze housing
Municipal zoning and lengthy permitting (often >12 months) drive timing and carrying costs; higher rates (30y ~7% in 2024) amplify financing pressure. Incentives like LIHTC (3.1M+ units since 1986) support attainable product demand, while 25% steel tariffs and 20–25% foreign-born construction share raise input and labor risk.
| Factor | Metric | Impact |
|---|---|---|
| Permitting | >12 months | Schedule delay, higher carrying cost |
| Rates | 30y ~7% (2024) | Higher financing expense |
| LIHTC | 3.1M+ units | Supports entry-level demand |
| Tariffs | Steel 25% | Raises material costs |
| Labor | Foreign-born 20–25%; construction 7.6M (2024) | Tight labor → +10–15% costs |
What is included in the product
Detailed Word Document
Explores how Political, Economic, Social, Technological, Environmental and Legal forces uniquely impact Taylor Morrison Home, with data-backed, forward-looking insights and sub-point examples tied to regional market and regulatory dynamics; designed to help executives, consultants and investors identify risks, opportunities and strategic responses.
Customizable Excel Spreadsheet
A concise, visually segmented PESTLE summary of Taylor Morrison Home that highlights external risks and market positioning for quick inclusion in meetings or slide decks, easily shared across teams and annotated with region- or business-specific notes.
Economic factors
Interest rates and mortgage costs
Interest rate levels drive affordability, conversion rates and backlog churn for Taylor Morrison: the 30-year fixed mortgage peaked near 7.79% in Oct 2023 and elevated rates since then (Fed funds ~5.25–5.50%) have compressed buyer purchasing power, pushing many toward smaller footprints or delaying purchases. Rate buydowns and incentives have been used to stabilize absorption and protect backlog. A falling-rate environment can catalyze sidelined demand to re-enter the market.
Housing affordability and wages
Income growth lags home price inflation, with US median household income at $74,580 (Census Bureau, 2023) versus a 2023 existing-home median near $390,000 (NAR), narrowing attainable price points for Taylor Morrison.
Affordability pressure boosts demand for townhomes and smaller single-family plans, shifting product mix toward lower-cost footprints and denser communities.
Price elasticity varies by market, altering incentive needs and option mixes; monitoring local wage trends and BLS earnings data guides community positioning and pricing strategies.
Land prices and availability
Entitled lot scarcity elevates land residuals and compresses margins for Taylor Morrison, pushing the firm toward optioned land strategies that reduce balance-sheet risk and can improve ROIC by shifting fixed costs off the balance sheet. Market cycles periodically create opportunities to acquire finished lots at discounts, lowering entry costs and protecting margins. Geographic diversification smooths lot-pipeline risk across markets.
Materials and labor inflation
Materials and labor inflation compress gross margins as volatility in lumber (down ~40% from 2021 peaks to 2024), concrete and HVAC parts raises cost of sales; Taylor Morrison reported a FY2024 gross margin near 19.3%, highlighting sensitivity to input swings. Supplier agreements and value engineering have trimmed cost pressure, while construction wage growth (~6% Y/Y in 2024) and labor scarcity extend cycle times. Active cycle-time management preserves cash conversion and inventory turns.
- Material volatility: lumber -40% from 2021 highs (through 2024)
- FY2024 gross margin: ~19.3%
- Construction wage growth: ~6% Y/Y (2024)
- Mitigants: supplier contracts, value engineering, cycle-time focus
Macro demand and migration
Strong job growth and roughly 1.2M annual household formations in 2023–24 shifted demand toward Sun Belt metros, where IRS and Census flows (Texas and Florida netting ~800k combined 2023–24) boosted community absorption and gave Taylor Morrison pricing power in key markets.
- Job growth: supports demand
- Household formation ~1.2M (2023–24)
- Sun Belt inflows ~800k (TX+FL, 2023–24)
- Recessions: higher cancellations, incentive spend rises
- Balanced 20+ MSA exposure reduces cyclicality
Permits >12m, 7% rates and 25% tariffs squeeze housing
Higher rates (30-yr ~6.7% mid-2025; fed funds ~5.25–5.50%) compress affordability and elevate incentives; falling rates would re-mobilize sidelined demand. Median household income $74,580 (2023) vs existing-home median ~$390k (2023) tightens attainable mix, pushing smaller footprints. FY2024 gross margin ~19.3%; material/labor inflation and lot scarcity pressure margins but Sun Belt flows and 1.2M household formations support absorption.
| Metric | Value |
|---|---|
| 30-yr mortgage | ~6.7% (mid-2025) |
| Fed funds | 5.25–5.50% |
| Median HH income | $74,580 (2023) |
| Median home price | ~$390k (2023) |
| FY2024 gross margin | ~19.3% |
| Household formation | ~1.2M (2023–24) |
Preview Before You Purchase
Taylor Morrison Home PESTLE Analysis
The preview shown here is the exact Taylor Morrison Home PESTLE Analysis document you’ll receive after purchase—fully formatted and ready to use. This screenshot reflects the real file with no placeholders or edits, covering political, economic, social, technological, legal and environmental factors. After checkout you’ll instantly download this exact, professionally structured analysis.
Description
Skip the Research. Get the Strategy.
Unlock how political shifts, housing market cycles, and sustainability trends are reshaping Taylor Morrison Home with our concise PESTLE overview—insights that inform investment and strategy decisions. This analysis highlights regulatory risks, economic drivers, and technological opportunities you need to know. Purchase the full PESTLE to access detailed, actionable intelligence and ready-to-use charts for immediate strategic use.
Political factors
Zoning and land-use controls
Local governments dictate density, setbacks and allowable uses that directly shape Taylor Morrison’s community layouts and profitability, with most approvals handled at the municipal level. Wide variability across jurisdictions complicates standardization and extends development timelines, increasing carrying costs and scheduling risk. Proactive local engagement and entitlement expertise accelerate approvals, secure premium lots and allow Taylor Morrison (NYSE: TMHC) to capitalize when policy shifts favor higher-density or mixed-use product niches.
Permitting and approvals
Lengthy local permitting cycles, often exceeding 12 months, delay starts and raise carrying costs as capital tied up during higher interest-rate environments (around 7% for 30-year fixed in 2024) amplifies financing expense. Streamlined by-right approvals and fast-track housing initiatives, seen in several 2023–24 state reforms, improve velocity and reduce holding time. Political prioritization of housing supply cuts bottlenecks, but NIMBY opposition can reintroduce delays; strong municipal relationships preserve pipeline predictability.
Housing incentives and subsidies
Federal and state incentives—including the LIHTC program that has financed over 3 million affordable units since 1986—plus fee waivers and infrastructure credits can shift Taylor Morrison toward attainable product and improve absorption against a 2024 US new-home median sale price near $444,400; policy pullbacks would tighten entry-level economics, while alignment with workforce-housing priorities eases approvals and sustains demand.
Trade and tariff policy
Tariffs on inputs such as steel (US Section 232 tariffs of 25% on many steel imports) and duties on timber materially raise Taylor Morrison’s construction costs and compress margins, while geopolitical disruptions (for example, global supply-chain shocks since 2020) can spike lead times and input pricing. Diversifying suppliers and hedging contracts reduce exposure to raw-material volatility. Company advocacy for stable trade policy supports predictable build budgets and forecasting.
- tariff-steel: 25% US Section 232
- sourcing-diversification: reduces single-supplier risk
- hedging-contracts: stabilise input pricing
- policy-advocacy: improves budget predictability
Immigration and labor policy
Construction labor availability is highly sensitive to immigration enforcement and visa programs; foreign-born workers account for roughly 20–25% of the US construction workforce (Pew/ACS). Tight labor markets—with construction employment about 7.6 million in 2024 (BLS)—have extended cycle times and elevated build costs, sometimes adding roughly 10–15% in high-cost metros. Policies expanding skilled-labor access and workforce-development partnerships can unlock starts and improve quality for Taylor Morrison.
- labor-share: foreign-born ~20–25%
- employment-level: construction ~7.6M (2024 BLS)
- impact: labor tightness → build-costs +10–15% in some markets
- mitigation: visa expansion + training partnerships reduce policy risk
Permits >12m, 7% rates and 25% tariffs squeeze housing
Municipal zoning and lengthy permitting (often >12 months) drive timing and carrying costs; higher rates (30y ~7% in 2024) amplify financing pressure. Incentives like LIHTC (3.1M+ units since 1986) support attainable product demand, while 25% steel tariffs and 20–25% foreign-born construction share raise input and labor risk.
| Factor | Metric | Impact |
|---|---|---|
| Permitting | >12 months | Schedule delay, higher carrying cost |
| Rates | 30y ~7% (2024) | Higher financing expense |
| LIHTC | 3.1M+ units | Supports entry-level demand |
| Tariffs | Steel 25% | Raises material costs |
| Labor | Foreign-born 20–25%; construction 7.6M (2024) | Tight labor → +10–15% costs |
What is included in the product
Detailed Word Document
Explores how Political, Economic, Social, Technological, Environmental and Legal forces uniquely impact Taylor Morrison Home, with data-backed, forward-looking insights and sub-point examples tied to regional market and regulatory dynamics; designed to help executives, consultants and investors identify risks, opportunities and strategic responses.
Customizable Excel Spreadsheet
A concise, visually segmented PESTLE summary of Taylor Morrison Home that highlights external risks and market positioning for quick inclusion in meetings or slide decks, easily shared across teams and annotated with region- or business-specific notes.
Economic factors
Interest rates and mortgage costs
Interest rate levels drive affordability, conversion rates and backlog churn for Taylor Morrison: the 30-year fixed mortgage peaked near 7.79% in Oct 2023 and elevated rates since then (Fed funds ~5.25–5.50%) have compressed buyer purchasing power, pushing many toward smaller footprints or delaying purchases. Rate buydowns and incentives have been used to stabilize absorption and protect backlog. A falling-rate environment can catalyze sidelined demand to re-enter the market.
Housing affordability and wages
Income growth lags home price inflation, with US median household income at $74,580 (Census Bureau, 2023) versus a 2023 existing-home median near $390,000 (NAR), narrowing attainable price points for Taylor Morrison.
Affordability pressure boosts demand for townhomes and smaller single-family plans, shifting product mix toward lower-cost footprints and denser communities.
Price elasticity varies by market, altering incentive needs and option mixes; monitoring local wage trends and BLS earnings data guides community positioning and pricing strategies.
Land prices and availability
Entitled lot scarcity elevates land residuals and compresses margins for Taylor Morrison, pushing the firm toward optioned land strategies that reduce balance-sheet risk and can improve ROIC by shifting fixed costs off the balance sheet. Market cycles periodically create opportunities to acquire finished lots at discounts, lowering entry costs and protecting margins. Geographic diversification smooths lot-pipeline risk across markets.
Materials and labor inflation
Materials and labor inflation compress gross margins as volatility in lumber (down ~40% from 2021 peaks to 2024), concrete and HVAC parts raises cost of sales; Taylor Morrison reported a FY2024 gross margin near 19.3%, highlighting sensitivity to input swings. Supplier agreements and value engineering have trimmed cost pressure, while construction wage growth (~6% Y/Y in 2024) and labor scarcity extend cycle times. Active cycle-time management preserves cash conversion and inventory turns.
- Material volatility: lumber -40% from 2021 highs (through 2024)
- FY2024 gross margin: ~19.3%
- Construction wage growth: ~6% Y/Y (2024)
- Mitigants: supplier contracts, value engineering, cycle-time focus
Macro demand and migration
Strong job growth and roughly 1.2M annual household formations in 2023–24 shifted demand toward Sun Belt metros, where IRS and Census flows (Texas and Florida netting ~800k combined 2023–24) boosted community absorption and gave Taylor Morrison pricing power in key markets.
- Job growth: supports demand
- Household formation ~1.2M (2023–24)
- Sun Belt inflows ~800k (TX+FL, 2023–24)
- Recessions: higher cancellations, incentive spend rises
- Balanced 20+ MSA exposure reduces cyclicality
Permits >12m, 7% rates and 25% tariffs squeeze housing
Higher rates (30-yr ~6.7% mid-2025; fed funds ~5.25–5.50%) compress affordability and elevate incentives; falling rates would re-mobilize sidelined demand. Median household income $74,580 (2023) vs existing-home median ~$390k (2023) tightens attainable mix, pushing smaller footprints. FY2024 gross margin ~19.3%; material/labor inflation and lot scarcity pressure margins but Sun Belt flows and 1.2M household formations support absorption.
| Metric | Value |
|---|---|
| 30-yr mortgage | ~6.7% (mid-2025) |
| Fed funds | 5.25–5.50% |
| Median HH income | $74,580 (2023) |
| Median home price | ~$390k (2023) |
| FY2024 gross margin | ~19.3% |
| Household formation | ~1.2M (2023–24) |
Preview Before You Purchase
Taylor Morrison Home PESTLE Analysis
The preview shown here is the exact Taylor Morrison Home PESTLE Analysis document you’ll receive after purchase—fully formatted and ready to use. This screenshot reflects the real file with no placeholders or edits, covering political, economic, social, technological, legal and environmental factors. After checkout you’ll instantly download this exact, professionally structured analysis.











