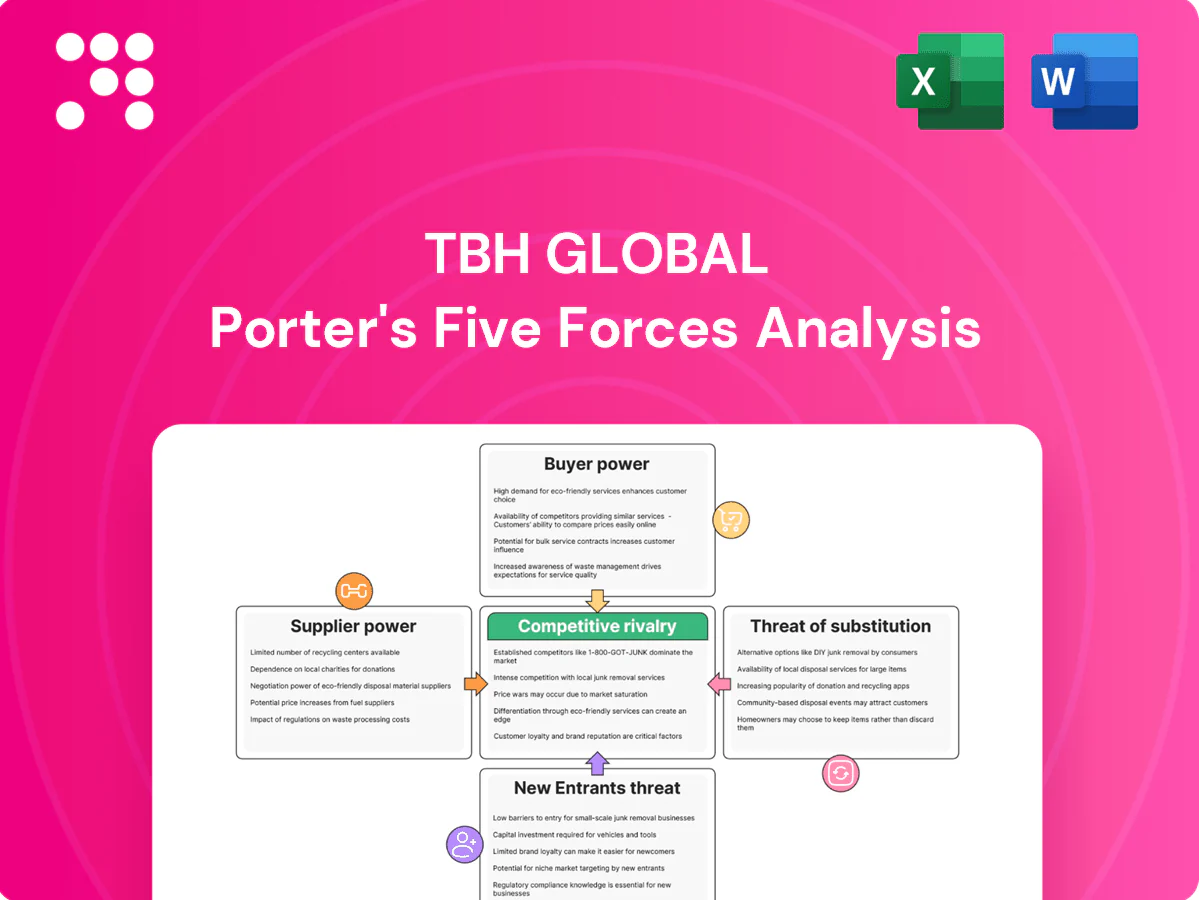
TBH Global Porter's Five Forces Analysis

Go Beyond the Preview—Access the Full Strategic Report
TBH Global faces varied competitive pressures—from supplier leverage to rising substitutes—and this snapshot highlights key tensions shaping margins and growth. The full Porter's Five Forces Analysis delivers force-by-force ratings, visuals, and actionable strategies to inform investment or strategic decisions—unlock the complete report now.
Suppliers Bargaining Power

Concentrated fabric and trim sources
Core textiles, specialty fabrics and trims remain concentrated in East Asian mills, with typical lead times of 8–12 weeks in 2024, giving suppliers leverage to pass through 8–12% quality or capacity premiums. TBH Global reduces this chokepoint via dual-sourcing and vendor scorecards. Strategic buffer inventories and selective nearshoring cut disruption likelihood and shorten lead times.
Sustainability and compliance premiums
Certifications like OEKO-TEX and GRS plus 2024-driven traceability rules (CSRD reporting expansion) raise sourcing costs and shrink the qualified supplier pool, letting compliant suppliers command higher margins and stricter MOQs. TBH Global offsets this by aggregating volume across brands to dilute premiums, while long-term partnerships trade committed volume and forecasting accuracy for improved pricing and terms.

Switching costs and design specificity
Style-specific fabrics, dyes and fit blocks create implicit switching costs that lock TBH Global to suppliers for a season. Development samples and approvals commonly take 4–6 weeks, tying cadence and inventory to established vendors. Industry practice shows standardizing components can cut lead-time variability by about 20% (2024 reports), and strict calendar discipline enables phased transitions without jeopardizing drops.

Logistics and currency exposure
Freight volatility and FX swings amplify supplier bargaining: 2024 spot container volatility and a ~35% correction in Drewry WCI increased surcharge pass-through while KRW traded near 1,300 per USD (≈180 per CNY), strengthening carriers’ leverage. Suppliers commonly add logistics surcharges; TBH Global can hedge FX, diversify lanes/ports, use vendor-managed logistics and consolidate shipments to limit pass-through.
- FX hedge: reduce KRW/USD exposure
- Lane diversification: shift ports to lower-cost hubs
- VMI & consolidation: lower per-unit logistics surge
Capacity utilization cycles
When mills and factories run near full capacity (often above 85%), allocation favors higher-margin buyers and peak seasons push minimum order quantities and lead times materially higher; suppliers reported average lead-time spikes of 30–60% in 2024 in apparel and packaging sectors. TBH Global’s multi-brand volume secures priority allocation on constrained lines, while off-peak ordering and calendar smoothing lower costs and improve negotiating leverage.
- 85%+ utilization triggers allocation
- Lead times +30–60% in 2024 peak months
- Multi-brand volume = priority lines
- Off-peak orders reduce price and lead-time risk
East Asia supply squeeze: 8–12w lead times, 8–12% premiums; firm uses dual-sourcing
Suppliers concentrated in East Asia with 8–12 week lead times passed 8–12% quality/capacity premiums in 2024; TBH uses dual-sourcing, vendor scorecards and buffer stock to reduce leverage. Certification and CSRD-driven traceability narrowed qualified suppliers, raising margins and MOQs; TBH aggregates volume and signs long-term deals. Peak utilization >85% caused 30–60% lead-time spikes in 2024, where multi-brand volume secured priority allocation.
| Metric | 2024 Value | Impact |
|---|---|---|
| Lead time | 8–12 weeks | Higher switching cost |
| Supplier premium | 8–12% | Cost pass-through |
| Capacity | >85% | Allocation/30–60% LT spike |
What is included in the product
 Detailed Word Document
Tailored Porter's Five Forces analysis for TBH Global that uncovers key drivers of competition, buyer and supplier power, threats from substitutes and new entrants, and competitive rivalry. Provides strategic insights on pricing influence, market entry barriers, disruptive threats, and actionable implications for TBH Global’s positioning and profitability.

 Customizable Excel Spreadsheet
A one-sheet, customizable Porter's Five Forces tool that instantly visualizes competitive pressure via a radar chart—perfect for quick strategic decisions, scenario comparisons, and easy slide-ready export without macros.
Customers Bargaining Power

Price-sensitive fashion consumers
Price-sensitive fast fashion consumers keep price elasticity high and switching easy, with the global apparel market valued at about US$1.7 trillion in 2024 and promotional cycles accelerating turnover. Frequent promotions condition many buyers to wait for discounts, with surveys showing over 50% delay purchases for sales. TBH Global must use sharp opening price points and clear value cues. Tight inventory control and differentiated designs cut reliance on markdowns.
Omnichannel transparency
Online price comparison sites and reviews have amplified buyer leverage—2024 data show 94% of shoppers consult reviews and 58% use comparison tools—while cross-border marketplaces, which reached roughly $1.2 trillion in sales in 2024, widen alternative-brand access. TBH Global can mine D2C data to sharpen assortments and personalize offers, and exclusive drops or limited editions reduce direct comparability and preserve margin.

Wholesale and marketplace dependence
Retail partners and marketplaces can demand margins, returns and marketing support, with slotting fees in CPG channels reported between $10,000 and $250,000 per SKU and coop/marketing allowances commonly 2–6% of sales. Marketplaces like Amazon levy average referral fees around 15%, raising take rates and pressuring TBH Global margins. TBH can rebalance by growing owned e-commerce and stores while using exclusive capsules for key accounts to protect shelf space without diluting brand.

Brand portfolio segmentation
Brand portfolio segmentation spreads demand across distinct segments, lowering single-buyer concentration and strengthening TBH Global’s negotiating position. Broad portfolios enable bundle deals and volume negotiations—2024 industry reports cite double-digit average order value uplifts from bundled promotions. Cross-selling across brands cuts customer acquisition costs, while clear positioning prevents internal cannibalization buyers could exploit.
- Reduced single-buyer risk
- Bundle/volume leverage (2024: double-digit AOV uplift)
- Lower CAC via cross-sell
- Distinct positioning prevents cannibalization
Service and speed expectations
Next-day delivery and easy returns are table stakes: in 2024, 68% of global shoppers rated next‑day or faster delivery as important, and slow fulfillment directly erodes loyalty, raising buyer leverage and return rates.
TBH Global must invest in last‑mile partnerships, smart returns automation, pre‑order selling and nearshore quick‑response to capture trend windows and reduce churn.
- Customer expectation: 2024 — 68% prioritize next‑day
- Strategy: last‑mile + returns automation
- Opportunity: pre‑order & nearshore quick‑response
Price-sensitive fashion shoppers force margins; apparel market US$1.7T
Price-sensitive fast-fashion buyers drive high elasticity; global apparel market US$1.7T (2024) and >50% delay purchases for sales. Reviews/comparison tools: 94% consult reviews, 58% use comparison (2024). TBH must scale D2C, exclusive drops, last‑mile and returns automation to protect margin.
| Metric | 2024 | Implication |
|---|---|---|
| Apparel market | US$1.7T | Large TAM |
| Consult reviews | 94% | High transparency |
| Compare tools | 58% | Ease of switching |
| Next‑day priority | 68% | Fulfillment investment |
| Marketplace fee | ~15% | Margin pressure |
Full Version Awaits
TBH Global Porter's Five Forces Analysis
This preview displays the TBH Global Porter's Five Forces Analysis exactly as delivered—no placeholders or mockups. The file you see is the final, fully formatted document you’ll receive instantly after purchase. It’s ready for immediate use in reports, presentations, or decision-making. No surprises, just the complete analysis.

Go Beyond the Preview—Access the Full Strategic Report
TBH Global faces varied competitive pressures—from supplier leverage to rising substitutes—and this snapshot highlights key tensions shaping margins and growth. The full Porter's Five Forces Analysis delivers force-by-force ratings, visuals, and actionable strategies to inform investment or strategic decisions—unlock the complete report now.
Suppliers Bargaining Power
Concentrated fabric and trim sources
Core textiles, specialty fabrics and trims remain concentrated in East Asian mills, with typical lead times of 8–12 weeks in 2024, giving suppliers leverage to pass through 8–12% quality or capacity premiums. TBH Global reduces this chokepoint via dual-sourcing and vendor scorecards. Strategic buffer inventories and selective nearshoring cut disruption likelihood and shorten lead times.
Sustainability and compliance premiums
Certifications like OEKO-TEX and GRS plus 2024-driven traceability rules (CSRD reporting expansion) raise sourcing costs and shrink the qualified supplier pool, letting compliant suppliers command higher margins and stricter MOQs. TBH Global offsets this by aggregating volume across brands to dilute premiums, while long-term partnerships trade committed volume and forecasting accuracy for improved pricing and terms.
Switching costs and design specificity
Style-specific fabrics, dyes and fit blocks create implicit switching costs that lock TBH Global to suppliers for a season. Development samples and approvals commonly take 4–6 weeks, tying cadence and inventory to established vendors. Industry practice shows standardizing components can cut lead-time variability by about 20% (2024 reports), and strict calendar discipline enables phased transitions without jeopardizing drops.
Logistics and currency exposure
Freight volatility and FX swings amplify supplier bargaining: 2024 spot container volatility and a ~35% correction in Drewry WCI increased surcharge pass-through while KRW traded near 1,300 per USD (≈180 per CNY), strengthening carriers’ leverage. Suppliers commonly add logistics surcharges; TBH Global can hedge FX, diversify lanes/ports, use vendor-managed logistics and consolidate shipments to limit pass-through.
- FX hedge: reduce KRW/USD exposure
- Lane diversification: shift ports to lower-cost hubs
- VMI & consolidation: lower per-unit logistics surge
Capacity utilization cycles
When mills and factories run near full capacity (often above 85%), allocation favors higher-margin buyers and peak seasons push minimum order quantities and lead times materially higher; suppliers reported average lead-time spikes of 30–60% in 2024 in apparel and packaging sectors. TBH Global’s multi-brand volume secures priority allocation on constrained lines, while off-peak ordering and calendar smoothing lower costs and improve negotiating leverage.
- 85%+ utilization triggers allocation
- Lead times +30–60% in 2024 peak months
- Multi-brand volume = priority lines
- Off-peak orders reduce price and lead-time risk
East Asia supply squeeze: 8–12w lead times, 8–12% premiums; firm uses dual-sourcing
Suppliers concentrated in East Asia with 8–12 week lead times passed 8–12% quality/capacity premiums in 2024; TBH uses dual-sourcing, vendor scorecards and buffer stock to reduce leverage. Certification and CSRD-driven traceability narrowed qualified suppliers, raising margins and MOQs; TBH aggregates volume and signs long-term deals. Peak utilization >85% caused 30–60% lead-time spikes in 2024, where multi-brand volume secured priority allocation.
| Metric | 2024 Value | Impact |
|---|---|---|
| Lead time | 8–12 weeks | Higher switching cost |
| Supplier premium | 8–12% | Cost pass-through |
| Capacity | >85% | Allocation/30–60% LT spike |
What is included in the product
Detailed Word Document
Tailored Porter's Five Forces analysis for TBH Global that uncovers key drivers of competition, buyer and supplier power, threats from substitutes and new entrants, and competitive rivalry. Provides strategic insights on pricing influence, market entry barriers, disruptive threats, and actionable implications for TBH Global’s positioning and profitability.
Customizable Excel Spreadsheet
A one-sheet, customizable Porter's Five Forces tool that instantly visualizes competitive pressure via a radar chart—perfect for quick strategic decisions, scenario comparisons, and easy slide-ready export without macros.
Customers Bargaining Power
Price-sensitive fashion consumers
Price-sensitive fast fashion consumers keep price elasticity high and switching easy, with the global apparel market valued at about US$1.7 trillion in 2024 and promotional cycles accelerating turnover. Frequent promotions condition many buyers to wait for discounts, with surveys showing over 50% delay purchases for sales. TBH Global must use sharp opening price points and clear value cues. Tight inventory control and differentiated designs cut reliance on markdowns.
Omnichannel transparency
Online price comparison sites and reviews have amplified buyer leverage—2024 data show 94% of shoppers consult reviews and 58% use comparison tools—while cross-border marketplaces, which reached roughly $1.2 trillion in sales in 2024, widen alternative-brand access. TBH Global can mine D2C data to sharpen assortments and personalize offers, and exclusive drops or limited editions reduce direct comparability and preserve margin.
Wholesale and marketplace dependence
Retail partners and marketplaces can demand margins, returns and marketing support, with slotting fees in CPG channels reported between $10,000 and $250,000 per SKU and coop/marketing allowances commonly 2–6% of sales. Marketplaces like Amazon levy average referral fees around 15%, raising take rates and pressuring TBH Global margins. TBH can rebalance by growing owned e-commerce and stores while using exclusive capsules for key accounts to protect shelf space without diluting brand.
Brand portfolio segmentation
Brand portfolio segmentation spreads demand across distinct segments, lowering single-buyer concentration and strengthening TBH Global’s negotiating position. Broad portfolios enable bundle deals and volume negotiations—2024 industry reports cite double-digit average order value uplifts from bundled promotions. Cross-selling across brands cuts customer acquisition costs, while clear positioning prevents internal cannibalization buyers could exploit.
- Reduced single-buyer risk
- Bundle/volume leverage (2024: double-digit AOV uplift)
- Lower CAC via cross-sell
- Distinct positioning prevents cannibalization
Service and speed expectations
Next-day delivery and easy returns are table stakes: in 2024, 68% of global shoppers rated next‑day or faster delivery as important, and slow fulfillment directly erodes loyalty, raising buyer leverage and return rates.
TBH Global must invest in last‑mile partnerships, smart returns automation, pre‑order selling and nearshore quick‑response to capture trend windows and reduce churn.
- Customer expectation: 2024 — 68% prioritize next‑day
- Strategy: last‑mile + returns automation
- Opportunity: pre‑order & nearshore quick‑response
Price-sensitive fashion shoppers force margins; apparel market US$1.7T
Price-sensitive fast-fashion buyers drive high elasticity; global apparel market US$1.7T (2024) and >50% delay purchases for sales. Reviews/comparison tools: 94% consult reviews, 58% use comparison (2024). TBH must scale D2C, exclusive drops, last‑mile and returns automation to protect margin.
| Metric | 2024 | Implication |
|---|---|---|
| Apparel market | US$1.7T | Large TAM |
| Consult reviews | 94% | High transparency |
| Compare tools | 58% | Ease of switching |
| Next‑day priority | 68% | Fulfillment investment |
| Marketplace fee | ~15% | Margin pressure |
Full Version Awaits
TBH Global Porter's Five Forces Analysis
This preview displays the TBH Global Porter's Five Forces Analysis exactly as delivered—no placeholders or mockups. The file you see is the final, fully formatted document you’ll receive instantly after purchase. It’s ready for immediate use in reports, presentations, or decision-making. No surprises, just the complete analysis.
Original: $10.00
-65%$10.00
$3.50Description
Go Beyond the Preview—Access the Full Strategic Report
TBH Global faces varied competitive pressures—from supplier leverage to rising substitutes—and this snapshot highlights key tensions shaping margins and growth. The full Porter's Five Forces Analysis delivers force-by-force ratings, visuals, and actionable strategies to inform investment or strategic decisions—unlock the complete report now.
Suppliers Bargaining Power
Concentrated fabric and trim sources
Core textiles, specialty fabrics and trims remain concentrated in East Asian mills, with typical lead times of 8–12 weeks in 2024, giving suppliers leverage to pass through 8–12% quality or capacity premiums. TBH Global reduces this chokepoint via dual-sourcing and vendor scorecards. Strategic buffer inventories and selective nearshoring cut disruption likelihood and shorten lead times.
Sustainability and compliance premiums
Certifications like OEKO-TEX and GRS plus 2024-driven traceability rules (CSRD reporting expansion) raise sourcing costs and shrink the qualified supplier pool, letting compliant suppliers command higher margins and stricter MOQs. TBH Global offsets this by aggregating volume across brands to dilute premiums, while long-term partnerships trade committed volume and forecasting accuracy for improved pricing and terms.
Switching costs and design specificity
Style-specific fabrics, dyes and fit blocks create implicit switching costs that lock TBH Global to suppliers for a season. Development samples and approvals commonly take 4–6 weeks, tying cadence and inventory to established vendors. Industry practice shows standardizing components can cut lead-time variability by about 20% (2024 reports), and strict calendar discipline enables phased transitions without jeopardizing drops.
Logistics and currency exposure
Freight volatility and FX swings amplify supplier bargaining: 2024 spot container volatility and a ~35% correction in Drewry WCI increased surcharge pass-through while KRW traded near 1,300 per USD (≈180 per CNY), strengthening carriers’ leverage. Suppliers commonly add logistics surcharges; TBH Global can hedge FX, diversify lanes/ports, use vendor-managed logistics and consolidate shipments to limit pass-through.
- FX hedge: reduce KRW/USD exposure
- Lane diversification: shift ports to lower-cost hubs
- VMI & consolidation: lower per-unit logistics surge
Capacity utilization cycles
When mills and factories run near full capacity (often above 85%), allocation favors higher-margin buyers and peak seasons push minimum order quantities and lead times materially higher; suppliers reported average lead-time spikes of 30–60% in 2024 in apparel and packaging sectors. TBH Global’s multi-brand volume secures priority allocation on constrained lines, while off-peak ordering and calendar smoothing lower costs and improve negotiating leverage.
- 85%+ utilization triggers allocation
- Lead times +30–60% in 2024 peak months
- Multi-brand volume = priority lines
- Off-peak orders reduce price and lead-time risk
East Asia supply squeeze: 8–12w lead times, 8–12% premiums; firm uses dual-sourcing
Suppliers concentrated in East Asia with 8–12 week lead times passed 8–12% quality/capacity premiums in 2024; TBH uses dual-sourcing, vendor scorecards and buffer stock to reduce leverage. Certification and CSRD-driven traceability narrowed qualified suppliers, raising margins and MOQs; TBH aggregates volume and signs long-term deals. Peak utilization >85% caused 30–60% lead-time spikes in 2024, where multi-brand volume secured priority allocation.
| Metric | 2024 Value | Impact |
|---|---|---|
| Lead time | 8–12 weeks | Higher switching cost |
| Supplier premium | 8–12% | Cost pass-through |
| Capacity | >85% | Allocation/30–60% LT spike |
What is included in the product
Detailed Word Document
Tailored Porter's Five Forces analysis for TBH Global that uncovers key drivers of competition, buyer and supplier power, threats from substitutes and new entrants, and competitive rivalry. Provides strategic insights on pricing influence, market entry barriers, disruptive threats, and actionable implications for TBH Global’s positioning and profitability.
Customizable Excel Spreadsheet
A one-sheet, customizable Porter's Five Forces tool that instantly visualizes competitive pressure via a radar chart—perfect for quick strategic decisions, scenario comparisons, and easy slide-ready export without macros.
Customers Bargaining Power
Price-sensitive fashion consumers
Price-sensitive fast fashion consumers keep price elasticity high and switching easy, with the global apparel market valued at about US$1.7 trillion in 2024 and promotional cycles accelerating turnover. Frequent promotions condition many buyers to wait for discounts, with surveys showing over 50% delay purchases for sales. TBH Global must use sharp opening price points and clear value cues. Tight inventory control and differentiated designs cut reliance on markdowns.
Omnichannel transparency
Online price comparison sites and reviews have amplified buyer leverage—2024 data show 94% of shoppers consult reviews and 58% use comparison tools—while cross-border marketplaces, which reached roughly $1.2 trillion in sales in 2024, widen alternative-brand access. TBH Global can mine D2C data to sharpen assortments and personalize offers, and exclusive drops or limited editions reduce direct comparability and preserve margin.
Wholesale and marketplace dependence
Retail partners and marketplaces can demand margins, returns and marketing support, with slotting fees in CPG channels reported between $10,000 and $250,000 per SKU and coop/marketing allowances commonly 2–6% of sales. Marketplaces like Amazon levy average referral fees around 15%, raising take rates and pressuring TBH Global margins. TBH can rebalance by growing owned e-commerce and stores while using exclusive capsules for key accounts to protect shelf space without diluting brand.
Brand portfolio segmentation
Brand portfolio segmentation spreads demand across distinct segments, lowering single-buyer concentration and strengthening TBH Global’s negotiating position. Broad portfolios enable bundle deals and volume negotiations—2024 industry reports cite double-digit average order value uplifts from bundled promotions. Cross-selling across brands cuts customer acquisition costs, while clear positioning prevents internal cannibalization buyers could exploit.
- Reduced single-buyer risk
- Bundle/volume leverage (2024: double-digit AOV uplift)
- Lower CAC via cross-sell
- Distinct positioning prevents cannibalization
Service and speed expectations
Next-day delivery and easy returns are table stakes: in 2024, 68% of global shoppers rated next‑day or faster delivery as important, and slow fulfillment directly erodes loyalty, raising buyer leverage and return rates.
TBH Global must invest in last‑mile partnerships, smart returns automation, pre‑order selling and nearshore quick‑response to capture trend windows and reduce churn.
- Customer expectation: 2024 — 68% prioritize next‑day
- Strategy: last‑mile + returns automation
- Opportunity: pre‑order & nearshore quick‑response
Price-sensitive fashion shoppers force margins; apparel market US$1.7T
Price-sensitive fast-fashion buyers drive high elasticity; global apparel market US$1.7T (2024) and >50% delay purchases for sales. Reviews/comparison tools: 94% consult reviews, 58% use comparison (2024). TBH must scale D2C, exclusive drops, last‑mile and returns automation to protect margin.
| Metric | 2024 | Implication |
|---|---|---|
| Apparel market | US$1.7T | Large TAM |
| Consult reviews | 94% | High transparency |
| Compare tools | 58% | Ease of switching |
| Next‑day priority | 68% | Fulfillment investment |
| Marketplace fee | ~15% | Margin pressure |
Full Version Awaits
TBH Global Porter's Five Forces Analysis
This preview displays the TBH Global Porter's Five Forces Analysis exactly as delivered—no placeholders or mockups. The file you see is the final, fully formatted document you’ll receive instantly after purchase. It’s ready for immediate use in reports, presentations, or decision-making. No surprises, just the complete analysis.











