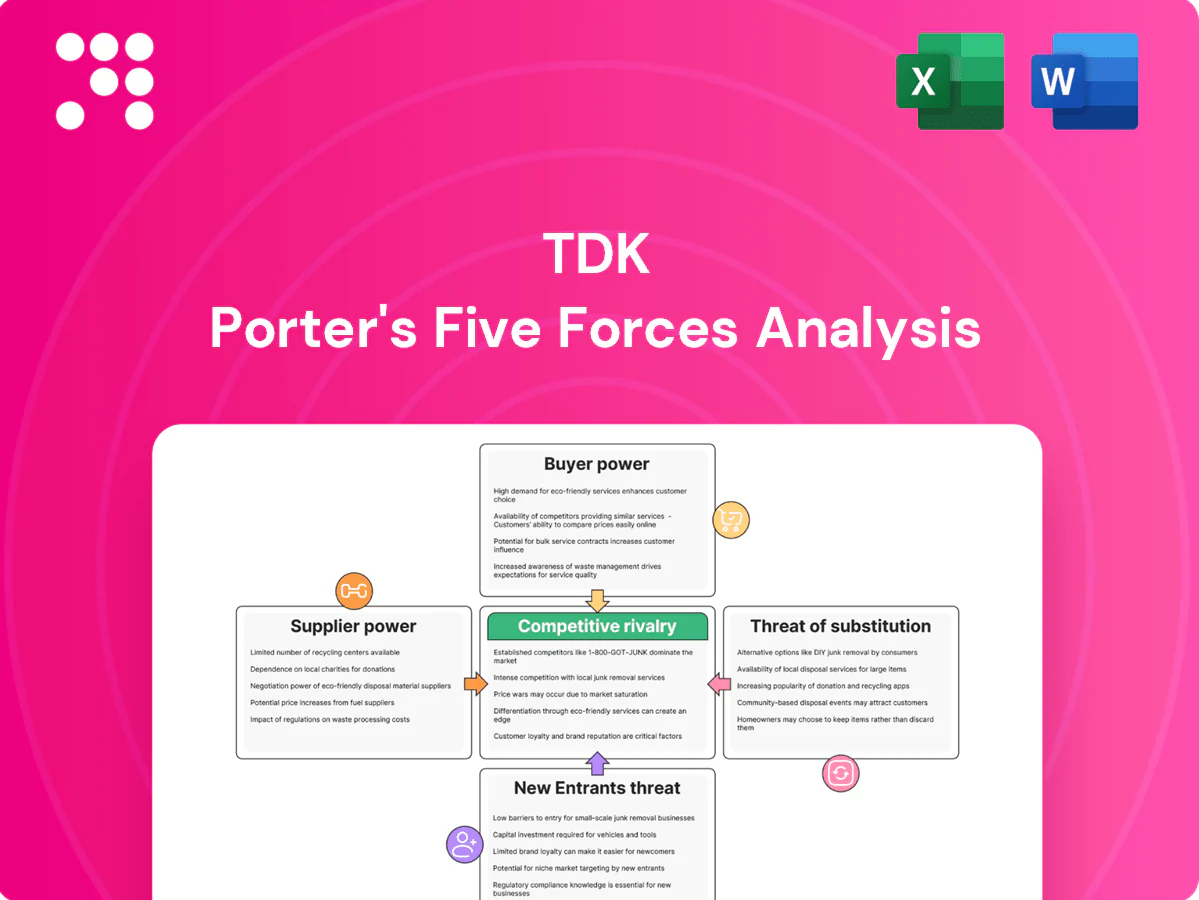
TDK Porter's Five Forces Analysis

A Must-Have Tool for Decision-Makers
TDK faces varied competitive pressures across supplier strength, buyer bargaining, substitute risks, rivalry intensity, and barriers to entry, all shaping margins and strategic choices. Our concise snapshot highlights key trends and vulnerabilities affecting TDK’s market position. This preview is just the beginning. The full analysis provides a complete strategic snapshot with force-by-force ratings, visuals, and business implications tailored to TDK.
Suppliers Bargaining Power

Concentrated raw materials
TDK depends on specialized inputs — ceramic powders, ferrites, rare earths, foils and precision chemicals — many sourced from a small pool of qualified suppliers, with over 60% of rare earth processing concentrated in China in 2024. This supplier concentration raises switching costs and exposure to supply shocks. Long-term contracts and dual sourcing reduce but do not eliminate the risk to production continuity.
Equipment and tooling dependence
High-precision deposition, sintering and test tools are supplied by a small group of OEMs, with lead times commonly of 6–12 months and frequent customization giving vendors pricing and delivery leverage. Any equipment bottleneck can delay capacity ramps or yield improvements across TDK’s passive component and magnetic product lines. TDK mitigates this by co-developing tools with vendors and pushing platform standardization to reduce custom cycles.

Quality and certification thresholds
Automotive and industrial grades demand stringent certifications such as AEC-Q100/AEC-Q200 and ISO 9001, raising entry thresholds for component makers. Only a subset of global suppliers consistently meet these specs at volume, narrowing approved vendor lists and strengthening supplier bargaining power. TDK runs supplier development and qualification programs to expand qualified sources and mitigate concentration risk over time.

Commodity price volatility
Metals, energy and petrochemical inputs drive commodity-price volatility for TDK; copper averaged about US$9,500/tonne in 2024 and Brent crude averaged near US$85/bbl, allowing suppliers to pass costs quickly and squeeze margins.
Hedging and formula pricing reduced swings but did not remove them; regionalizing supply chains cut logistics and tariff exposure, improving margin resilience.
- Supplier pass-through risk: high
- 2024 copper ~US$9,500/t; Brent ~US$85/bbl
- Hedging dampens but not eliminates volatility
- Regionalization lowers logistics/tariff impact
Geopolitical and ESG constraints
Export controls expanded in 2023–24 targeting advanced semiconductor-related goods, narrowing viable supplier pools and increasing switching costs for manufacturers like TDK.
EU CSRD implementation in 2024 brings ESG audits and reporting to roughly 50,000 companies, raising compliance costs and sidelining otherwise capable vendors, which increases leverage for compliant, scarce suppliers; TDK’s sustainability screening both constrains and stabilizes its chain.
- Export controls: reduced supplier universe
- ESG audits: CSRD ~50,000 firms (2024)
- Traceability: compliance raises costs, favors scarce compliant suppliers
- TDK screening: restricts suppliers but improves resilience
Supply risk: China >60% RE; 6-12m lead times; copper ~US$9,500/t, Brent ~US$85/bbl
TDK faces strong supplier power from concentrated rare-earth/capacitor sourcing (China >60% RE processing in 2024), long equipment lead times (6–12 months) and limited certified automotive vendors. Commodity exposure (copper ~US$9,500/t; Brent ~US$85/bbl in 2024) enables cost pass-through. Hedging and regionalization reduce but do not remove disruption risk.
| Metric | 2024 | Impact |
|---|---|---|
| RE processing | >60% China | High concentration |
| Copper | ~US$9,500/t | Cost volatility |
| Brent | ~US$85/bbl | Input inflation |
What is included in the product
 Detailed Word Document
Tailored Porter’s Five Forces analysis for TDK that evaluates competitive rivalry, supplier and buyer power, threat of substitutes and new entrants, and highlights disruptive risks and strategic levers to protect margins and market share.

 Customizable Excel Spreadsheet
A concise TDK Porter's Five Forces one-sheet that highlights supplier, buyer, substitute, entrant, and rivalry pressures—ideal for quick strategic fixes and boardroom decisions.
Customers Bargaining Power

Concentrated OEMs and Tier-1s
Automotive, ICT and consumer electronics buyers are large, sophisticated and highly price-sensitive: global vehicle production was about 66 million units in 2023 and smartphone shipments reached roughly 1.21 billion in 2024, concentrating purchasing power in a few OEMs and top 5 handset makers that account for ~70–75% of volumes. Their consolidated procurement delivers strong negotiating leverage, driving demands for volume discounts and 3–5% annual cost-down roadmaps. Rigorous vendor scorecards increasingly link pricing, delivery and quality to allocation and contract renewals, intensifying margin pressure on suppliers like TDK.
Design-in and qualification stickiness
Once TDK parts are designed-in and qualified, switching is costly and slow—qualification in auto and industrial platforms typically takes 12–36 months and can impose supplier-switching costs of several million dollars per platform, reducing mid-cycle buyer power for matched parts. Buyers counter with dual-sourcing mandates to avoid lock-in, while TDK gains pricing and share advantages when specifications are proprietary or performance-differentiated.

Demand cyclicality and scheduling
End-market cyclicality drives pronounced pushouts and pull-ins in TDK's supply chain, with buyers exploiting forecast visibility to demand scheduling flexibility and penalties for missed deliveries; TDK reported consolidated net sales of ¥1.68 trillion for FY2024, underscoring volume sensitivity to cycles. In downturns customers press for rapid price concessions and shorter lead times, increasing bargaining power. Framework agreements are used to balance buyer flexibility with TDK capacity commitments.

Total cost and performance trade-offs
Buyers trade price against reliability, miniaturization and efficiency; in automotive and telecom high-spec segments price sensitivity falls as performance requirements rise, supporting TDK’s premium positioning—TDK reported approximately 1.1 trillion JPY revenue in FY2023, underscoring scale in high-value sensors and power solutions.
In commoditized passive components, price dominates and buyer power increases, but TDK’s differentiated sensor and power portfolios moderate this pressure by capturing higher-margin applications and recurring OEM design wins.
- Price vs performance: high-spec lowers price sensitivity
- Commoditized passives: price-driven, higher buyer power
- TDK strength: sensor/power differentiation reduces bargaining pressure
Vendor consolidation and VMI programs
Large OEMs favor supplier consolidation and VMI/consignment, raising switching costs while concentrating bargaining power with selected vendors; compliance with logistics KPIs becomes a direct price and penalty lever. TDK’s broad component portfolio supports preferred-supplier status but invites tougher commercial terms and narrower margins. VMI partnerships shift inventory risk to suppliers, amplifying buyer demands.
- Vendor consolidation increases buyer leverage
- Logistics KPIs used as price levers
- TDK breadth wins preferred status
- Preferred status => tougher contract terms
OEM concentration drives price leverage amid long design-ins and rising dual-sourcing pressure
Large OEMs concentrate demand (top 5 handset/OEMs ~70–75% volumes; 66M vehicles in 2023, 1.21B smartphones in 2024), driving strong price leverage and 3–5% annual cost-downs. Long qualification (12–36 months) and design-ins reduce mid-cycle buyer power while dual-sourcing and VMI raise negotiating pressure. TDK’s FY2024 sales ¥1.68T reflect sensitivity to cycles but benefit from high-value sensor/power differentiation.
| Metric | Value |
|---|---|
| Top buyer concentration | ~70–75% |
| Vehicles (2023) | 66M |
| Smartphones (2024) | 1.21B |
| TDK FY2024 Sales | ¥1.68T |
Preview the Actual Deliverable
TDK Porter's Five Forces Analysis
This preview shows the exact TDK Porter's Five Forces Analysis you'll receive immediately after purchase—no surprises, placeholders, or sample excerpts. The document displayed here is fully formatted, professionally written, and ready for download and use the moment you buy. You're viewing the actual deliverable; once payment is complete you'll have instant access to this identical file.

A Must-Have Tool for Decision-Makers
TDK faces varied competitive pressures across supplier strength, buyer bargaining, substitute risks, rivalry intensity, and barriers to entry, all shaping margins and strategic choices. Our concise snapshot highlights key trends and vulnerabilities affecting TDK’s market position. This preview is just the beginning. The full analysis provides a complete strategic snapshot with force-by-force ratings, visuals, and business implications tailored to TDK.
Suppliers Bargaining Power
Concentrated raw materials
TDK depends on specialized inputs — ceramic powders, ferrites, rare earths, foils and precision chemicals — many sourced from a small pool of qualified suppliers, with over 60% of rare earth processing concentrated in China in 2024. This supplier concentration raises switching costs and exposure to supply shocks. Long-term contracts and dual sourcing reduce but do not eliminate the risk to production continuity.
Equipment and tooling dependence
High-precision deposition, sintering and test tools are supplied by a small group of OEMs, with lead times commonly of 6–12 months and frequent customization giving vendors pricing and delivery leverage. Any equipment bottleneck can delay capacity ramps or yield improvements across TDK’s passive component and magnetic product lines. TDK mitigates this by co-developing tools with vendors and pushing platform standardization to reduce custom cycles.
Quality and certification thresholds
Automotive and industrial grades demand stringent certifications such as AEC-Q100/AEC-Q200 and ISO 9001, raising entry thresholds for component makers. Only a subset of global suppliers consistently meet these specs at volume, narrowing approved vendor lists and strengthening supplier bargaining power. TDK runs supplier development and qualification programs to expand qualified sources and mitigate concentration risk over time.
Commodity price volatility
Metals, energy and petrochemical inputs drive commodity-price volatility for TDK; copper averaged about US$9,500/tonne in 2024 and Brent crude averaged near US$85/bbl, allowing suppliers to pass costs quickly and squeeze margins.
Hedging and formula pricing reduced swings but did not remove them; regionalizing supply chains cut logistics and tariff exposure, improving margin resilience.
- Supplier pass-through risk: high
- 2024 copper ~US$9,500/t; Brent ~US$85/bbl
- Hedging dampens but not eliminates volatility
- Regionalization lowers logistics/tariff impact
Geopolitical and ESG constraints
Export controls expanded in 2023–24 targeting advanced semiconductor-related goods, narrowing viable supplier pools and increasing switching costs for manufacturers like TDK.
EU CSRD implementation in 2024 brings ESG audits and reporting to roughly 50,000 companies, raising compliance costs and sidelining otherwise capable vendors, which increases leverage for compliant, scarce suppliers; TDK’s sustainability screening both constrains and stabilizes its chain.
- Export controls: reduced supplier universe
- ESG audits: CSRD ~50,000 firms (2024)
- Traceability: compliance raises costs, favors scarce compliant suppliers
- TDK screening: restricts suppliers but improves resilience
Supply risk: China >60% RE; 6-12m lead times; copper ~US$9,500/t, Brent ~US$85/bbl
TDK faces strong supplier power from concentrated rare-earth/capacitor sourcing (China >60% RE processing in 2024), long equipment lead times (6–12 months) and limited certified automotive vendors. Commodity exposure (copper ~US$9,500/t; Brent ~US$85/bbl in 2024) enables cost pass-through. Hedging and regionalization reduce but do not remove disruption risk.
| Metric | 2024 | Impact |
|---|---|---|
| RE processing | >60% China | High concentration |
| Copper | ~US$9,500/t | Cost volatility |
| Brent | ~US$85/bbl | Input inflation |
What is included in the product
Detailed Word Document
Tailored Porter’s Five Forces analysis for TDK that evaluates competitive rivalry, supplier and buyer power, threat of substitutes and new entrants, and highlights disruptive risks and strategic levers to protect margins and market share.
Customizable Excel Spreadsheet
A concise TDK Porter's Five Forces one-sheet that highlights supplier, buyer, substitute, entrant, and rivalry pressures—ideal for quick strategic fixes and boardroom decisions.
Customers Bargaining Power
Concentrated OEMs and Tier-1s
Automotive, ICT and consumer electronics buyers are large, sophisticated and highly price-sensitive: global vehicle production was about 66 million units in 2023 and smartphone shipments reached roughly 1.21 billion in 2024, concentrating purchasing power in a few OEMs and top 5 handset makers that account for ~70–75% of volumes. Their consolidated procurement delivers strong negotiating leverage, driving demands for volume discounts and 3–5% annual cost-down roadmaps. Rigorous vendor scorecards increasingly link pricing, delivery and quality to allocation and contract renewals, intensifying margin pressure on suppliers like TDK.
Design-in and qualification stickiness
Once TDK parts are designed-in and qualified, switching is costly and slow—qualification in auto and industrial platforms typically takes 12–36 months and can impose supplier-switching costs of several million dollars per platform, reducing mid-cycle buyer power for matched parts. Buyers counter with dual-sourcing mandates to avoid lock-in, while TDK gains pricing and share advantages when specifications are proprietary or performance-differentiated.
Demand cyclicality and scheduling
End-market cyclicality drives pronounced pushouts and pull-ins in TDK's supply chain, with buyers exploiting forecast visibility to demand scheduling flexibility and penalties for missed deliveries; TDK reported consolidated net sales of ¥1.68 trillion for FY2024, underscoring volume sensitivity to cycles. In downturns customers press for rapid price concessions and shorter lead times, increasing bargaining power. Framework agreements are used to balance buyer flexibility with TDK capacity commitments.
Total cost and performance trade-offs
Buyers trade price against reliability, miniaturization and efficiency; in automotive and telecom high-spec segments price sensitivity falls as performance requirements rise, supporting TDK’s premium positioning—TDK reported approximately 1.1 trillion JPY revenue in FY2023, underscoring scale in high-value sensors and power solutions.
In commoditized passive components, price dominates and buyer power increases, but TDK’s differentiated sensor and power portfolios moderate this pressure by capturing higher-margin applications and recurring OEM design wins.
- Price vs performance: high-spec lowers price sensitivity
- Commoditized passives: price-driven, higher buyer power
- TDK strength: sensor/power differentiation reduces bargaining pressure
Vendor consolidation and VMI programs
Large OEMs favor supplier consolidation and VMI/consignment, raising switching costs while concentrating bargaining power with selected vendors; compliance with logistics KPIs becomes a direct price and penalty lever. TDK’s broad component portfolio supports preferred-supplier status but invites tougher commercial terms and narrower margins. VMI partnerships shift inventory risk to suppliers, amplifying buyer demands.
- Vendor consolidation increases buyer leverage
- Logistics KPIs used as price levers
- TDK breadth wins preferred status
- Preferred status => tougher contract terms
OEM concentration drives price leverage amid long design-ins and rising dual-sourcing pressure
Large OEMs concentrate demand (top 5 handset/OEMs ~70–75% volumes; 66M vehicles in 2023, 1.21B smartphones in 2024), driving strong price leverage and 3–5% annual cost-downs. Long qualification (12–36 months) and design-ins reduce mid-cycle buyer power while dual-sourcing and VMI raise negotiating pressure. TDK’s FY2024 sales ¥1.68T reflect sensitivity to cycles but benefit from high-value sensor/power differentiation.
| Metric | Value |
|---|---|
| Top buyer concentration | ~70–75% |
| Vehicles (2023) | 66M |
| Smartphones (2024) | 1.21B |
| TDK FY2024 Sales | ¥1.68T |
Preview the Actual Deliverable
TDK Porter's Five Forces Analysis
This preview shows the exact TDK Porter's Five Forces Analysis you'll receive immediately after purchase—no surprises, placeholders, or sample excerpts. The document displayed here is fully formatted, professionally written, and ready for download and use the moment you buy. You're viewing the actual deliverable; once payment is complete you'll have instant access to this identical file.
Original: $10.00
-65%$10.00
$3.50Description
A Must-Have Tool for Decision-Makers
TDK faces varied competitive pressures across supplier strength, buyer bargaining, substitute risks, rivalry intensity, and barriers to entry, all shaping margins and strategic choices. Our concise snapshot highlights key trends and vulnerabilities affecting TDK’s market position. This preview is just the beginning. The full analysis provides a complete strategic snapshot with force-by-force ratings, visuals, and business implications tailored to TDK.
Suppliers Bargaining Power
Concentrated raw materials
TDK depends on specialized inputs — ceramic powders, ferrites, rare earths, foils and precision chemicals — many sourced from a small pool of qualified suppliers, with over 60% of rare earth processing concentrated in China in 2024. This supplier concentration raises switching costs and exposure to supply shocks. Long-term contracts and dual sourcing reduce but do not eliminate the risk to production continuity.
Equipment and tooling dependence
High-precision deposition, sintering and test tools are supplied by a small group of OEMs, with lead times commonly of 6–12 months and frequent customization giving vendors pricing and delivery leverage. Any equipment bottleneck can delay capacity ramps or yield improvements across TDK’s passive component and magnetic product lines. TDK mitigates this by co-developing tools with vendors and pushing platform standardization to reduce custom cycles.
Quality and certification thresholds
Automotive and industrial grades demand stringent certifications such as AEC-Q100/AEC-Q200 and ISO 9001, raising entry thresholds for component makers. Only a subset of global suppliers consistently meet these specs at volume, narrowing approved vendor lists and strengthening supplier bargaining power. TDK runs supplier development and qualification programs to expand qualified sources and mitigate concentration risk over time.
Commodity price volatility
Metals, energy and petrochemical inputs drive commodity-price volatility for TDK; copper averaged about US$9,500/tonne in 2024 and Brent crude averaged near US$85/bbl, allowing suppliers to pass costs quickly and squeeze margins.
Hedging and formula pricing reduced swings but did not remove them; regionalizing supply chains cut logistics and tariff exposure, improving margin resilience.
- Supplier pass-through risk: high
- 2024 copper ~US$9,500/t; Brent ~US$85/bbl
- Hedging dampens but not eliminates volatility
- Regionalization lowers logistics/tariff impact
Geopolitical and ESG constraints
Export controls expanded in 2023–24 targeting advanced semiconductor-related goods, narrowing viable supplier pools and increasing switching costs for manufacturers like TDK.
EU CSRD implementation in 2024 brings ESG audits and reporting to roughly 50,000 companies, raising compliance costs and sidelining otherwise capable vendors, which increases leverage for compliant, scarce suppliers; TDK’s sustainability screening both constrains and stabilizes its chain.
- Export controls: reduced supplier universe
- ESG audits: CSRD ~50,000 firms (2024)
- Traceability: compliance raises costs, favors scarce compliant suppliers
- TDK screening: restricts suppliers but improves resilience
Supply risk: China >60% RE; 6-12m lead times; copper ~US$9,500/t, Brent ~US$85/bbl
TDK faces strong supplier power from concentrated rare-earth/capacitor sourcing (China >60% RE processing in 2024), long equipment lead times (6–12 months) and limited certified automotive vendors. Commodity exposure (copper ~US$9,500/t; Brent ~US$85/bbl in 2024) enables cost pass-through. Hedging and regionalization reduce but do not remove disruption risk.
| Metric | 2024 | Impact |
|---|---|---|
| RE processing | >60% China | High concentration |
| Copper | ~US$9,500/t | Cost volatility |
| Brent | ~US$85/bbl | Input inflation |
What is included in the product
Detailed Word Document
Tailored Porter’s Five Forces analysis for TDK that evaluates competitive rivalry, supplier and buyer power, threat of substitutes and new entrants, and highlights disruptive risks and strategic levers to protect margins and market share.
Customizable Excel Spreadsheet
A concise TDK Porter's Five Forces one-sheet that highlights supplier, buyer, substitute, entrant, and rivalry pressures—ideal for quick strategic fixes and boardroom decisions.
Customers Bargaining Power
Concentrated OEMs and Tier-1s
Automotive, ICT and consumer electronics buyers are large, sophisticated and highly price-sensitive: global vehicle production was about 66 million units in 2023 and smartphone shipments reached roughly 1.21 billion in 2024, concentrating purchasing power in a few OEMs and top 5 handset makers that account for ~70–75% of volumes. Their consolidated procurement delivers strong negotiating leverage, driving demands for volume discounts and 3–5% annual cost-down roadmaps. Rigorous vendor scorecards increasingly link pricing, delivery and quality to allocation and contract renewals, intensifying margin pressure on suppliers like TDK.
Design-in and qualification stickiness
Once TDK parts are designed-in and qualified, switching is costly and slow—qualification in auto and industrial platforms typically takes 12–36 months and can impose supplier-switching costs of several million dollars per platform, reducing mid-cycle buyer power for matched parts. Buyers counter with dual-sourcing mandates to avoid lock-in, while TDK gains pricing and share advantages when specifications are proprietary or performance-differentiated.
Demand cyclicality and scheduling
End-market cyclicality drives pronounced pushouts and pull-ins in TDK's supply chain, with buyers exploiting forecast visibility to demand scheduling flexibility and penalties for missed deliveries; TDK reported consolidated net sales of ¥1.68 trillion for FY2024, underscoring volume sensitivity to cycles. In downturns customers press for rapid price concessions and shorter lead times, increasing bargaining power. Framework agreements are used to balance buyer flexibility with TDK capacity commitments.
Total cost and performance trade-offs
Buyers trade price against reliability, miniaturization and efficiency; in automotive and telecom high-spec segments price sensitivity falls as performance requirements rise, supporting TDK’s premium positioning—TDK reported approximately 1.1 trillion JPY revenue in FY2023, underscoring scale in high-value sensors and power solutions.
In commoditized passive components, price dominates and buyer power increases, but TDK’s differentiated sensor and power portfolios moderate this pressure by capturing higher-margin applications and recurring OEM design wins.
- Price vs performance: high-spec lowers price sensitivity
- Commoditized passives: price-driven, higher buyer power
- TDK strength: sensor/power differentiation reduces bargaining pressure
Vendor consolidation and VMI programs
Large OEMs favor supplier consolidation and VMI/consignment, raising switching costs while concentrating bargaining power with selected vendors; compliance with logistics KPIs becomes a direct price and penalty lever. TDK’s broad component portfolio supports preferred-supplier status but invites tougher commercial terms and narrower margins. VMI partnerships shift inventory risk to suppliers, amplifying buyer demands.
- Vendor consolidation increases buyer leverage
- Logistics KPIs used as price levers
- TDK breadth wins preferred status
- Preferred status => tougher contract terms
OEM concentration drives price leverage amid long design-ins and rising dual-sourcing pressure
Large OEMs concentrate demand (top 5 handset/OEMs ~70–75% volumes; 66M vehicles in 2023, 1.21B smartphones in 2024), driving strong price leverage and 3–5% annual cost-downs. Long qualification (12–36 months) and design-ins reduce mid-cycle buyer power while dual-sourcing and VMI raise negotiating pressure. TDK’s FY2024 sales ¥1.68T reflect sensitivity to cycles but benefit from high-value sensor/power differentiation.
| Metric | Value |
|---|---|
| Top buyer concentration | ~70–75% |
| Vehicles (2023) | 66M |
| Smartphones (2024) | 1.21B |
| TDK FY2024 Sales | ¥1.68T |
Preview the Actual Deliverable
TDK Porter's Five Forces Analysis
This preview shows the exact TDK Porter's Five Forces Analysis you'll receive immediately after purchase—no surprises, placeholders, or sample excerpts. The document displayed here is fully formatted, professionally written, and ready for download and use the moment you buy. You're viewing the actual deliverable; once payment is complete you'll have instant access to this identical file.











