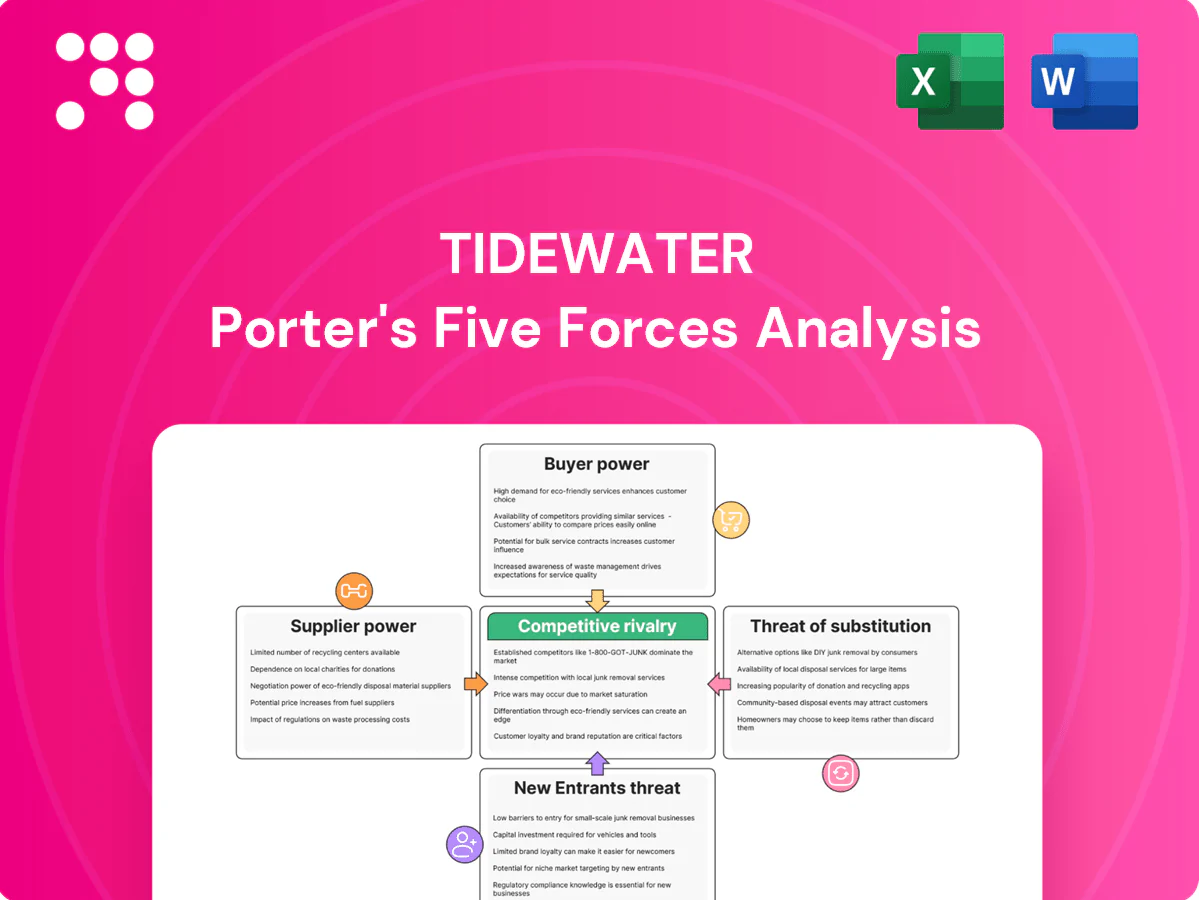
Tidewater Porter's Five Forces Analysis

Don't Miss the Bigger Picture
Tidewater operates in a capital‑intensive shipping support niche where buyer concentration, contract length, and fleet utilization shape margins; suppliers of specialized vessels and skilled crews exert moderate leverage while barriers to entry and substitution remain significant. This brief snapshot only scratches the surface. Unlock the full Porter's Five Forces Analysis to explore Tidewater’s competitive dynamics, market pressures, and strategic advantages in detail.
Suppliers Bargaining Power

Concentrated critical equipment
OSVs depend on engines, DP systems and navigation electronics from a few global OEMs, concentrating supplier power and allowing price increases and longer waits; in 2024 lead times for DP and integrated navigation packages commonly run 6–12 months. Standardization helps interoperability, but type-approval and system integration needs severely restrict switching, and supplier bottlenecks can stall newbuilds and major retrofits.
Shipyard and drydock constraints
Quality shipyards with OSV expertise are finite and regionally concentrated, with China, South Korea and Japan together accounting for roughly 86% of global shipbuilding CGT in 2024, concentrating supplier leverage.
High yard utilization and industry consolidation boost pricing power for newbuilds and life-extensions, especially for specialist OSV work.
Drydock slots and class surveys create time-sensitive demand and scheduling risk that operators pay premiums to avoid.

Fuel and lube volatility
Bunker suppliers are numerous but prices track global oil markets; Brent crude averaged about $86/bbl in 2024, keeping bunkers volatile and margins exposed. IMO-driven shifts to VLSFO and bio-blends tighten effective supply, raising premium and compliance costs. Pass-through clauses in contracts mitigate inflationary impact, yet spot exposure and remote theaters with limited bunkering can concentrate supplier power.

Crewing and specialized labor
DP-certified mariners and offshore-experienced crews became scarce in upcycles; 2024 industry surveys reported crew wage inflation around 10–15% and retention bonuses commonly ranging from $5,000–$20,000, raising operating costs. Training and safety compliance slow substitution, and local content rules further constrain labor pools.
- 10–15% wage inflation in 2024
- Retention bonuses $5k–$20k
- Training & safety restrict substitution
- Local content limits pool
Class, spares, and service networks
Class societies, OEM service partners, and spare-part channels heavily shape lifecycle costs for Tidewater; 2024 industry reports indicate OEM parts markups up to 40% and locked software/warranties increase operator dependence. Geographically uneven service coverage forces premium call-out rates, especially in offshore West Africa and Arctic routes. Downtime risk of $5k–$50k/day amplifies supplier leverage.
- Class certifications drive inspection cadence and costs
- OEM-locks on software/warranties raise switching costs
- Sparse regional support → higher call-out premiums
Supply squeeze: shipyards ~86%, Brent $86/bbl, DP 6-12m, wages +10-15%
Supplier power is high: DP/navigation lead times 6–12 months and OEM parts markups up to 40% raise capex and retrofit costs. Shipyard concentration (China/SK/Japan ~86% CGT in 2024) and high utilization push newbuild premiums. Bunker volatility (Brent ~$86/bbl in 2024) and IMO fuel shifts raise operating costs. Crew shortages drove 10–15% wage inflation and $5k–$20k retention bonuses in 2024.
| Metric | 2024 Value |
|---|---|
| Shipbuilding share (China/SK/Japan) | ~86% |
| Brent crude avg | $86/bbl |
| DP lead times | 6–12 months |
| Wage inflation | 10–15% |
| Retention bonuses | $5k–$20k |
| OEM parts markup | Up to 40% |
What is included in the product
 Detailed Word Document
Uncovers key drivers of competition, customer influence, and market entry risks specific to Tidewater, with detailed assessment of supplier and buyer power, substitutes, and rivalry; identifies disruptive threats and barriers protecting incumbents for use in investor materials, strategy decks, or academic work.

 Customizable Excel Spreadsheet
A clear, one-sheet Porter's Five Forces for tidewater ports—instantly clarifies competitive and regulatory pressures facing terminals, carriers, and logistics providers. Swap in your data or scenarios to model shifts from new entrants, infrastructure projects, or trade policy with no macros required.
Customers Bargaining Power

Concentrated blue-chip customers
IOC/NOC and large EPC contractors (eg Saudi Aramco, Shell, Exxon, TechnipFMC) dominate Tidewater demand, using scale and procurement sophistication to shape markets. Long-term frame agreements and competitive tenders compress day rates and tighten commercial terms. Strict reputation and HSE credentials act as entry barriers, while buyers routinely bundle multi-region requirements to extract volume discounts.
Tender-driven pricing
Tender-driven pricing in tidewater services boosts price transparency and comparability, with digital tender platforms in 2024 reporting average bid reductions around 8–12% versus negotiated deals. Standardized specifications compress margins unless vessels add clear differentiation such as fuel efficiency or faster turnaround. Options and contract extensions commonly embed rate ceilings, limiting upside. Incumbency helps, but awards frequently pivot on price deltas under 3–5%.

Utilization sensitivity
Buyers in 2024 increasingly timed time charters to project milestones, producing pronounced peaks and troughs in demand and pressuring spot rates. Resulting idle time risk erodes supplier pricing power as owners compete to fill gaps. Seasonality and constrained weather windows, especially in Arctic and hurricane-prone regions, amplify customer negotiation leverage. Long-term contracts exist but remained cyclically scarce in 2024, limiting downside protection.

Switching costs are moderate
Multiple qualified OSV providers operate in major basins; 2024 industry ranges show 5–10 vetted operators per basin, so switching options exist. Mobilization/demobilization and HSE onboarding create friction—typical mobilization costs range from $50,000–$200,000 and onboarding 3–7 days—yet remain manageable. Buyers routinely rotate vessels to match specs, and strong operational KPIs keep incumbent churn low.
- Provider depth: 5–10 per basin (2024)
- Mobilization cost: $50k–$200k (2024)
- Onboarding time: 3–7 days (2024)
- Low churn when KPIs met
ESG and local content demands
Customers now demand lower emissions and demonstrable local participation; the EU CSRD rollout in 2024 expanded ESG obligations to roughly 50,000 firms, pushing compliance costs down supply chains and into supplier pricing. Failure to meet ESG or local content thresholds commonly disqualifies bids, and buyers increasingly weight ESG/local criteria to extract price concessions, guarantees, and performance assurances.
- CSRD 2024: ~50,000 companies impacted
- Compliance costs shifted to suppliers
- ESG/local content can disqualify bids
- Buyers use criteria to extract value
Buyers drive 8-12% bid cuts; awards decided on 3-5% deltas as suppliers absorb ESG costs
Buyers (IOCs/NOCs, large EPCs) exert strong leverage via volume tenders, driving 8–12% average bid reductions in 2024 and awards decided on 3–5% price deltas. Multiple vetted OSV providers (5–10 per basin) and manageable mobilization ($50k–$200k, 3–7 days) enable switching, while ESG/local rules (CSRD ~50,000 firms) shift costs to suppliers and tighten qualification.
| Metric | 2024 |
|---|---|
| Bid reduction | 8–12% |
| Price delta to win | 3–5% |
| Providers/basin | 5–10 |
| Mobilization | $50k–$200k |
| Onboard time | 3–7 days |
| CSRD impact | ~50,000 firms |
Preview the Actual Deliverable
Tidewater Porter's Five Forces Analysis
This Tidewater Porter’s Five Forces analysis examines supplier and buyer power, competitive rivalry, threat of new entrants, and substitute pressures specific to port operations and maritime logistics. The preview you see is the exact, fully formatted document you’ll receive instantly after purchase—no mockups or placeholders. It’s ready for immediate download and practical use in strategy, valuation, or operational planning.

Don't Miss the Bigger Picture
Tidewater operates in a capital‑intensive shipping support niche where buyer concentration, contract length, and fleet utilization shape margins; suppliers of specialized vessels and skilled crews exert moderate leverage while barriers to entry and substitution remain significant. This brief snapshot only scratches the surface. Unlock the full Porter's Five Forces Analysis to explore Tidewater’s competitive dynamics, market pressures, and strategic advantages in detail.
Suppliers Bargaining Power
Concentrated critical equipment
OSVs depend on engines, DP systems and navigation electronics from a few global OEMs, concentrating supplier power and allowing price increases and longer waits; in 2024 lead times for DP and integrated navigation packages commonly run 6–12 months. Standardization helps interoperability, but type-approval and system integration needs severely restrict switching, and supplier bottlenecks can stall newbuilds and major retrofits.
Shipyard and drydock constraints
Quality shipyards with OSV expertise are finite and regionally concentrated, with China, South Korea and Japan together accounting for roughly 86% of global shipbuilding CGT in 2024, concentrating supplier leverage.
High yard utilization and industry consolidation boost pricing power for newbuilds and life-extensions, especially for specialist OSV work.
Drydock slots and class surveys create time-sensitive demand and scheduling risk that operators pay premiums to avoid.
Fuel and lube volatility
Bunker suppliers are numerous but prices track global oil markets; Brent crude averaged about $86/bbl in 2024, keeping bunkers volatile and margins exposed. IMO-driven shifts to VLSFO and bio-blends tighten effective supply, raising premium and compliance costs. Pass-through clauses in contracts mitigate inflationary impact, yet spot exposure and remote theaters with limited bunkering can concentrate supplier power.
Crewing and specialized labor
DP-certified mariners and offshore-experienced crews became scarce in upcycles; 2024 industry surveys reported crew wage inflation around 10–15% and retention bonuses commonly ranging from $5,000–$20,000, raising operating costs. Training and safety compliance slow substitution, and local content rules further constrain labor pools.
- 10–15% wage inflation in 2024
- Retention bonuses $5k–$20k
- Training & safety restrict substitution
- Local content limits pool
Class, spares, and service networks
Class societies, OEM service partners, and spare-part channels heavily shape lifecycle costs for Tidewater; 2024 industry reports indicate OEM parts markups up to 40% and locked software/warranties increase operator dependence. Geographically uneven service coverage forces premium call-out rates, especially in offshore West Africa and Arctic routes. Downtime risk of $5k–$50k/day amplifies supplier leverage.
- Class certifications drive inspection cadence and costs
- OEM-locks on software/warranties raise switching costs
- Sparse regional support → higher call-out premiums
Supply squeeze: shipyards ~86%, Brent $86/bbl, DP 6-12m, wages +10-15%
Supplier power is high: DP/navigation lead times 6–12 months and OEM parts markups up to 40% raise capex and retrofit costs. Shipyard concentration (China/SK/Japan ~86% CGT in 2024) and high utilization push newbuild premiums. Bunker volatility (Brent ~$86/bbl in 2024) and IMO fuel shifts raise operating costs. Crew shortages drove 10–15% wage inflation and $5k–$20k retention bonuses in 2024.
| Metric | 2024 Value |
|---|---|
| Shipbuilding share (China/SK/Japan) | ~86% |
| Brent crude avg | $86/bbl |
| DP lead times | 6–12 months |
| Wage inflation | 10–15% |
| Retention bonuses | $5k–$20k |
| OEM parts markup | Up to 40% |
What is included in the product
Detailed Word Document
Uncovers key drivers of competition, customer influence, and market entry risks specific to Tidewater, with detailed assessment of supplier and buyer power, substitutes, and rivalry; identifies disruptive threats and barriers protecting incumbents for use in investor materials, strategy decks, or academic work.
Customizable Excel Spreadsheet
A clear, one-sheet Porter's Five Forces for tidewater ports—instantly clarifies competitive and regulatory pressures facing terminals, carriers, and logistics providers. Swap in your data or scenarios to model shifts from new entrants, infrastructure projects, or trade policy with no macros required.
Customers Bargaining Power
Concentrated blue-chip customers
IOC/NOC and large EPC contractors (eg Saudi Aramco, Shell, Exxon, TechnipFMC) dominate Tidewater demand, using scale and procurement sophistication to shape markets. Long-term frame agreements and competitive tenders compress day rates and tighten commercial terms. Strict reputation and HSE credentials act as entry barriers, while buyers routinely bundle multi-region requirements to extract volume discounts.
Tender-driven pricing
Tender-driven pricing in tidewater services boosts price transparency and comparability, with digital tender platforms in 2024 reporting average bid reductions around 8–12% versus negotiated deals. Standardized specifications compress margins unless vessels add clear differentiation such as fuel efficiency or faster turnaround. Options and contract extensions commonly embed rate ceilings, limiting upside. Incumbency helps, but awards frequently pivot on price deltas under 3–5%.
Utilization sensitivity
Buyers in 2024 increasingly timed time charters to project milestones, producing pronounced peaks and troughs in demand and pressuring spot rates. Resulting idle time risk erodes supplier pricing power as owners compete to fill gaps. Seasonality and constrained weather windows, especially in Arctic and hurricane-prone regions, amplify customer negotiation leverage. Long-term contracts exist but remained cyclically scarce in 2024, limiting downside protection.
Switching costs are moderate
Multiple qualified OSV providers operate in major basins; 2024 industry ranges show 5–10 vetted operators per basin, so switching options exist. Mobilization/demobilization and HSE onboarding create friction—typical mobilization costs range from $50,000–$200,000 and onboarding 3–7 days—yet remain manageable. Buyers routinely rotate vessels to match specs, and strong operational KPIs keep incumbent churn low.
- Provider depth: 5–10 per basin (2024)
- Mobilization cost: $50k–$200k (2024)
- Onboarding time: 3–7 days (2024)
- Low churn when KPIs met
ESG and local content demands
Customers now demand lower emissions and demonstrable local participation; the EU CSRD rollout in 2024 expanded ESG obligations to roughly 50,000 firms, pushing compliance costs down supply chains and into supplier pricing. Failure to meet ESG or local content thresholds commonly disqualifies bids, and buyers increasingly weight ESG/local criteria to extract price concessions, guarantees, and performance assurances.
- CSRD 2024: ~50,000 companies impacted
- Compliance costs shifted to suppliers
- ESG/local content can disqualify bids
- Buyers use criteria to extract value
Buyers drive 8-12% bid cuts; awards decided on 3-5% deltas as suppliers absorb ESG costs
Buyers (IOCs/NOCs, large EPCs) exert strong leverage via volume tenders, driving 8–12% average bid reductions in 2024 and awards decided on 3–5% price deltas. Multiple vetted OSV providers (5–10 per basin) and manageable mobilization ($50k–$200k, 3–7 days) enable switching, while ESG/local rules (CSRD ~50,000 firms) shift costs to suppliers and tighten qualification.
| Metric | 2024 |
|---|---|
| Bid reduction | 8–12% |
| Price delta to win | 3–5% |
| Providers/basin | 5–10 |
| Mobilization | $50k–$200k |
| Onboard time | 3–7 days |
| CSRD impact | ~50,000 firms |
Preview the Actual Deliverable
Tidewater Porter's Five Forces Analysis
This Tidewater Porter’s Five Forces analysis examines supplier and buyer power, competitive rivalry, threat of new entrants, and substitute pressures specific to port operations and maritime logistics. The preview you see is the exact, fully formatted document you’ll receive instantly after purchase—no mockups or placeholders. It’s ready for immediate download and practical use in strategy, valuation, or operational planning.
Original: $10.00
-65%$10.00
$3.50Description
Don't Miss the Bigger Picture
Tidewater operates in a capital‑intensive shipping support niche where buyer concentration, contract length, and fleet utilization shape margins; suppliers of specialized vessels and skilled crews exert moderate leverage while barriers to entry and substitution remain significant. This brief snapshot only scratches the surface. Unlock the full Porter's Five Forces Analysis to explore Tidewater’s competitive dynamics, market pressures, and strategic advantages in detail.
Suppliers Bargaining Power
Concentrated critical equipment
OSVs depend on engines, DP systems and navigation electronics from a few global OEMs, concentrating supplier power and allowing price increases and longer waits; in 2024 lead times for DP and integrated navigation packages commonly run 6–12 months. Standardization helps interoperability, but type-approval and system integration needs severely restrict switching, and supplier bottlenecks can stall newbuilds and major retrofits.
Shipyard and drydock constraints
Quality shipyards with OSV expertise are finite and regionally concentrated, with China, South Korea and Japan together accounting for roughly 86% of global shipbuilding CGT in 2024, concentrating supplier leverage.
High yard utilization and industry consolidation boost pricing power for newbuilds and life-extensions, especially for specialist OSV work.
Drydock slots and class surveys create time-sensitive demand and scheduling risk that operators pay premiums to avoid.
Fuel and lube volatility
Bunker suppliers are numerous but prices track global oil markets; Brent crude averaged about $86/bbl in 2024, keeping bunkers volatile and margins exposed. IMO-driven shifts to VLSFO and bio-blends tighten effective supply, raising premium and compliance costs. Pass-through clauses in contracts mitigate inflationary impact, yet spot exposure and remote theaters with limited bunkering can concentrate supplier power.
Crewing and specialized labor
DP-certified mariners and offshore-experienced crews became scarce in upcycles; 2024 industry surveys reported crew wage inflation around 10–15% and retention bonuses commonly ranging from $5,000–$20,000, raising operating costs. Training and safety compliance slow substitution, and local content rules further constrain labor pools.
- 10–15% wage inflation in 2024
- Retention bonuses $5k–$20k
- Training & safety restrict substitution
- Local content limits pool
Class, spares, and service networks
Class societies, OEM service partners, and spare-part channels heavily shape lifecycle costs for Tidewater; 2024 industry reports indicate OEM parts markups up to 40% and locked software/warranties increase operator dependence. Geographically uneven service coverage forces premium call-out rates, especially in offshore West Africa and Arctic routes. Downtime risk of $5k–$50k/day amplifies supplier leverage.
- Class certifications drive inspection cadence and costs
- OEM-locks on software/warranties raise switching costs
- Sparse regional support → higher call-out premiums
Supply squeeze: shipyards ~86%, Brent $86/bbl, DP 6-12m, wages +10-15%
Supplier power is high: DP/navigation lead times 6–12 months and OEM parts markups up to 40% raise capex and retrofit costs. Shipyard concentration (China/SK/Japan ~86% CGT in 2024) and high utilization push newbuild premiums. Bunker volatility (Brent ~$86/bbl in 2024) and IMO fuel shifts raise operating costs. Crew shortages drove 10–15% wage inflation and $5k–$20k retention bonuses in 2024.
| Metric | 2024 Value |
|---|---|
| Shipbuilding share (China/SK/Japan) | ~86% |
| Brent crude avg | $86/bbl |
| DP lead times | 6–12 months |
| Wage inflation | 10–15% |
| Retention bonuses | $5k–$20k |
| OEM parts markup | Up to 40% |
What is included in the product
Detailed Word Document
Uncovers key drivers of competition, customer influence, and market entry risks specific to Tidewater, with detailed assessment of supplier and buyer power, substitutes, and rivalry; identifies disruptive threats and barriers protecting incumbents for use in investor materials, strategy decks, or academic work.
Customizable Excel Spreadsheet
A clear, one-sheet Porter's Five Forces for tidewater ports—instantly clarifies competitive and regulatory pressures facing terminals, carriers, and logistics providers. Swap in your data or scenarios to model shifts from new entrants, infrastructure projects, or trade policy with no macros required.
Customers Bargaining Power
Concentrated blue-chip customers
IOC/NOC and large EPC contractors (eg Saudi Aramco, Shell, Exxon, TechnipFMC) dominate Tidewater demand, using scale and procurement sophistication to shape markets. Long-term frame agreements and competitive tenders compress day rates and tighten commercial terms. Strict reputation and HSE credentials act as entry barriers, while buyers routinely bundle multi-region requirements to extract volume discounts.
Tender-driven pricing
Tender-driven pricing in tidewater services boosts price transparency and comparability, with digital tender platforms in 2024 reporting average bid reductions around 8–12% versus negotiated deals. Standardized specifications compress margins unless vessels add clear differentiation such as fuel efficiency or faster turnaround. Options and contract extensions commonly embed rate ceilings, limiting upside. Incumbency helps, but awards frequently pivot on price deltas under 3–5%.
Utilization sensitivity
Buyers in 2024 increasingly timed time charters to project milestones, producing pronounced peaks and troughs in demand and pressuring spot rates. Resulting idle time risk erodes supplier pricing power as owners compete to fill gaps. Seasonality and constrained weather windows, especially in Arctic and hurricane-prone regions, amplify customer negotiation leverage. Long-term contracts exist but remained cyclically scarce in 2024, limiting downside protection.
Switching costs are moderate
Multiple qualified OSV providers operate in major basins; 2024 industry ranges show 5–10 vetted operators per basin, so switching options exist. Mobilization/demobilization and HSE onboarding create friction—typical mobilization costs range from $50,000–$200,000 and onboarding 3–7 days—yet remain manageable. Buyers routinely rotate vessels to match specs, and strong operational KPIs keep incumbent churn low.
- Provider depth: 5–10 per basin (2024)
- Mobilization cost: $50k–$200k (2024)
- Onboarding time: 3–7 days (2024)
- Low churn when KPIs met
ESG and local content demands
Customers now demand lower emissions and demonstrable local participation; the EU CSRD rollout in 2024 expanded ESG obligations to roughly 50,000 firms, pushing compliance costs down supply chains and into supplier pricing. Failure to meet ESG or local content thresholds commonly disqualifies bids, and buyers increasingly weight ESG/local criteria to extract price concessions, guarantees, and performance assurances.
- CSRD 2024: ~50,000 companies impacted
- Compliance costs shifted to suppliers
- ESG/local content can disqualify bids
- Buyers use criteria to extract value
Buyers drive 8-12% bid cuts; awards decided on 3-5% deltas as suppliers absorb ESG costs
Buyers (IOCs/NOCs, large EPCs) exert strong leverage via volume tenders, driving 8–12% average bid reductions in 2024 and awards decided on 3–5% price deltas. Multiple vetted OSV providers (5–10 per basin) and manageable mobilization ($50k–$200k, 3–7 days) enable switching, while ESG/local rules (CSRD ~50,000 firms) shift costs to suppliers and tighten qualification.
| Metric | 2024 |
|---|---|
| Bid reduction | 8–12% |
| Price delta to win | 3–5% |
| Providers/basin | 5–10 |
| Mobilization | $50k–$200k |
| Onboard time | 3–7 days |
| CSRD impact | ~50,000 firms |
Preview the Actual Deliverable
Tidewater Porter's Five Forces Analysis
This Tidewater Porter’s Five Forces analysis examines supplier and buyer power, competitive rivalry, threat of new entrants, and substitute pressures specific to port operations and maritime logistics. The preview you see is the exact, fully formatted document you’ll receive instantly after purchase—no mockups or placeholders. It’s ready for immediate download and practical use in strategy, valuation, or operational planning.











