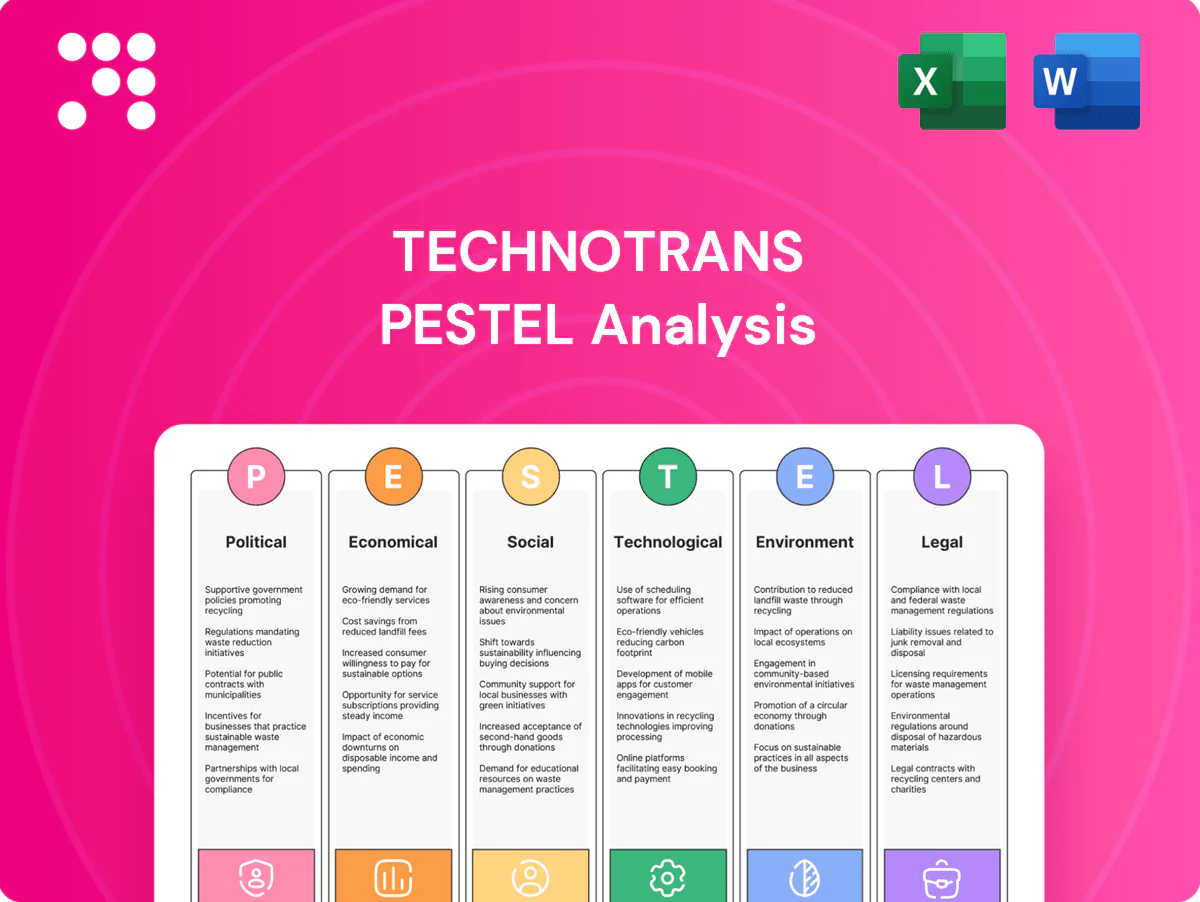
technotrans PESTLE Analysis

Skip the Research. Get the Strategy.
Gain a strategic edge with our PESTLE Analysis tailored to technotrans, revealing how political, economic, social, technological, legal and environmental forces shape its prospects. This concise brief highlights risks and opportunities that matter to investors and strategists. Purchase the full analysis for a detailed, actionable roadmap you can use immediately.
Political factors

EU industrial and energy policy alignment
EU Green Deal targets climate neutrality by 2050 and Fit for 55 mandates a 55% emissions cut by 2030, steering incentives toward efficient thermal management and electrification; NextGenerationEU mobilises €806.9bn of recovery funding supporting national energy-efficiency programs. technotrans can capture subsidies for energy-saving equipment and e-mobility, but compliance and documentation burdens can lengthen sales cycles. Active policy monitoring helps prioritize eligible products and markets.
Subsidies for e-mobility and battery value chain
US Inflation Reduction Act channels about $369 billion into clean energy and EV incentives, while EU battery programs (IPCEI, public support ≈€3.2 billion) and national gigafactory grants expand demand for battery and power-electronic cooling solutions. technotrans can qualify as a supplier to publicly backed gigafactory and charging projects to capture this funded pipeline. Policy shifts or election cycles can cause order volatility. Regional and customer diversification reduces subsidy-driven risk.

Trade policy, tariffs, and localization pressures
Geopolitical tensions have driven tariffs such as US Section 301 measures imposing 7.5–25% duties on many Chinese-origin goods, raising costs for compressors, electronics and metal inputs; regionalization and local content mandates in markets like the US, EU and India favor regional assembly footprints; supplier diversification and selective local production reduce tariff and supply-chain exposure.

Public procurement standards and industrial grants
Public-sector and quasi-public buyers in research, healthcare and utilities require strict energy-performance specs; EU public procurement represents about 14% of GDP, raising tender value. Winning tenders demands certifications and project references and alignment with the F-gas phase-down (79% HFC reduction target by 2030). Horizon Europe (95.5 billion EUR) and national grants co-fund low-GWP cooling R&D; partnerships with institutes improve eligibility.
- Procurement scale: ~14% of EU GDP
- Regulatory target: 79% HFC cut by 2030
- Funding pool: Horizon Europe 95.5 billion EUR
- Key needs: certifications, references, institute partnerships
Political stability and infrastructure reliability
Stable German/EU governance and funding underpin long-term industrial investment and grid modernization; renewables supplied about 50.6% of Germanys electricity in 2023 while the government targets 80% by 2030, but intermittent supply and electrification raise risk to peak power for cooling-heavy operations (Germany peak load ~80 GW). Policy-led upgrades create retrofit market opportunities; risk planning should model energy-availability scenarios.
- Governance: strong investment signals
- Renewables: 50.6% (2023); 80% target by 2030
- Peak risk: ~80 GW demand
- Opportunity: retrofit market from policy upgrades
- Action: include energy-availability scenarios
Policy and funding surge powers demand for efficient cooling, electrification and low-GWP tech
EU Fit for 55 (−55% by 2030) and Green Deal (climate neutrality by 2050) plus NextGenerationEU €806.9bn and US IRA ~$369bn drive demand for efficient cooling, electrification and low‑GWP tech; tariffs, local‑content rules and election cycles raise order volatility; public procurement (~14% of EU GDP) and Horizon Europe €95.5bn fund R&D and tendered projects.
| Metric | Value |
|---|---|
| NextGenerationEU | €806.9bn |
| US IRA | $369bn |
| Horizon Europe | €95.5bn |
| EU public procurement | ~14% GDP |
| HFC cut target | −79% by 2030 |
What is included in the product
 Detailed Word Document
Explores how macro political, economic, social, technological, environmental and legal forces uniquely affect technotrans, with data-backed trends and detailed sub-points tailored to its industry and region. Designed for executives and investors to identify risks, opportunities and actionable scenario insights.

 Customizable Excel Spreadsheet
A concise, visually segmented technotrans PESTLE summary that relieves planning pain points by clarifying external risks, enabling quick sharing, and supporting focused strategy discussions.
Economic factors

Capital expenditure cycles in target industries
Printing, plastics, laser and EV manufacturing are highly capex-driven and cyclical; global electric car sales reached about 14 million units in 2024, supporting demand for production equipment while printing and plastics capex stayed subdued after the 2022–23 downturn. Downturns delay equipment upgrades, upswings push efficiency investments. technotrans can smooth cycles via long-term service contracts and retrofit kits, and a balanced OEM vs aftermarket revenue mix stabilizes cash flow.
Energy price volatility and TCO focus
Soaring energy costs—TTF gas peaked >180 EUR/MWh in 2022 and settled near 40 EUR/MWh in 2024—have pushed technotrans customers to prioritize total cost of ownership, making efficient cooling and temperature-control systems ROI-driven purchases. Transparent payback models (often 2–4 years) now accelerate procurement decisions. Even if energy prices decline and lengthen paybacks, tighter EU efficiency rules (Ecodesign/EPBD updates through 2024–25) sustain baseline demand.

Interest rates and financing availability
Higher policy rates — ECB deposit ~4.00% and Fed funds 5.25–5.50% (mid‑2025) — lift hurdle rates for technotrans factory upgrades and OEM expansions, squeezing ROI thresholds. Offering financing, leasing or performance‑based models reduces capex barriers and accelerates projects. Public green finance from EIB/EU instruments can top up deals. Rate cuts would unlock deferred demand, so pipeline visibility is critical.

Input cost inflation and supply resilience
Input-cost inflation in 2024–25 — with LME copper ~9,500 USD/t, aluminum ~2,300 USD/t and HRC steel €700–800/t — plus tight semiconductor markets (global chip sales ~600 billion USD in 2024) and refrigerant supply constraints press margins; long-term contracts and design-to-cost saved ~3–6% margin erosion. Nearshoring and multi-sourcing cut disruption exposure; price-indexed contracts transfer part of volatility to customers.
- costs: metals, chips, refrigerants drive margin risk
- mitigants: long-term contracts, design-to-cost
- supply strategy: nearshoring + multi-sourcing
- pricing: index-linked contracts share volatility
Exchange rate movements
Exchange rate movements, with EUR/USD around 1.09 in July 2025, directly affect technotrans export competitiveness and the cost of imported components; a stronger euro reduces export margins while a weaker euro raises input costs. Natural hedging through local sourcing and a balanced sales mix mitigates pass-through risk; targeted financial hedges (forwards/options) can stabilise margins. Pricing agility and modular BOMs enable rapid cost recovery and component substitution to manage FX shocks.
- FX-EXPOSURE
- NATURAL-HEDGE
- FINANCIAL-HEDGE
- PRICING-AGILITY
- MODULAR-BOM
Policy and funding surge powers demand for efficient cooling, electrification and low-GWP tech
Technotrans faces cyclical, capex-driven demand (global EV sales ~14m in 2024) while energy volatility and EU efficiency rules sustain equipment ROI focus. Higher rates (ECB ~4%, Fed 5.25–5.50% mid‑2025) and input costs (copper ~9,500 USD/t; aluminium ~2,300 USD/t; HRC €700–800/t) squeeze margins; mitigants include long‑term service, financing, index‑linked pricing and hedging. EUR/USD ~1.09 (Jul 2025) affects export margins; nearshoring and modular BOMs reduce pass‑through risk.
| Metric | 2024–25 | Impact |
|---|---|---|
| EV sales | 14m (2024) | OEM capex demand |
| TTF gas | ~40 EUR/MWh (2024) | Opex/ROI focus |
| ECB rate | ~4% | Higher hurdle rates |
| Copper | ~9,500 USD/t | Input cost pressure |
| EUR/USD | 1.09 (Jul 2025) | FX margin risk |
Preview Before You Purchase
technotrans PESTLE Analysis
The technotrans PESTLE Analysis preview is the exact document you’ll receive after purchase—fully formatted, professionally structured, and ready to use. The content, layout, and insights shown are final with no placeholders or edits needed. After checkout you’ll instantly download this same file.

Skip the Research. Get the Strategy.
Gain a strategic edge with our PESTLE Analysis tailored to technotrans, revealing how political, economic, social, technological, legal and environmental forces shape its prospects. This concise brief highlights risks and opportunities that matter to investors and strategists. Purchase the full analysis for a detailed, actionable roadmap you can use immediately.
Political factors
EU industrial and energy policy alignment
EU Green Deal targets climate neutrality by 2050 and Fit for 55 mandates a 55% emissions cut by 2030, steering incentives toward efficient thermal management and electrification; NextGenerationEU mobilises €806.9bn of recovery funding supporting national energy-efficiency programs. technotrans can capture subsidies for energy-saving equipment and e-mobility, but compliance and documentation burdens can lengthen sales cycles. Active policy monitoring helps prioritize eligible products and markets.
Subsidies for e-mobility and battery value chain
US Inflation Reduction Act channels about $369 billion into clean energy and EV incentives, while EU battery programs (IPCEI, public support ≈€3.2 billion) and national gigafactory grants expand demand for battery and power-electronic cooling solutions. technotrans can qualify as a supplier to publicly backed gigafactory and charging projects to capture this funded pipeline. Policy shifts or election cycles can cause order volatility. Regional and customer diversification reduces subsidy-driven risk.
Trade policy, tariffs, and localization pressures
Geopolitical tensions have driven tariffs such as US Section 301 measures imposing 7.5–25% duties on many Chinese-origin goods, raising costs for compressors, electronics and metal inputs; regionalization and local content mandates in markets like the US, EU and India favor regional assembly footprints; supplier diversification and selective local production reduce tariff and supply-chain exposure.
Public procurement standards and industrial grants
Public-sector and quasi-public buyers in research, healthcare and utilities require strict energy-performance specs; EU public procurement represents about 14% of GDP, raising tender value. Winning tenders demands certifications and project references and alignment with the F-gas phase-down (79% HFC reduction target by 2030). Horizon Europe (95.5 billion EUR) and national grants co-fund low-GWP cooling R&D; partnerships with institutes improve eligibility.
- Procurement scale: ~14% of EU GDP
- Regulatory target: 79% HFC cut by 2030
- Funding pool: Horizon Europe 95.5 billion EUR
- Key needs: certifications, references, institute partnerships
Political stability and infrastructure reliability
Stable German/EU governance and funding underpin long-term industrial investment and grid modernization; renewables supplied about 50.6% of Germanys electricity in 2023 while the government targets 80% by 2030, but intermittent supply and electrification raise risk to peak power for cooling-heavy operations (Germany peak load ~80 GW). Policy-led upgrades create retrofit market opportunities; risk planning should model energy-availability scenarios.
- Governance: strong investment signals
- Renewables: 50.6% (2023); 80% target by 2030
- Peak risk: ~80 GW demand
- Opportunity: retrofit market from policy upgrades
- Action: include energy-availability scenarios
Policy and funding surge powers demand for efficient cooling, electrification and low-GWP tech
EU Fit for 55 (−55% by 2030) and Green Deal (climate neutrality by 2050) plus NextGenerationEU €806.9bn and US IRA ~$369bn drive demand for efficient cooling, electrification and low‑GWP tech; tariffs, local‑content rules and election cycles raise order volatility; public procurement (~14% of EU GDP) and Horizon Europe €95.5bn fund R&D and tendered projects.
| Metric | Value |
|---|---|
| NextGenerationEU | €806.9bn |
| US IRA | $369bn |
| Horizon Europe | €95.5bn |
| EU public procurement | ~14% GDP |
| HFC cut target | −79% by 2030 |
What is included in the product
Detailed Word Document
Explores how macro political, economic, social, technological, environmental and legal forces uniquely affect technotrans, with data-backed trends and detailed sub-points tailored to its industry and region. Designed for executives and investors to identify risks, opportunities and actionable scenario insights.
Customizable Excel Spreadsheet
A concise, visually segmented technotrans PESTLE summary that relieves planning pain points by clarifying external risks, enabling quick sharing, and supporting focused strategy discussions.
Economic factors
Capital expenditure cycles in target industries
Printing, plastics, laser and EV manufacturing are highly capex-driven and cyclical; global electric car sales reached about 14 million units in 2024, supporting demand for production equipment while printing and plastics capex stayed subdued after the 2022–23 downturn. Downturns delay equipment upgrades, upswings push efficiency investments. technotrans can smooth cycles via long-term service contracts and retrofit kits, and a balanced OEM vs aftermarket revenue mix stabilizes cash flow.
Energy price volatility and TCO focus
Soaring energy costs—TTF gas peaked >180 EUR/MWh in 2022 and settled near 40 EUR/MWh in 2024—have pushed technotrans customers to prioritize total cost of ownership, making efficient cooling and temperature-control systems ROI-driven purchases. Transparent payback models (often 2–4 years) now accelerate procurement decisions. Even if energy prices decline and lengthen paybacks, tighter EU efficiency rules (Ecodesign/EPBD updates through 2024–25) sustain baseline demand.
Interest rates and financing availability
Higher policy rates — ECB deposit ~4.00% and Fed funds 5.25–5.50% (mid‑2025) — lift hurdle rates for technotrans factory upgrades and OEM expansions, squeezing ROI thresholds. Offering financing, leasing or performance‑based models reduces capex barriers and accelerates projects. Public green finance from EIB/EU instruments can top up deals. Rate cuts would unlock deferred demand, so pipeline visibility is critical.
Input cost inflation and supply resilience
Input-cost inflation in 2024–25 — with LME copper ~9,500 USD/t, aluminum ~2,300 USD/t and HRC steel €700–800/t — plus tight semiconductor markets (global chip sales ~600 billion USD in 2024) and refrigerant supply constraints press margins; long-term contracts and design-to-cost saved ~3–6% margin erosion. Nearshoring and multi-sourcing cut disruption exposure; price-indexed contracts transfer part of volatility to customers.
- costs: metals, chips, refrigerants drive margin risk
- mitigants: long-term contracts, design-to-cost
- supply strategy: nearshoring + multi-sourcing
- pricing: index-linked contracts share volatility
Exchange rate movements
Exchange rate movements, with EUR/USD around 1.09 in July 2025, directly affect technotrans export competitiveness and the cost of imported components; a stronger euro reduces export margins while a weaker euro raises input costs. Natural hedging through local sourcing and a balanced sales mix mitigates pass-through risk; targeted financial hedges (forwards/options) can stabilise margins. Pricing agility and modular BOMs enable rapid cost recovery and component substitution to manage FX shocks.
- FX-EXPOSURE
- NATURAL-HEDGE
- FINANCIAL-HEDGE
- PRICING-AGILITY
- MODULAR-BOM
Policy and funding surge powers demand for efficient cooling, electrification and low-GWP tech
Technotrans faces cyclical, capex-driven demand (global EV sales ~14m in 2024) while energy volatility and EU efficiency rules sustain equipment ROI focus. Higher rates (ECB ~4%, Fed 5.25–5.50% mid‑2025) and input costs (copper ~9,500 USD/t; aluminium ~2,300 USD/t; HRC €700–800/t) squeeze margins; mitigants include long‑term service, financing, index‑linked pricing and hedging. EUR/USD ~1.09 (Jul 2025) affects export margins; nearshoring and modular BOMs reduce pass‑through risk.
| Metric | 2024–25 | Impact |
|---|---|---|
| EV sales | 14m (2024) | OEM capex demand |
| TTF gas | ~40 EUR/MWh (2024) | Opex/ROI focus |
| ECB rate | ~4% | Higher hurdle rates |
| Copper | ~9,500 USD/t | Input cost pressure |
| EUR/USD | 1.09 (Jul 2025) | FX margin risk |
Preview Before You Purchase
technotrans PESTLE Analysis
The technotrans PESTLE Analysis preview is the exact document you’ll receive after purchase—fully formatted, professionally structured, and ready to use. The content, layout, and insights shown are final with no placeholders or edits needed. After checkout you’ll instantly download this same file.
Original: $10.00
-65%$10.00
$3.50Description
Skip the Research. Get the Strategy.
Gain a strategic edge with our PESTLE Analysis tailored to technotrans, revealing how political, economic, social, technological, legal and environmental forces shape its prospects. This concise brief highlights risks and opportunities that matter to investors and strategists. Purchase the full analysis for a detailed, actionable roadmap you can use immediately.
Political factors
EU industrial and energy policy alignment
EU Green Deal targets climate neutrality by 2050 and Fit for 55 mandates a 55% emissions cut by 2030, steering incentives toward efficient thermal management and electrification; NextGenerationEU mobilises €806.9bn of recovery funding supporting national energy-efficiency programs. technotrans can capture subsidies for energy-saving equipment and e-mobility, but compliance and documentation burdens can lengthen sales cycles. Active policy monitoring helps prioritize eligible products and markets.
Subsidies for e-mobility and battery value chain
US Inflation Reduction Act channels about $369 billion into clean energy and EV incentives, while EU battery programs (IPCEI, public support ≈€3.2 billion) and national gigafactory grants expand demand for battery and power-electronic cooling solutions. technotrans can qualify as a supplier to publicly backed gigafactory and charging projects to capture this funded pipeline. Policy shifts or election cycles can cause order volatility. Regional and customer diversification reduces subsidy-driven risk.
Trade policy, tariffs, and localization pressures
Geopolitical tensions have driven tariffs such as US Section 301 measures imposing 7.5–25% duties on many Chinese-origin goods, raising costs for compressors, electronics and metal inputs; regionalization and local content mandates in markets like the US, EU and India favor regional assembly footprints; supplier diversification and selective local production reduce tariff and supply-chain exposure.
Public procurement standards and industrial grants
Public-sector and quasi-public buyers in research, healthcare and utilities require strict energy-performance specs; EU public procurement represents about 14% of GDP, raising tender value. Winning tenders demands certifications and project references and alignment with the F-gas phase-down (79% HFC reduction target by 2030). Horizon Europe (95.5 billion EUR) and national grants co-fund low-GWP cooling R&D; partnerships with institutes improve eligibility.
- Procurement scale: ~14% of EU GDP
- Regulatory target: 79% HFC cut by 2030
- Funding pool: Horizon Europe 95.5 billion EUR
- Key needs: certifications, references, institute partnerships
Political stability and infrastructure reliability
Stable German/EU governance and funding underpin long-term industrial investment and grid modernization; renewables supplied about 50.6% of Germanys electricity in 2023 while the government targets 80% by 2030, but intermittent supply and electrification raise risk to peak power for cooling-heavy operations (Germany peak load ~80 GW). Policy-led upgrades create retrofit market opportunities; risk planning should model energy-availability scenarios.
- Governance: strong investment signals
- Renewables: 50.6% (2023); 80% target by 2030
- Peak risk: ~80 GW demand
- Opportunity: retrofit market from policy upgrades
- Action: include energy-availability scenarios
Policy and funding surge powers demand for efficient cooling, electrification and low-GWP tech
EU Fit for 55 (−55% by 2030) and Green Deal (climate neutrality by 2050) plus NextGenerationEU €806.9bn and US IRA ~$369bn drive demand for efficient cooling, electrification and low‑GWP tech; tariffs, local‑content rules and election cycles raise order volatility; public procurement (~14% of EU GDP) and Horizon Europe €95.5bn fund R&D and tendered projects.
| Metric | Value |
|---|---|
| NextGenerationEU | €806.9bn |
| US IRA | $369bn |
| Horizon Europe | €95.5bn |
| EU public procurement | ~14% GDP |
| HFC cut target | −79% by 2030 |
What is included in the product
Detailed Word Document
Explores how macro political, economic, social, technological, environmental and legal forces uniquely affect technotrans, with data-backed trends and detailed sub-points tailored to its industry and region. Designed for executives and investors to identify risks, opportunities and actionable scenario insights.
Customizable Excel Spreadsheet
A concise, visually segmented technotrans PESTLE summary that relieves planning pain points by clarifying external risks, enabling quick sharing, and supporting focused strategy discussions.
Economic factors
Capital expenditure cycles in target industries
Printing, plastics, laser and EV manufacturing are highly capex-driven and cyclical; global electric car sales reached about 14 million units in 2024, supporting demand for production equipment while printing and plastics capex stayed subdued after the 2022–23 downturn. Downturns delay equipment upgrades, upswings push efficiency investments. technotrans can smooth cycles via long-term service contracts and retrofit kits, and a balanced OEM vs aftermarket revenue mix stabilizes cash flow.
Energy price volatility and TCO focus
Soaring energy costs—TTF gas peaked >180 EUR/MWh in 2022 and settled near 40 EUR/MWh in 2024—have pushed technotrans customers to prioritize total cost of ownership, making efficient cooling and temperature-control systems ROI-driven purchases. Transparent payback models (often 2–4 years) now accelerate procurement decisions. Even if energy prices decline and lengthen paybacks, tighter EU efficiency rules (Ecodesign/EPBD updates through 2024–25) sustain baseline demand.
Interest rates and financing availability
Higher policy rates — ECB deposit ~4.00% and Fed funds 5.25–5.50% (mid‑2025) — lift hurdle rates for technotrans factory upgrades and OEM expansions, squeezing ROI thresholds. Offering financing, leasing or performance‑based models reduces capex barriers and accelerates projects. Public green finance from EIB/EU instruments can top up deals. Rate cuts would unlock deferred demand, so pipeline visibility is critical.
Input cost inflation and supply resilience
Input-cost inflation in 2024–25 — with LME copper ~9,500 USD/t, aluminum ~2,300 USD/t and HRC steel €700–800/t — plus tight semiconductor markets (global chip sales ~600 billion USD in 2024) and refrigerant supply constraints press margins; long-term contracts and design-to-cost saved ~3–6% margin erosion. Nearshoring and multi-sourcing cut disruption exposure; price-indexed contracts transfer part of volatility to customers.
- costs: metals, chips, refrigerants drive margin risk
- mitigants: long-term contracts, design-to-cost
- supply strategy: nearshoring + multi-sourcing
- pricing: index-linked contracts share volatility
Exchange rate movements
Exchange rate movements, with EUR/USD around 1.09 in July 2025, directly affect technotrans export competitiveness and the cost of imported components; a stronger euro reduces export margins while a weaker euro raises input costs. Natural hedging through local sourcing and a balanced sales mix mitigates pass-through risk; targeted financial hedges (forwards/options) can stabilise margins. Pricing agility and modular BOMs enable rapid cost recovery and component substitution to manage FX shocks.
- FX-EXPOSURE
- NATURAL-HEDGE
- FINANCIAL-HEDGE
- PRICING-AGILITY
- MODULAR-BOM
Policy and funding surge powers demand for efficient cooling, electrification and low-GWP tech
Technotrans faces cyclical, capex-driven demand (global EV sales ~14m in 2024) while energy volatility and EU efficiency rules sustain equipment ROI focus. Higher rates (ECB ~4%, Fed 5.25–5.50% mid‑2025) and input costs (copper ~9,500 USD/t; aluminium ~2,300 USD/t; HRC €700–800/t) squeeze margins; mitigants include long‑term service, financing, index‑linked pricing and hedging. EUR/USD ~1.09 (Jul 2025) affects export margins; nearshoring and modular BOMs reduce pass‑through risk.
| Metric | 2024–25 | Impact |
|---|---|---|
| EV sales | 14m (2024) | OEM capex demand |
| TTF gas | ~40 EUR/MWh (2024) | Opex/ROI focus |
| ECB rate | ~4% | Higher hurdle rates |
| Copper | ~9,500 USD/t | Input cost pressure |
| EUR/USD | 1.09 (Jul 2025) | FX margin risk |
Preview Before You Purchase
technotrans PESTLE Analysis
The technotrans PESTLE Analysis preview is the exact document you’ll receive after purchase—fully formatted, professionally structured, and ready to use. The content, layout, and insights shown are final with no placeholders or edits needed. After checkout you’ll instantly download this same file.











