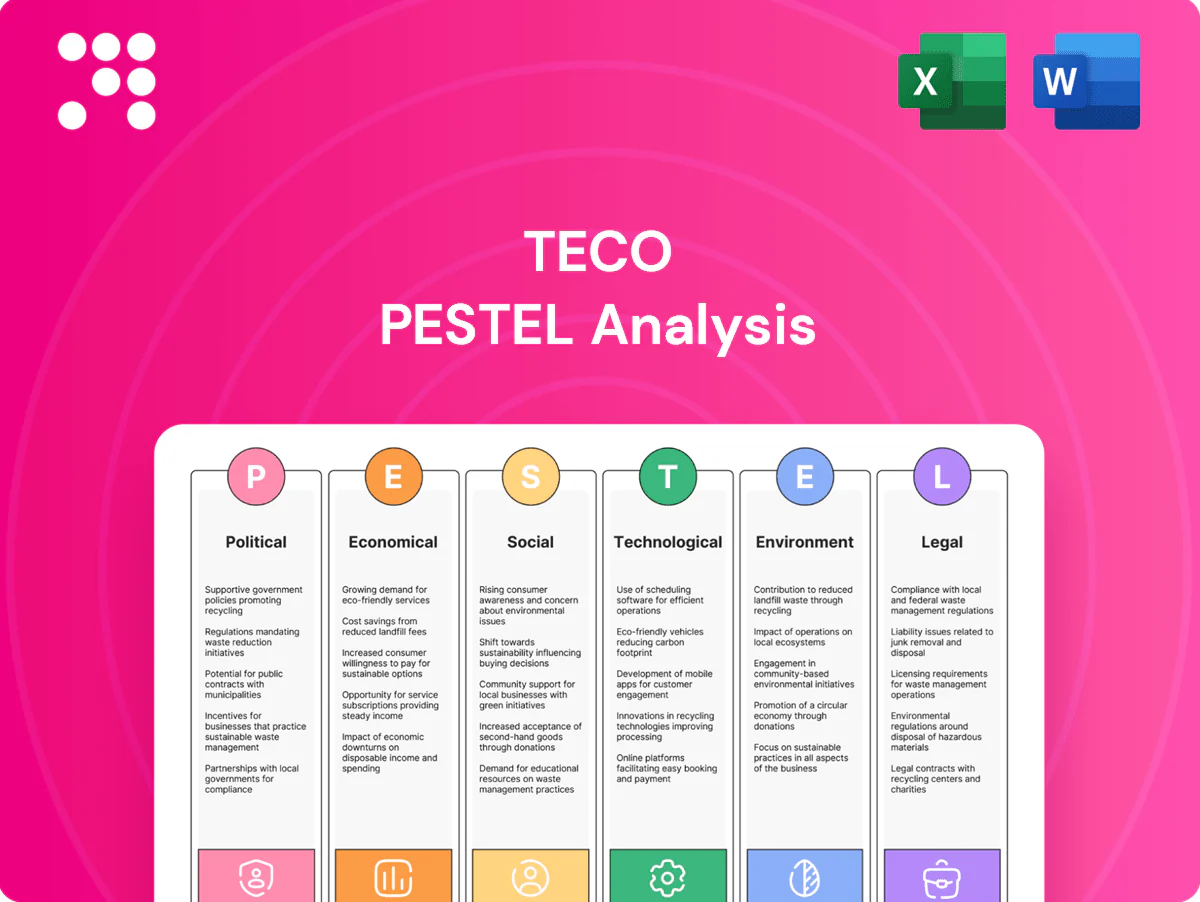
TECO PESTLE Analysis

Plan Smarter. Present Sharper. Compete Stronger.
Unlock strategic clarity with our targeted PESTLE Analysis of TECO—three concise sections reveal how political, economic, social, technological, legal and environmental forces shape its outlook. Ideal for investors and strategists seeking actionable intelligence. Purchase the full report for the complete, editable deep-dive and make smarter decisions today.
Political factors

Geopolitical tensions and cross-strait risk
TECO, headquartered in Taipei, Taiwan, faces exposure to cross-strait tensions that can disrupt supply chains, investor sentiment, and logistics across the 130 km Taiwan Strait. Heightened military or diplomatic friction can raise insurance, inventory carrying and compliance costs, stressing margins and working capital. Business continuity planning and diversified manufacturing footprints reduce disruption risk, while engagement with multi-market partners lowers single-country concentration. Taiwan holds roughly 63% of global semiconductor foundry capacity, amplifying regional supply-chain sensitivity.
Industrial and renewable energy subsidies
Global incentives for wind, solar and grid modernization—notably the US Inflation Reduction Act's roughly 369 billion USD clean-energy package—boost demand for TECO's integrated solutions and accelerate pipelines via tax credits, feed-in tariffs and green procurement. Policy reversals or subsidy cliffs can create demand volatility. TECO should align bids and capacity planning to jurisdiction-specific incentive timelines.

Trade policy, tariffs, and localization
Tariffs on electrical machinery — including US Section 301 duties reaching up to 25% on affected imports — directly raise TECO’s cost-to-serve and compress pricing flexibility.
Localization mandates in the US, EU and India plus India’s PLI schemes (about INR 6,238 crore for white goods) push TECO toward local assembly and sourcing to capture incentives.
Optimization of rules-of-origin under FTAs and strategic plant placement/supplier qualification can unlock duty savings and materially cut tariff exposure ahead of EU CBAM full implementation in 2026.

Public infrastructure and energy security agendas
Government investment in grids, rail, and water—highlighted by the US Bipartisan Infrastructure Law which allocates about 65 billion dollars for grid and power infrastructure—boosts demand for motors, drives, and automation that align with TECO’s product lines. Energy security policies globally prioritize domestic generation, storage, and efficiency, directly expanding markets for TECO’s motors, generators, and power-electronics. Public tenders increasingly mandate technical and sustainability standards, so strengthening government-relations capabilities improves visibility into multi-year pipelines and award criteria.
- Grids/rail/water spend: major public programs (eg, US $65B grid)
- Energy security focus: storage and efficiency = core TECO addressable market
- Tenders: stricter technical/sustainability compliance
- GR capability: raises pipeline visibility and bid success
Standards harmonization and political stability
Political stability in operating markets enables predictable permitting and faster standards adoption, supporting long-term manufacturing and project planning; IEA 2024 estimates motor-driven systems account for about 45% of global electricity use, underscoring market importance.
- Divergent national standards increase SKU and certification costs
- ISO has 167 member bodies—engagement shapes requirements
- Stable regimes cut project delays and contract risk
Cross-strait tensions, tariffs and localization lift supply costs as US clean-energy demand booms
Cross-strait tensions, tariffs (US Section 301 up to 25%), and localization mandates (India PLI INR 6,238 crore) raise supply-chain, compliance and cost risks for TECO; Taiwan holds ~63% of global foundry capacity. Clean-energy incentives (US IRA ~369 billion USD) and US infrastructure grid spend ~65 billion USD expand demand; IEA 2024: motor-driven systems ≈45% of global electricity use.
| Factor | Impact | Key stat |
|---|---|---|
| Cross-strait risk | Supply/logistics | 63% foundry |
| Tariffs/localization | Cost/compliance | 25% duties; INR 6,238cr PLI |
| Policy demand | Market growth | IRA $369B; $65B grid |
What is included in the product
 Detailed Word Document
Explores how Political, Economic, Social, Technological, Environmental and Legal forces uniquely impact TECO, with data-backed, region- and industry-specific insights; designed for executives and advisors to identify threats, opportunities and forward-looking scenarios, ready for business plans, pitch decks and strategic decision-making.

 Customizable Excel Spreadsheet
A concise, visually segmented TECO PESTLE summary that can be dropped into presentations, shared across teams for rapid alignment, and used to support risk and market-positioning discussions during planning sessions.
Economic factors

Global capex cycle and industrial production
TECO’s sales track manufacturing PMI, which averaged near 50 (neutral) in 2024–H1 2025, and fixed-investment in key markets slowed to low single-digit growth, compressing orders for motors, drives and automation retrofits. Slowdowns shave discretionary capex but counter-cyclical services and aftermarket parts provide recurring revenue that smooths top line. Geographic diversification across Taiwan, China, Americas and EMEA cushions regional downturns.
Input costs: copper, steel, rare earths
Volatility in copper and electrical steel prices compresses margins on motors and transformers, while rare-earth magnets for high-efficiency motors face concentrated supply risk—China accounted for ~58% of global rare-earth production in 2023 (USGS). Hedging, design optimization and multi-sourcing mitigate shocks, and transparent pass-through pricing stabilizes TECO’s profitability.

Currency and interest rate dynamics
FX swings—TWD moved roughly 3–5% vs USD in 2024 while EUR and CNY volatility persisted—directly shift TECO export competitiveness and translated earnings. Global policy rates (Fed funds ~5.25–5.50% mid‑2025, ECB ~4%) lift project financing spreads by 200–300bps, delaying renewable orders. Local sourcing and customer‑currency pricing act as natural hedges; strong cash buffers preserve flexibility through tighter credit cycles.

Energy prices and efficiency ROI
High electricity prices strengthen the case for IE3/IE4 motors and VFDs: US industrial rates ~8¢/kWh (EIA 2023) and EU industrial €0.12–0.18/kWh (Eurostat 2023) make retrofit paybacks commonly fall into the 1–3 year range, accelerating TECO’s efficiency portfolio, while low prices can defer upgrades.
- Benefit: faster payback, higher sales
- Risk: low energy prices delay projects
- Mitigation: bundled financing + performance guarantees sustain momentum
Urbanization and emerging market growth
Urbanization—UN projects 2.5 billion more urban residents by 2050—plus rapid infrastructure, water, HVAC and transit expansion drives strong motor and automation demand; global HVAC market ~USD 200–210bn in 2023 with ~6% CAGR supports growth. Emerging markets show ~4.5% GDP growth in 2024 vs 1.5% for advanced economies but carry higher credit and execution risks; local partners and tiered product lines improve bids and price fit.
- Urbanization: +2.5bn by 2050
- HVAC market: ~USD200–210bn (2023), ~6% CAGR
- EM growth: ~4.5% (2024) vs 1.5% advanced
- Mitigation: local partnerships, service networks, tiered products
Cross-strait tensions, tariffs and localization lift supply costs as US clean-energy demand booms
TECO sales track manufacturing PMI ~50 (2024–H1 2025); discretionary capex slowed, aftermarket and services smooth revenue. Copper/steel and rare‑earths (China ~58% 2023) pressure margins; hedging and pass‑through pricing mitigate. FX (TWD ±3–5% vs USD in 2024) and higher rates (Fed ~5.25–5.50% mid‑2025) lift financing costs. High power prices (US ~8¢/kWh; EU €0.12–0.18/kWh) shorten retrofit paybacks to 1–3 years.
| Metric | Value |
|---|---|
| Manufacturing PMI | ~50 (2024–H1 2025) |
| Rare‑earth share (China) | ~58% (2023) |
| Fed funds | ~5.25–5.50% (mid‑2025) |
| US industrial power | ~8¢/kWh (EIA 2023) |
Preview the Actual Deliverable
TECO PESTLE Analysis
The preview shown here is the exact TECO PESTLE Analysis document you’ll receive after purchase—fully formatted and ready to use. It contains the full political, economic, social, technological, legal, and environmental assessment as displayed. No placeholders or teasers—this is the final file available for immediate download.

Plan Smarter. Present Sharper. Compete Stronger.
Unlock strategic clarity with our targeted PESTLE Analysis of TECO—three concise sections reveal how political, economic, social, technological, legal and environmental forces shape its outlook. Ideal for investors and strategists seeking actionable intelligence. Purchase the full report for the complete, editable deep-dive and make smarter decisions today.
Political factors
Geopolitical tensions and cross-strait risk
TECO, headquartered in Taipei, Taiwan, faces exposure to cross-strait tensions that can disrupt supply chains, investor sentiment, and logistics across the 130 km Taiwan Strait. Heightened military or diplomatic friction can raise insurance, inventory carrying and compliance costs, stressing margins and working capital. Business continuity planning and diversified manufacturing footprints reduce disruption risk, while engagement with multi-market partners lowers single-country concentration. Taiwan holds roughly 63% of global semiconductor foundry capacity, amplifying regional supply-chain sensitivity.
Industrial and renewable energy subsidies
Global incentives for wind, solar and grid modernization—notably the US Inflation Reduction Act's roughly 369 billion USD clean-energy package—boost demand for TECO's integrated solutions and accelerate pipelines via tax credits, feed-in tariffs and green procurement. Policy reversals or subsidy cliffs can create demand volatility. TECO should align bids and capacity planning to jurisdiction-specific incentive timelines.
Trade policy, tariffs, and localization
Tariffs on electrical machinery — including US Section 301 duties reaching up to 25% on affected imports — directly raise TECO’s cost-to-serve and compress pricing flexibility.
Localization mandates in the US, EU and India plus India’s PLI schemes (about INR 6,238 crore for white goods) push TECO toward local assembly and sourcing to capture incentives.
Optimization of rules-of-origin under FTAs and strategic plant placement/supplier qualification can unlock duty savings and materially cut tariff exposure ahead of EU CBAM full implementation in 2026.
Public infrastructure and energy security agendas
Government investment in grids, rail, and water—highlighted by the US Bipartisan Infrastructure Law which allocates about 65 billion dollars for grid and power infrastructure—boosts demand for motors, drives, and automation that align with TECO’s product lines. Energy security policies globally prioritize domestic generation, storage, and efficiency, directly expanding markets for TECO’s motors, generators, and power-electronics. Public tenders increasingly mandate technical and sustainability standards, so strengthening government-relations capabilities improves visibility into multi-year pipelines and award criteria.
- Grids/rail/water spend: major public programs (eg, US $65B grid)
- Energy security focus: storage and efficiency = core TECO addressable market
- Tenders: stricter technical/sustainability compliance
- GR capability: raises pipeline visibility and bid success
Standards harmonization and political stability
Political stability in operating markets enables predictable permitting and faster standards adoption, supporting long-term manufacturing and project planning; IEA 2024 estimates motor-driven systems account for about 45% of global electricity use, underscoring market importance.
- Divergent national standards increase SKU and certification costs
- ISO has 167 member bodies—engagement shapes requirements
- Stable regimes cut project delays and contract risk
Cross-strait tensions, tariffs and localization lift supply costs as US clean-energy demand booms
Cross-strait tensions, tariffs (US Section 301 up to 25%), and localization mandates (India PLI INR 6,238 crore) raise supply-chain, compliance and cost risks for TECO; Taiwan holds ~63% of global foundry capacity. Clean-energy incentives (US IRA ~369 billion USD) and US infrastructure grid spend ~65 billion USD expand demand; IEA 2024: motor-driven systems ≈45% of global electricity use.
| Factor | Impact | Key stat |
|---|---|---|
| Cross-strait risk | Supply/logistics | 63% foundry |
| Tariffs/localization | Cost/compliance | 25% duties; INR 6,238cr PLI |
| Policy demand | Market growth | IRA $369B; $65B grid |
What is included in the product
Detailed Word Document
Explores how Political, Economic, Social, Technological, Environmental and Legal forces uniquely impact TECO, with data-backed, region- and industry-specific insights; designed for executives and advisors to identify threats, opportunities and forward-looking scenarios, ready for business plans, pitch decks and strategic decision-making.
Customizable Excel Spreadsheet
A concise, visually segmented TECO PESTLE summary that can be dropped into presentations, shared across teams for rapid alignment, and used to support risk and market-positioning discussions during planning sessions.
Economic factors
Global capex cycle and industrial production
TECO’s sales track manufacturing PMI, which averaged near 50 (neutral) in 2024–H1 2025, and fixed-investment in key markets slowed to low single-digit growth, compressing orders for motors, drives and automation retrofits. Slowdowns shave discretionary capex but counter-cyclical services and aftermarket parts provide recurring revenue that smooths top line. Geographic diversification across Taiwan, China, Americas and EMEA cushions regional downturns.
Input costs: copper, steel, rare earths
Volatility in copper and electrical steel prices compresses margins on motors and transformers, while rare-earth magnets for high-efficiency motors face concentrated supply risk—China accounted for ~58% of global rare-earth production in 2023 (USGS). Hedging, design optimization and multi-sourcing mitigate shocks, and transparent pass-through pricing stabilizes TECO’s profitability.
Currency and interest rate dynamics
FX swings—TWD moved roughly 3–5% vs USD in 2024 while EUR and CNY volatility persisted—directly shift TECO export competitiveness and translated earnings. Global policy rates (Fed funds ~5.25–5.50% mid‑2025, ECB ~4%) lift project financing spreads by 200–300bps, delaying renewable orders. Local sourcing and customer‑currency pricing act as natural hedges; strong cash buffers preserve flexibility through tighter credit cycles.
Energy prices and efficiency ROI
High electricity prices strengthen the case for IE3/IE4 motors and VFDs: US industrial rates ~8¢/kWh (EIA 2023) and EU industrial €0.12–0.18/kWh (Eurostat 2023) make retrofit paybacks commonly fall into the 1–3 year range, accelerating TECO’s efficiency portfolio, while low prices can defer upgrades.
- Benefit: faster payback, higher sales
- Risk: low energy prices delay projects
- Mitigation: bundled financing + performance guarantees sustain momentum
Urbanization and emerging market growth
Urbanization—UN projects 2.5 billion more urban residents by 2050—plus rapid infrastructure, water, HVAC and transit expansion drives strong motor and automation demand; global HVAC market ~USD 200–210bn in 2023 with ~6% CAGR supports growth. Emerging markets show ~4.5% GDP growth in 2024 vs 1.5% for advanced economies but carry higher credit and execution risks; local partners and tiered product lines improve bids and price fit.
- Urbanization: +2.5bn by 2050
- HVAC market: ~USD200–210bn (2023), ~6% CAGR
- EM growth: ~4.5% (2024) vs 1.5% advanced
- Mitigation: local partnerships, service networks, tiered products
Cross-strait tensions, tariffs and localization lift supply costs as US clean-energy demand booms
TECO sales track manufacturing PMI ~50 (2024–H1 2025); discretionary capex slowed, aftermarket and services smooth revenue. Copper/steel and rare‑earths (China ~58% 2023) pressure margins; hedging and pass‑through pricing mitigate. FX (TWD ±3–5% vs USD in 2024) and higher rates (Fed ~5.25–5.50% mid‑2025) lift financing costs. High power prices (US ~8¢/kWh; EU €0.12–0.18/kWh) shorten retrofit paybacks to 1–3 years.
| Metric | Value |
|---|---|
| Manufacturing PMI | ~50 (2024–H1 2025) |
| Rare‑earth share (China) | ~58% (2023) |
| Fed funds | ~5.25–5.50% (mid‑2025) |
| US industrial power | ~8¢/kWh (EIA 2023) |
Preview the Actual Deliverable
TECO PESTLE Analysis
The preview shown here is the exact TECO PESTLE Analysis document you’ll receive after purchase—fully formatted and ready to use. It contains the full political, economic, social, technological, legal, and environmental assessment as displayed. No placeholders or teasers—this is the final file available for immediate download.
Original: $10.00
-65%$10.00
$3.50Description
Plan Smarter. Present Sharper. Compete Stronger.
Unlock strategic clarity with our targeted PESTLE Analysis of TECO—three concise sections reveal how political, economic, social, technological, legal and environmental forces shape its outlook. Ideal for investors and strategists seeking actionable intelligence. Purchase the full report for the complete, editable deep-dive and make smarter decisions today.
Political factors
Geopolitical tensions and cross-strait risk
TECO, headquartered in Taipei, Taiwan, faces exposure to cross-strait tensions that can disrupt supply chains, investor sentiment, and logistics across the 130 km Taiwan Strait. Heightened military or diplomatic friction can raise insurance, inventory carrying and compliance costs, stressing margins and working capital. Business continuity planning and diversified manufacturing footprints reduce disruption risk, while engagement with multi-market partners lowers single-country concentration. Taiwan holds roughly 63% of global semiconductor foundry capacity, amplifying regional supply-chain sensitivity.
Industrial and renewable energy subsidies
Global incentives for wind, solar and grid modernization—notably the US Inflation Reduction Act's roughly 369 billion USD clean-energy package—boost demand for TECO's integrated solutions and accelerate pipelines via tax credits, feed-in tariffs and green procurement. Policy reversals or subsidy cliffs can create demand volatility. TECO should align bids and capacity planning to jurisdiction-specific incentive timelines.
Trade policy, tariffs, and localization
Tariffs on electrical machinery — including US Section 301 duties reaching up to 25% on affected imports — directly raise TECO’s cost-to-serve and compress pricing flexibility.
Localization mandates in the US, EU and India plus India’s PLI schemes (about INR 6,238 crore for white goods) push TECO toward local assembly and sourcing to capture incentives.
Optimization of rules-of-origin under FTAs and strategic plant placement/supplier qualification can unlock duty savings and materially cut tariff exposure ahead of EU CBAM full implementation in 2026.
Public infrastructure and energy security agendas
Government investment in grids, rail, and water—highlighted by the US Bipartisan Infrastructure Law which allocates about 65 billion dollars for grid and power infrastructure—boosts demand for motors, drives, and automation that align with TECO’s product lines. Energy security policies globally prioritize domestic generation, storage, and efficiency, directly expanding markets for TECO’s motors, generators, and power-electronics. Public tenders increasingly mandate technical and sustainability standards, so strengthening government-relations capabilities improves visibility into multi-year pipelines and award criteria.
- Grids/rail/water spend: major public programs (eg, US $65B grid)
- Energy security focus: storage and efficiency = core TECO addressable market
- Tenders: stricter technical/sustainability compliance
- GR capability: raises pipeline visibility and bid success
Standards harmonization and political stability
Political stability in operating markets enables predictable permitting and faster standards adoption, supporting long-term manufacturing and project planning; IEA 2024 estimates motor-driven systems account for about 45% of global electricity use, underscoring market importance.
- Divergent national standards increase SKU and certification costs
- ISO has 167 member bodies—engagement shapes requirements
- Stable regimes cut project delays and contract risk
Cross-strait tensions, tariffs and localization lift supply costs as US clean-energy demand booms
Cross-strait tensions, tariffs (US Section 301 up to 25%), and localization mandates (India PLI INR 6,238 crore) raise supply-chain, compliance and cost risks for TECO; Taiwan holds ~63% of global foundry capacity. Clean-energy incentives (US IRA ~369 billion USD) and US infrastructure grid spend ~65 billion USD expand demand; IEA 2024: motor-driven systems ≈45% of global electricity use.
| Factor | Impact | Key stat |
|---|---|---|
| Cross-strait risk | Supply/logistics | 63% foundry |
| Tariffs/localization | Cost/compliance | 25% duties; INR 6,238cr PLI |
| Policy demand | Market growth | IRA $369B; $65B grid |
What is included in the product
Detailed Word Document
Explores how Political, Economic, Social, Technological, Environmental and Legal forces uniquely impact TECO, with data-backed, region- and industry-specific insights; designed for executives and advisors to identify threats, opportunities and forward-looking scenarios, ready for business plans, pitch decks and strategic decision-making.
Customizable Excel Spreadsheet
A concise, visually segmented TECO PESTLE summary that can be dropped into presentations, shared across teams for rapid alignment, and used to support risk and market-positioning discussions during planning sessions.
Economic factors
Global capex cycle and industrial production
TECO’s sales track manufacturing PMI, which averaged near 50 (neutral) in 2024–H1 2025, and fixed-investment in key markets slowed to low single-digit growth, compressing orders for motors, drives and automation retrofits. Slowdowns shave discretionary capex but counter-cyclical services and aftermarket parts provide recurring revenue that smooths top line. Geographic diversification across Taiwan, China, Americas and EMEA cushions regional downturns.
Input costs: copper, steel, rare earths
Volatility in copper and electrical steel prices compresses margins on motors and transformers, while rare-earth magnets for high-efficiency motors face concentrated supply risk—China accounted for ~58% of global rare-earth production in 2023 (USGS). Hedging, design optimization and multi-sourcing mitigate shocks, and transparent pass-through pricing stabilizes TECO’s profitability.
Currency and interest rate dynamics
FX swings—TWD moved roughly 3–5% vs USD in 2024 while EUR and CNY volatility persisted—directly shift TECO export competitiveness and translated earnings. Global policy rates (Fed funds ~5.25–5.50% mid‑2025, ECB ~4%) lift project financing spreads by 200–300bps, delaying renewable orders. Local sourcing and customer‑currency pricing act as natural hedges; strong cash buffers preserve flexibility through tighter credit cycles.
Energy prices and efficiency ROI
High electricity prices strengthen the case for IE3/IE4 motors and VFDs: US industrial rates ~8¢/kWh (EIA 2023) and EU industrial €0.12–0.18/kWh (Eurostat 2023) make retrofit paybacks commonly fall into the 1–3 year range, accelerating TECO’s efficiency portfolio, while low prices can defer upgrades.
- Benefit: faster payback, higher sales
- Risk: low energy prices delay projects
- Mitigation: bundled financing + performance guarantees sustain momentum
Urbanization and emerging market growth
Urbanization—UN projects 2.5 billion more urban residents by 2050—plus rapid infrastructure, water, HVAC and transit expansion drives strong motor and automation demand; global HVAC market ~USD 200–210bn in 2023 with ~6% CAGR supports growth. Emerging markets show ~4.5% GDP growth in 2024 vs 1.5% for advanced economies but carry higher credit and execution risks; local partners and tiered product lines improve bids and price fit.
- Urbanization: +2.5bn by 2050
- HVAC market: ~USD200–210bn (2023), ~6% CAGR
- EM growth: ~4.5% (2024) vs 1.5% advanced
- Mitigation: local partnerships, service networks, tiered products
Cross-strait tensions, tariffs and localization lift supply costs as US clean-energy demand booms
TECO sales track manufacturing PMI ~50 (2024–H1 2025); discretionary capex slowed, aftermarket and services smooth revenue. Copper/steel and rare‑earths (China ~58% 2023) pressure margins; hedging and pass‑through pricing mitigate. FX (TWD ±3–5% vs USD in 2024) and higher rates (Fed ~5.25–5.50% mid‑2025) lift financing costs. High power prices (US ~8¢/kWh; EU €0.12–0.18/kWh) shorten retrofit paybacks to 1–3 years.
| Metric | Value |
|---|---|
| Manufacturing PMI | ~50 (2024–H1 2025) |
| Rare‑earth share (China) | ~58% (2023) |
| Fed funds | ~5.25–5.50% (mid‑2025) |
| US industrial power | ~8¢/kWh (EIA 2023) |
Preview the Actual Deliverable
TECO PESTLE Analysis
The preview shown here is the exact TECO PESTLE Analysis document you’ll receive after purchase—fully formatted and ready to use. It contains the full political, economic, social, technological, legal, and environmental assessment as displayed. No placeholders or teasers—this is the final file available for immediate download.











