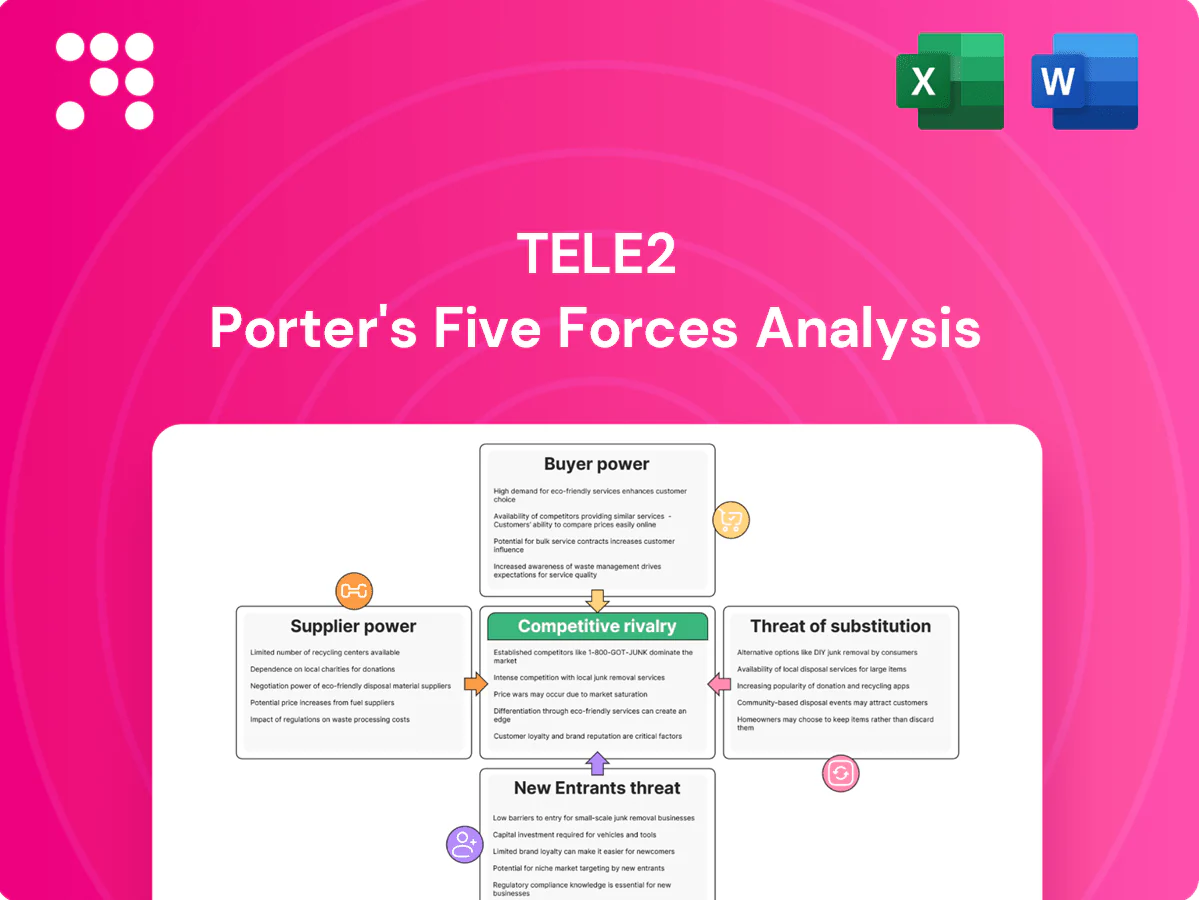
Tele2 Porter's Five Forces Analysis

Go Beyond the Preview—Access the Full Strategic Report
Tele2 faces moderate competitive pressure from established telcos, rising buyer expectations for bundled services, and steady supplier influence on network costs, while regulatory and substitute threats shape strategic choices. This snapshot highlights key tensions but only scratches the surface. Unlock the full Porter's Five Forces Analysis to explore Tele2’s competitive dynamics and actionable implications in depth.
Suppliers Bargaining Power

Concentrated network vendors
Radio and core kit is concentrated: the top three OEMs accounted for roughly 80% of global RAN revenue in 2024, raising tangible switching costs and vendor leverage. Long certification cycles of c.12–24 months and interoperability constraints lock carriers into vendor roadmaps. 5G/5G‑SA rollouts and tightened security vetting in 2024 further entrench dependence. Multi‑vendor approaches reduce risk but add complexity and ~10–20% higher integration costs.
Spectrum and tower dependency
Governments control spectrum licensing, pricing and renewal terms, directly shaping Tele2s cost base and strategic planning. Tower companies and passive infrastructure providers set site access and lease rates, limiting operator bargaining leverage. Rural coverage obligations can shift leverage toward regulators, raising rollout costs. Network sharing reduces capex but creates operational co-dependency with peers and towercos.

Backhaul, fiber, and peering
Wholesale fiber/backhaul suppliers can exert pricing power where routes are scarce; in 2024 EU FTTP coverage reached roughly 60%, leaving last-mile and key routes concentrated in certain operators. Peering and transit deals materially affect latency and unit data costs for broadband and mobile data, impacting margins. In smaller Baltic markets with limited alternative routes supplier leverage rises, while building own fiber reduces this risk but requires significant capex and multi-year payback.

Handset and device ecosystems
Flagship handset makers drive bundle economics and promotional cadence, pushing handset subsidies that impact ARPU and churn; limited availability of hot models in 2024 constrained promotional offers and made churn management harder. eSIM provisioning (supported by over 200 operators in 2024) creates new platform and OS dependencies, while IoT module/chipset concentration raises supplier risk in B2B solutions.
- Flagship influence on bundle pricing and promotions
- Model scarcity limits offer flexibility and churn control
- eSIM: >200 operators (2024) => platform lock-in
- IoT modules/chipsets concentrate supplier power in B2B
Content and platform partners
Content and platform partners (TV rights holders, OTTs, cloud providers) strongly shape Tele2s packaging and ARPU: exclusive TV/streaming rights command premiums and rigid terms, OTT scale (Netflix ~260M paid subscribers in 2024) increases bargaining leverage, and cloud spend concentration (Gartner: public cloud services ~$597.3B in 2024) raises fixed costs and negotiation pressure.
- Exclusive rights: premium fees, rigid terms
- Revenue-sharing/min guarantees: shifts risk to operator
- Bundling: raises perceived value but can compress margins
- Cloud partners: scale drives cost baselines
High supplier power: RAN top‑3 ≈80%, cloud $597.3B
Supplier power is high: top‑3 RAN OEMs held ~80% of revenue in 2024, with 12–24 month certification cycles and vendor lock‑in. Spectrum, tower leases and wholesale fiber (EU FTTP ~60% in 2024) further limit Tele2s leverage. Handset, eSIM (>200 operators in 2024), OTT (Netflix ~260M) and cloud ($597.3B public cloud spend 2024) concentration compress margins.
| Supplier | 2024 metric |
|---|---|
| RAN OEMs | Top‑3 ≈80% |
| EU FTTP | ≈60% |
| eSIM | >200 operators |
| Cloud | $597.3B |
What is included in the product
 Detailed Word Document
Tailored Porter's Five Forces analysis for Tele2 uncovering competitive drivers, buyer and supplier power, entry barriers, substitutes, and disruptive threats, with strategic commentary to inform investors, advisors, and management.

 Customizable Excel Spreadsheet
Clear one-sheet Porter's Five Forces for Tele2—instantly identify where competitive pressure hurts and apply tailored relief actions, with customizable scores and a ready-to-use radar chart for decks or workshops.
Customers Bargaining Power

High price sensitivity
Residential users in mature Nordic/Baltic markets are highly value-driven, with mobile penetration exceeding 120% in 2024, prompting intense price comparison through transparent tariffs and frequent promotions. The widespread shift to unlimited data plans compresses differentiation to service quality and network performance. Elastic demand intensifies pressure on ARPU, forcing shorter promotional cycles and heavier reliance on bundles for retention.
Low switching costs
Mobile number portability enables rapid churn, often same-day or within one working day in EU markets, lowering lock-in. SIM/eSIM activation and online onboarding cut friction—GSMA reported eSIM device shipments exceeding 1 billion by 2024. Converged bundles can improve retention but rivals quickly mirror offers, so loyalty hinges more on coverage, speeds and CX than contractual barriers.

Enterprise procurement strength
Business and public-sector tenders concentrate buying power, with public procurement accounting for about 14% of EU GDP (European Commission, 2024), forcing suppliers to compete on price and scale. Multi-year enterprise contracts routinely demand steep volume discounts, strict SLAs and bespoke integration work. Bundles for unified communications, IoT and security are negotiated aggressively to drive down unit ARPU. Cross-border roaming and global connectivity needs add operational complexity and rebate pressure on margins.

MVNO and wholesale buyers
MVNOs and resellers can secure favorable wholesale rates from Tele2, particularly at scale, boosting network utilization while constraining retail margin expansion; in Europe MVNOs represented roughly 12% of mobile subscriptions in 2024, increasing bargaining leverage.
Contract renewals present risk of step-down pricing and volume rebates; where regulation allows, Tele2 uses quality-of-service tiering to defend value and sustain higher wholesale ARPU.
- Volume leverage: higher bargaining power
- Margin cap: wholesale deals lower retail margins
- Renewal risk: potential price step-downs
- QoS tiering: preserves premium pricing
Digital-savvy customers
Digital-savvy customers compare Tele2 plans via aggregators and social reviews, with 70% of Nordic consumers using online comparison tools in 2024, forcing transparent pricing and clear bundles. Self-service apps set standardized expectations for instant support and plan flexibility, making poor digital UX a rapid churn driver. Tele2 must continually refresh value-for-money positioning to retain price-sensitive segments.
ARPU hit: >120% pen, 70% use comparison tools
Customers exert strong price and service pressure: Nordic mobile penetration >120% (2024) and 70% use comparison tools, pushing ARPU down; eSIMs >1bn shipments lower churn friction; MVNOs ~12% subscription share and public procurement ~14% of EU GDP concentrate buying power, forcing discounts and SLAs.
| Metric | 2024 | Impact |
|---|---|---|
| Mobile penetration | >120% | High price sensitivity |
| Comparison tool use | 70% | Transparent pricing |
| eSIM shipments | >1bn | Lower churn |
| MVNO share | ~12% | Retail margin pressure |
| Public procurement | ~14% EU GDP | Bulk discounting |
Preview Before You Purchase
Tele2 Porter's Five Forces Analysis
This preview shows the exact Tele2 Porter's Five Forces Analysis you'll receive immediately after purchase—no surprises or placeholders. The document displayed is the full, professionally formatted analysis, ready for download and use the moment you buy. You're looking at the actual deliverable; once payment is complete, you'll get instant access to this identical file.

Go Beyond the Preview—Access the Full Strategic Report
Tele2 faces moderate competitive pressure from established telcos, rising buyer expectations for bundled services, and steady supplier influence on network costs, while regulatory and substitute threats shape strategic choices. This snapshot highlights key tensions but only scratches the surface. Unlock the full Porter's Five Forces Analysis to explore Tele2’s competitive dynamics and actionable implications in depth.
Suppliers Bargaining Power
Concentrated network vendors
Radio and core kit is concentrated: the top three OEMs accounted for roughly 80% of global RAN revenue in 2024, raising tangible switching costs and vendor leverage. Long certification cycles of c.12–24 months and interoperability constraints lock carriers into vendor roadmaps. 5G/5G‑SA rollouts and tightened security vetting in 2024 further entrench dependence. Multi‑vendor approaches reduce risk but add complexity and ~10–20% higher integration costs.
Spectrum and tower dependency
Governments control spectrum licensing, pricing and renewal terms, directly shaping Tele2s cost base and strategic planning. Tower companies and passive infrastructure providers set site access and lease rates, limiting operator bargaining leverage. Rural coverage obligations can shift leverage toward regulators, raising rollout costs. Network sharing reduces capex but creates operational co-dependency with peers and towercos.
Backhaul, fiber, and peering
Wholesale fiber/backhaul suppliers can exert pricing power where routes are scarce; in 2024 EU FTTP coverage reached roughly 60%, leaving last-mile and key routes concentrated in certain operators. Peering and transit deals materially affect latency and unit data costs for broadband and mobile data, impacting margins. In smaller Baltic markets with limited alternative routes supplier leverage rises, while building own fiber reduces this risk but requires significant capex and multi-year payback.
Handset and device ecosystems
Flagship handset makers drive bundle economics and promotional cadence, pushing handset subsidies that impact ARPU and churn; limited availability of hot models in 2024 constrained promotional offers and made churn management harder. eSIM provisioning (supported by over 200 operators in 2024) creates new platform and OS dependencies, while IoT module/chipset concentration raises supplier risk in B2B solutions.
- Flagship influence on bundle pricing and promotions
- Model scarcity limits offer flexibility and churn control
- eSIM: >200 operators (2024) => platform lock-in
- IoT modules/chipsets concentrate supplier power in B2B
Content and platform partners
Content and platform partners (TV rights holders, OTTs, cloud providers) strongly shape Tele2s packaging and ARPU: exclusive TV/streaming rights command premiums and rigid terms, OTT scale (Netflix ~260M paid subscribers in 2024) increases bargaining leverage, and cloud spend concentration (Gartner: public cloud services ~$597.3B in 2024) raises fixed costs and negotiation pressure.
- Exclusive rights: premium fees, rigid terms
- Revenue-sharing/min guarantees: shifts risk to operator
- Bundling: raises perceived value but can compress margins
- Cloud partners: scale drives cost baselines
High supplier power: RAN top‑3 ≈80%, cloud $597.3B
Supplier power is high: top‑3 RAN OEMs held ~80% of revenue in 2024, with 12–24 month certification cycles and vendor lock‑in. Spectrum, tower leases and wholesale fiber (EU FTTP ~60% in 2024) further limit Tele2s leverage. Handset, eSIM (>200 operators in 2024), OTT (Netflix ~260M) and cloud ($597.3B public cloud spend 2024) concentration compress margins.
| Supplier | 2024 metric |
|---|---|
| RAN OEMs | Top‑3 ≈80% |
| EU FTTP | ≈60% |
| eSIM | >200 operators |
| Cloud | $597.3B |
What is included in the product
Detailed Word Document
Tailored Porter's Five Forces analysis for Tele2 uncovering competitive drivers, buyer and supplier power, entry barriers, substitutes, and disruptive threats, with strategic commentary to inform investors, advisors, and management.
Customizable Excel Spreadsheet
Clear one-sheet Porter's Five Forces for Tele2—instantly identify where competitive pressure hurts and apply tailored relief actions, with customizable scores and a ready-to-use radar chart for decks or workshops.
Customers Bargaining Power
High price sensitivity
Residential users in mature Nordic/Baltic markets are highly value-driven, with mobile penetration exceeding 120% in 2024, prompting intense price comparison through transparent tariffs and frequent promotions. The widespread shift to unlimited data plans compresses differentiation to service quality and network performance. Elastic demand intensifies pressure on ARPU, forcing shorter promotional cycles and heavier reliance on bundles for retention.
Low switching costs
Mobile number portability enables rapid churn, often same-day or within one working day in EU markets, lowering lock-in. SIM/eSIM activation and online onboarding cut friction—GSMA reported eSIM device shipments exceeding 1 billion by 2024. Converged bundles can improve retention but rivals quickly mirror offers, so loyalty hinges more on coverage, speeds and CX than contractual barriers.
Enterprise procurement strength
Business and public-sector tenders concentrate buying power, with public procurement accounting for about 14% of EU GDP (European Commission, 2024), forcing suppliers to compete on price and scale. Multi-year enterprise contracts routinely demand steep volume discounts, strict SLAs and bespoke integration work. Bundles for unified communications, IoT and security are negotiated aggressively to drive down unit ARPU. Cross-border roaming and global connectivity needs add operational complexity and rebate pressure on margins.
MVNO and wholesale buyers
MVNOs and resellers can secure favorable wholesale rates from Tele2, particularly at scale, boosting network utilization while constraining retail margin expansion; in Europe MVNOs represented roughly 12% of mobile subscriptions in 2024, increasing bargaining leverage.
Contract renewals present risk of step-down pricing and volume rebates; where regulation allows, Tele2 uses quality-of-service tiering to defend value and sustain higher wholesale ARPU.
- Volume leverage: higher bargaining power
- Margin cap: wholesale deals lower retail margins
- Renewal risk: potential price step-downs
- QoS tiering: preserves premium pricing
Digital-savvy customers
Digital-savvy customers compare Tele2 plans via aggregators and social reviews, with 70% of Nordic consumers using online comparison tools in 2024, forcing transparent pricing and clear bundles. Self-service apps set standardized expectations for instant support and plan flexibility, making poor digital UX a rapid churn driver. Tele2 must continually refresh value-for-money positioning to retain price-sensitive segments.
ARPU hit: >120% pen, 70% use comparison tools
Customers exert strong price and service pressure: Nordic mobile penetration >120% (2024) and 70% use comparison tools, pushing ARPU down; eSIMs >1bn shipments lower churn friction; MVNOs ~12% subscription share and public procurement ~14% of EU GDP concentrate buying power, forcing discounts and SLAs.
| Metric | 2024 | Impact |
|---|---|---|
| Mobile penetration | >120% | High price sensitivity |
| Comparison tool use | 70% | Transparent pricing |
| eSIM shipments | >1bn | Lower churn |
| MVNO share | ~12% | Retail margin pressure |
| Public procurement | ~14% EU GDP | Bulk discounting |
Preview Before You Purchase
Tele2 Porter's Five Forces Analysis
This preview shows the exact Tele2 Porter's Five Forces Analysis you'll receive immediately after purchase—no surprises or placeholders. The document displayed is the full, professionally formatted analysis, ready for download and use the moment you buy. You're looking at the actual deliverable; once payment is complete, you'll get instant access to this identical file.
Description
Go Beyond the Preview—Access the Full Strategic Report
Tele2 faces moderate competitive pressure from established telcos, rising buyer expectations for bundled services, and steady supplier influence on network costs, while regulatory and substitute threats shape strategic choices. This snapshot highlights key tensions but only scratches the surface. Unlock the full Porter's Five Forces Analysis to explore Tele2’s competitive dynamics and actionable implications in depth.
Suppliers Bargaining Power
Concentrated network vendors
Radio and core kit is concentrated: the top three OEMs accounted for roughly 80% of global RAN revenue in 2024, raising tangible switching costs and vendor leverage. Long certification cycles of c.12–24 months and interoperability constraints lock carriers into vendor roadmaps. 5G/5G‑SA rollouts and tightened security vetting in 2024 further entrench dependence. Multi‑vendor approaches reduce risk but add complexity and ~10–20% higher integration costs.
Spectrum and tower dependency
Governments control spectrum licensing, pricing and renewal terms, directly shaping Tele2s cost base and strategic planning. Tower companies and passive infrastructure providers set site access and lease rates, limiting operator bargaining leverage. Rural coverage obligations can shift leverage toward regulators, raising rollout costs. Network sharing reduces capex but creates operational co-dependency with peers and towercos.
Backhaul, fiber, and peering
Wholesale fiber/backhaul suppliers can exert pricing power where routes are scarce; in 2024 EU FTTP coverage reached roughly 60%, leaving last-mile and key routes concentrated in certain operators. Peering and transit deals materially affect latency and unit data costs for broadband and mobile data, impacting margins. In smaller Baltic markets with limited alternative routes supplier leverage rises, while building own fiber reduces this risk but requires significant capex and multi-year payback.
Handset and device ecosystems
Flagship handset makers drive bundle economics and promotional cadence, pushing handset subsidies that impact ARPU and churn; limited availability of hot models in 2024 constrained promotional offers and made churn management harder. eSIM provisioning (supported by over 200 operators in 2024) creates new platform and OS dependencies, while IoT module/chipset concentration raises supplier risk in B2B solutions.
- Flagship influence on bundle pricing and promotions
- Model scarcity limits offer flexibility and churn control
- eSIM: >200 operators (2024) => platform lock-in
- IoT modules/chipsets concentrate supplier power in B2B
Content and platform partners
Content and platform partners (TV rights holders, OTTs, cloud providers) strongly shape Tele2s packaging and ARPU: exclusive TV/streaming rights command premiums and rigid terms, OTT scale (Netflix ~260M paid subscribers in 2024) increases bargaining leverage, and cloud spend concentration (Gartner: public cloud services ~$597.3B in 2024) raises fixed costs and negotiation pressure.
- Exclusive rights: premium fees, rigid terms
- Revenue-sharing/min guarantees: shifts risk to operator
- Bundling: raises perceived value but can compress margins
- Cloud partners: scale drives cost baselines
High supplier power: RAN top‑3 ≈80%, cloud $597.3B
Supplier power is high: top‑3 RAN OEMs held ~80% of revenue in 2024, with 12–24 month certification cycles and vendor lock‑in. Spectrum, tower leases and wholesale fiber (EU FTTP ~60% in 2024) further limit Tele2s leverage. Handset, eSIM (>200 operators in 2024), OTT (Netflix ~260M) and cloud ($597.3B public cloud spend 2024) concentration compress margins.
| Supplier | 2024 metric |
|---|---|
| RAN OEMs | Top‑3 ≈80% |
| EU FTTP | ≈60% |
| eSIM | >200 operators |
| Cloud | $597.3B |
What is included in the product
Detailed Word Document
Tailored Porter's Five Forces analysis for Tele2 uncovering competitive drivers, buyer and supplier power, entry barriers, substitutes, and disruptive threats, with strategic commentary to inform investors, advisors, and management.
Customizable Excel Spreadsheet
Clear one-sheet Porter's Five Forces for Tele2—instantly identify where competitive pressure hurts and apply tailored relief actions, with customizable scores and a ready-to-use radar chart for decks or workshops.
Customers Bargaining Power
High price sensitivity
Residential users in mature Nordic/Baltic markets are highly value-driven, with mobile penetration exceeding 120% in 2024, prompting intense price comparison through transparent tariffs and frequent promotions. The widespread shift to unlimited data plans compresses differentiation to service quality and network performance. Elastic demand intensifies pressure on ARPU, forcing shorter promotional cycles and heavier reliance on bundles for retention.
Low switching costs
Mobile number portability enables rapid churn, often same-day or within one working day in EU markets, lowering lock-in. SIM/eSIM activation and online onboarding cut friction—GSMA reported eSIM device shipments exceeding 1 billion by 2024. Converged bundles can improve retention but rivals quickly mirror offers, so loyalty hinges more on coverage, speeds and CX than contractual barriers.
Enterprise procurement strength
Business and public-sector tenders concentrate buying power, with public procurement accounting for about 14% of EU GDP (European Commission, 2024), forcing suppliers to compete on price and scale. Multi-year enterprise contracts routinely demand steep volume discounts, strict SLAs and bespoke integration work. Bundles for unified communications, IoT and security are negotiated aggressively to drive down unit ARPU. Cross-border roaming and global connectivity needs add operational complexity and rebate pressure on margins.
MVNO and wholesale buyers
MVNOs and resellers can secure favorable wholesale rates from Tele2, particularly at scale, boosting network utilization while constraining retail margin expansion; in Europe MVNOs represented roughly 12% of mobile subscriptions in 2024, increasing bargaining leverage.
Contract renewals present risk of step-down pricing and volume rebates; where regulation allows, Tele2 uses quality-of-service tiering to defend value and sustain higher wholesale ARPU.
- Volume leverage: higher bargaining power
- Margin cap: wholesale deals lower retail margins
- Renewal risk: potential price step-downs
- QoS tiering: preserves premium pricing
Digital-savvy customers
Digital-savvy customers compare Tele2 plans via aggregators and social reviews, with 70% of Nordic consumers using online comparison tools in 2024, forcing transparent pricing and clear bundles. Self-service apps set standardized expectations for instant support and plan flexibility, making poor digital UX a rapid churn driver. Tele2 must continually refresh value-for-money positioning to retain price-sensitive segments.
ARPU hit: >120% pen, 70% use comparison tools
Customers exert strong price and service pressure: Nordic mobile penetration >120% (2024) and 70% use comparison tools, pushing ARPU down; eSIMs >1bn shipments lower churn friction; MVNOs ~12% subscription share and public procurement ~14% of EU GDP concentrate buying power, forcing discounts and SLAs.
| Metric | 2024 | Impact |
|---|---|---|
| Mobile penetration | >120% | High price sensitivity |
| Comparison tool use | 70% | Transparent pricing |
| eSIM shipments | >1bn | Lower churn |
| MVNO share | ~12% | Retail margin pressure |
| Public procurement | ~14% EU GDP | Bulk discounting |
Preview Before You Purchase
Tele2 Porter's Five Forces Analysis
This preview shows the exact Tele2 Porter's Five Forces Analysis you'll receive immediately after purchase—no surprises or placeholders. The document displayed is the full, professionally formatted analysis, ready for download and use the moment you buy. You're looking at the actual deliverable; once payment is complete, you'll get instant access to this identical file.











