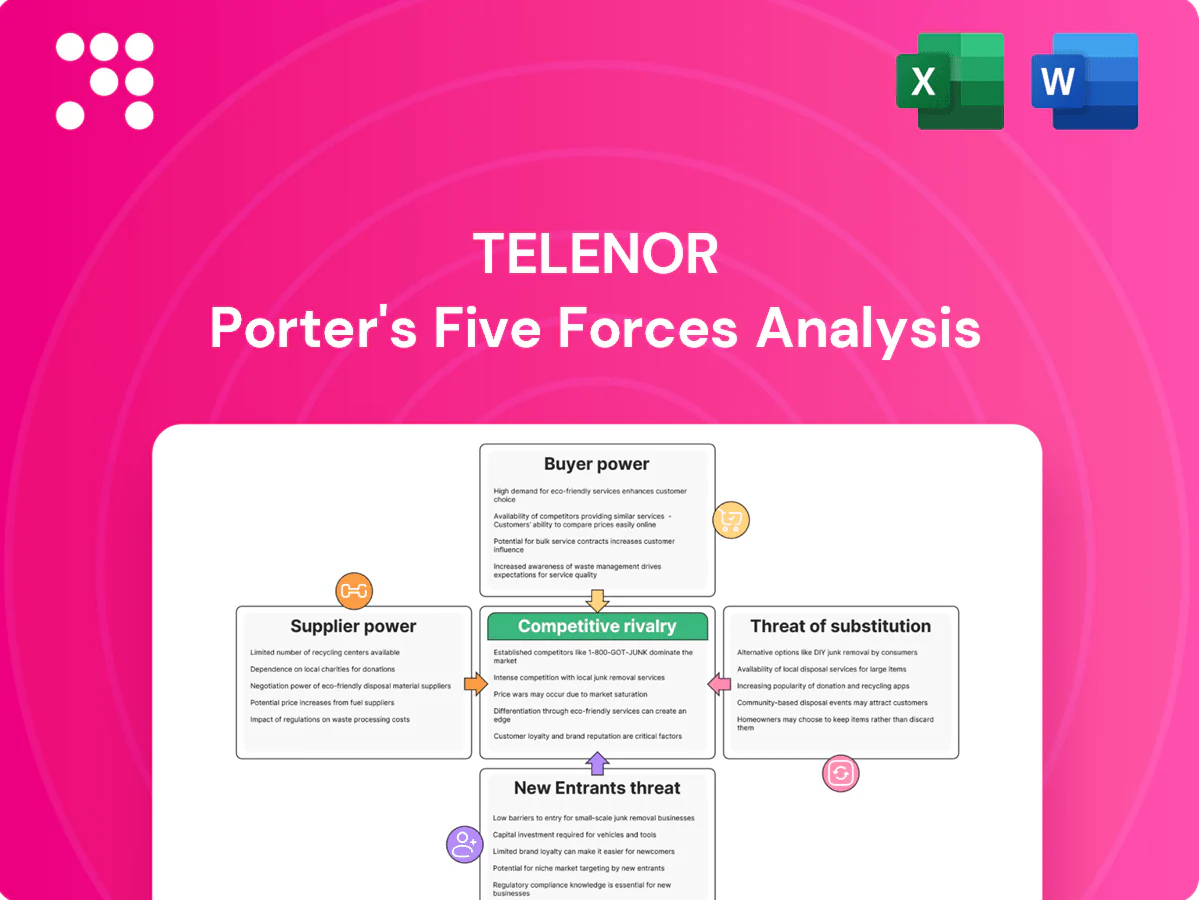
Telenor Porter's Five Forces Analysis

A Must-Have Tool for Decision-Makers
Telenor's Porter's Five Forces reveals moderate buyer power, high competitive rivalry, and regulatory pressures shaping margins. Supplier and substitute threats vary by market, while barriers to entry remain significant in core Nordic operations. This brief snapshot only scratches the surface. Unlock the full Porter's Five Forces Analysis to explore Telenor’s competitive dynamics in detail.
Suppliers Bargaining Power

RAN and core vendors concentrated
Network equipment is concentrated: Ericsson and Nokia together account for roughly half of global RAN revenue (2023–24), creating high switching costs and vendor leverage; certification and interoperability cycles commonly run 18–36 months, locking in architectures. Telenor’s scale—about 176 million subscribers across Nordics and Asia—helps negotiate better terms, while multi-vendor and Open RAN trials are beginning to temper pricing power.
Spectrum holders and regulators pivotal
Governments control spectrum allocation and license terms, directly shaping operators' cost structures and long-term margins; Nordic 5G auctions in recent cycles have typically attracted roughly €1–2bn per market, underscoring meaningful supplier leverage. Renewal schedules, coverage obligations and reserve prices can raise effective supplier power by front-loading costs and forcing higher bid strategies. Policy stability in the Nordics mitigates this risk, while select Asian markets show regulatory uncertainty and variable reserve pricing. Active auction participation and targeted advocacy help Telenor optimize spectrum outcomes and cost predictability.

Towercos and fiber wholesalers influence access
Towercos and fiber wholesalers can set lease prices and escalation clauses, directly impacting OPEX and capex recovery for operators.
5G urban densification increases site dependency—estimates suggest 3–4x more small cells—raising supplier bargaining exposure.
Long-term master service agreements and co-location can cut unit site costs by an estimated 20–40%, while Telenor’s owned sites and JV structures provide countervailing negotiation leverage.

IT/cloud platforms and OSS/BSS vendors
Migration to public cloud and reliance on key OSS/BSS stacks increase vendor stickiness; data portability and compliance (GDPR) constrain rapid switching, while Telenor’s scale—about 170 million subscribers in 2024—enables co-development and stronger SLAs.
- Vendor stickiness: cloud + OSS/BSS
- Constraints: data portability, GDPR
- Flexibility: modular APIs, exit rights
- Leverage: scale → co-development, better SLAs
Device makers and SIM/eSIM ecosystem
Handset OEMs strongly shape device availability, 5G feature timing and subsidy pressure; Apple and Samsung accounted for roughly 70 percent of the European premium smartphone market in 2024, driving rollout cadence and retail subsidy demands.
eSIM cuts physical logistics and SIM churn but transfers leverage to platform enablement and onboarding ecosystems; GSMA reported about 600 million eSIM profiles active worldwide in 2024.
Telenor's multi-OEM sourcing and bundling/financing partnerships diffuse single-vendor risk and distribute subsidy impacts across partners, helping protect service EBITDA.
Concentrated suppliers, device power and 5G densification boost OPEX and switching costs
Supplier power is high: Ericsson+Nokia ~50% global RAN (2023–24) and vendor certification cycles (18–36 months) raise switching costs. Telenor scale (~170–176M subs in 2024) and multi-vendor/Open RAN trials mitigate leverage. Tower/fiber lease inflation and 5G densification (3–4x small cells) raise OPEX exposure. OEMs (Apple+Samsung ~70% EU premium, 2024) and eSIM (~600M profiles, 2024) concentrate device power.
| Metric | Value (2023–24/2024) |
|---|---|
| RAN share (Ericsson+Nokia) | ~50% |
| Telenor subs | ~170–176M |
| EU premium OEMs | ~70% |
| eSIM profiles | ~600M |
| Small-cell increase | 3–4x |
What is included in the product
 Detailed Word Document
Uncovers competitive drivers, supplier and buyer bargaining power, entry barriers, substitutes and rivalry shaping Telenor’s pricing, margins and strategic positioning, highlighting regulatory and disruptive threats to inform investor and strategic decisions.

 Customizable Excel Spreadsheet
One-sheet Telenor Porter’s Five Forces summary—visualizes competitive pressure, entry threats, and supplier/buyer power for fast strategic decisions.
Customers Bargaining Power

High price transparency and low switching costs
High price transparency makes mobile plans easily comparable, raising price sensitivity among consumers and pressuring margins. Number portability is available in over 80% of markets (ITU, 2024), materially lowering friction to churn. Promotions and family bundles temporarily reduce switching but require frequent refresh to retain ARPU, while digital channels and comparison sites amplify shopper price comparison.
Enterprise and public sector negotiation clout
In 2024 enterprise and public sector clients across Telenor markets exert strong bargaining power, demanding bespoke SLAs, advanced security and IoT solutions that often extract meaningful pricing concessions. Multi‑year contracts (commonly 3–5 years) increase customer stickiness but compress margins and defer upside. Cross‑selling ICT and managed services raises average account value, while frequent competitive bidding cycles intensify buyer leverage.

Prepaid base in Asia is elastic
Prepaid customers in Asia are highly price- and perception-sensitive; prepaid connections account for over 70% of subscriptions in the region (GSMA 2024), meaning small ARPU (typically USD 2–5/month in parts of South/Southeast Asia, GSMA 2024) scales into substantial aggregate leverage. App-based top-ups and OTT bundle promotions now steer purchase choices, while loyalty rewards and micro-segmentation raise retention.

Quality-of-service expectations rising
5G, fiber and streaming have driven QoS expectations higher; by end-2024 global 5G subscriptions surpassed 2 billion (GSMA), making speed and reliability primary churn drivers as poor QoS quickly triggers downgrades or switches. Telenor can justify premium tiers via network-leadership messaging, while real-time care and digital self-service lower dissatisfaction and churn.
- 5G adoption: >2 billion (2024, GSMA)
- QoS = churn trigger
- Premium tiers justifyable
- Real-time care + self-service reduce churn
Convergence buyers seek bundle value
Convergence buyers demand bundle value: fixed-mobile-TV packages increase lock-in but drive demands for bundle discounts, squeezing unit margins as households assess the total bill; value-added services such as security and cloud storage can raise perceived value and ARPU. Contract tenures of 12–24 months and common 24-month device financing materially reduce churn.
- Contract tenure: 12–24 months
- Device financing: typically 24 months
- Bundles raise retention but increase discount pressure
>80% portability, >70% prepaid (Asia) and USD2-5 ARPU raise churn and margin pressure
High price transparency and >80% number portability (ITU 2024) amplify churn and price sensitivity, pressuring margins. Enterprise buyers demand SLAs/IoT discounts, while prepaid (Asia >70% subscriptions, GSMA 2024) and ARPU pressure (USD 2–5/mo in parts of SE Asia, GSMA 2024) increase customer leverage. 5G >2bn subs (GSMA 2024) raises QoS expectations; 12–24m contracts and 24m device financing partially lock customers.
| Metric | 2024 figure |
|---|---|
| Number portability | >80% (ITU 2024) |
| 5G subscriptions | >2 billion (GSMA 2024) |
| Prepaid share (Asia) | >70% (GSMA 2024) |
| Typical contract tenure | 12–24 months |
| Device financing | 24 months |
Preview the Actual Deliverable
Telenor Porter's Five Forces Analysis
This preview shows the full Telenor Porter's Five Forces Analysis and is the exact document you'll receive after purchase—fully formatted, professionally written and ready for immediate download. No placeholders or samples, just the complete analysis for use in decision-making. Instant access to the same file you see here.

A Must-Have Tool for Decision-Makers
Telenor's Porter's Five Forces reveals moderate buyer power, high competitive rivalry, and regulatory pressures shaping margins. Supplier and substitute threats vary by market, while barriers to entry remain significant in core Nordic operations. This brief snapshot only scratches the surface. Unlock the full Porter's Five Forces Analysis to explore Telenor’s competitive dynamics in detail.
Suppliers Bargaining Power
RAN and core vendors concentrated
Network equipment is concentrated: Ericsson and Nokia together account for roughly half of global RAN revenue (2023–24), creating high switching costs and vendor leverage; certification and interoperability cycles commonly run 18–36 months, locking in architectures. Telenor’s scale—about 176 million subscribers across Nordics and Asia—helps negotiate better terms, while multi-vendor and Open RAN trials are beginning to temper pricing power.
Spectrum holders and regulators pivotal
Governments control spectrum allocation and license terms, directly shaping operators' cost structures and long-term margins; Nordic 5G auctions in recent cycles have typically attracted roughly €1–2bn per market, underscoring meaningful supplier leverage. Renewal schedules, coverage obligations and reserve prices can raise effective supplier power by front-loading costs and forcing higher bid strategies. Policy stability in the Nordics mitigates this risk, while select Asian markets show regulatory uncertainty and variable reserve pricing. Active auction participation and targeted advocacy help Telenor optimize spectrum outcomes and cost predictability.
Towercos and fiber wholesalers influence access
Towercos and fiber wholesalers can set lease prices and escalation clauses, directly impacting OPEX and capex recovery for operators.
5G urban densification increases site dependency—estimates suggest 3–4x more small cells—raising supplier bargaining exposure.
Long-term master service agreements and co-location can cut unit site costs by an estimated 20–40%, while Telenor’s owned sites and JV structures provide countervailing negotiation leverage.
IT/cloud platforms and OSS/BSS vendors
Migration to public cloud and reliance on key OSS/BSS stacks increase vendor stickiness; data portability and compliance (GDPR) constrain rapid switching, while Telenor’s scale—about 170 million subscribers in 2024—enables co-development and stronger SLAs.
- Vendor stickiness: cloud + OSS/BSS
- Constraints: data portability, GDPR
- Flexibility: modular APIs, exit rights
- Leverage: scale → co-development, better SLAs
Device makers and SIM/eSIM ecosystem
Handset OEMs strongly shape device availability, 5G feature timing and subsidy pressure; Apple and Samsung accounted for roughly 70 percent of the European premium smartphone market in 2024, driving rollout cadence and retail subsidy demands.
eSIM cuts physical logistics and SIM churn but transfers leverage to platform enablement and onboarding ecosystems; GSMA reported about 600 million eSIM profiles active worldwide in 2024.
Telenor's multi-OEM sourcing and bundling/financing partnerships diffuse single-vendor risk and distribute subsidy impacts across partners, helping protect service EBITDA.
Concentrated suppliers, device power and 5G densification boost OPEX and switching costs
Supplier power is high: Ericsson+Nokia ~50% global RAN (2023–24) and vendor certification cycles (18–36 months) raise switching costs. Telenor scale (~170–176M subs in 2024) and multi-vendor/Open RAN trials mitigate leverage. Tower/fiber lease inflation and 5G densification (3–4x small cells) raise OPEX exposure. OEMs (Apple+Samsung ~70% EU premium, 2024) and eSIM (~600M profiles, 2024) concentrate device power.
| Metric | Value (2023–24/2024) |
|---|---|
| RAN share (Ericsson+Nokia) | ~50% |
| Telenor subs | ~170–176M |
| EU premium OEMs | ~70% |
| eSIM profiles | ~600M |
| Small-cell increase | 3–4x |
What is included in the product
Detailed Word Document
Uncovers competitive drivers, supplier and buyer bargaining power, entry barriers, substitutes and rivalry shaping Telenor’s pricing, margins and strategic positioning, highlighting regulatory and disruptive threats to inform investor and strategic decisions.
Customizable Excel Spreadsheet
One-sheet Telenor Porter’s Five Forces summary—visualizes competitive pressure, entry threats, and supplier/buyer power for fast strategic decisions.
Customers Bargaining Power
High price transparency and low switching costs
High price transparency makes mobile plans easily comparable, raising price sensitivity among consumers and pressuring margins. Number portability is available in over 80% of markets (ITU, 2024), materially lowering friction to churn. Promotions and family bundles temporarily reduce switching but require frequent refresh to retain ARPU, while digital channels and comparison sites amplify shopper price comparison.
Enterprise and public sector negotiation clout
In 2024 enterprise and public sector clients across Telenor markets exert strong bargaining power, demanding bespoke SLAs, advanced security and IoT solutions that often extract meaningful pricing concessions. Multi‑year contracts (commonly 3–5 years) increase customer stickiness but compress margins and defer upside. Cross‑selling ICT and managed services raises average account value, while frequent competitive bidding cycles intensify buyer leverage.
Prepaid base in Asia is elastic
Prepaid customers in Asia are highly price- and perception-sensitive; prepaid connections account for over 70% of subscriptions in the region (GSMA 2024), meaning small ARPU (typically USD 2–5/month in parts of South/Southeast Asia, GSMA 2024) scales into substantial aggregate leverage. App-based top-ups and OTT bundle promotions now steer purchase choices, while loyalty rewards and micro-segmentation raise retention.
Quality-of-service expectations rising
5G, fiber and streaming have driven QoS expectations higher; by end-2024 global 5G subscriptions surpassed 2 billion (GSMA), making speed and reliability primary churn drivers as poor QoS quickly triggers downgrades or switches. Telenor can justify premium tiers via network-leadership messaging, while real-time care and digital self-service lower dissatisfaction and churn.
- 5G adoption: >2 billion (2024, GSMA)
- QoS = churn trigger
- Premium tiers justifyable
- Real-time care + self-service reduce churn
Convergence buyers seek bundle value
Convergence buyers demand bundle value: fixed-mobile-TV packages increase lock-in but drive demands for bundle discounts, squeezing unit margins as households assess the total bill; value-added services such as security and cloud storage can raise perceived value and ARPU. Contract tenures of 12–24 months and common 24-month device financing materially reduce churn.
- Contract tenure: 12–24 months
- Device financing: typically 24 months
- Bundles raise retention but increase discount pressure
>80% portability, >70% prepaid (Asia) and USD2-5 ARPU raise churn and margin pressure
High price transparency and >80% number portability (ITU 2024) amplify churn and price sensitivity, pressuring margins. Enterprise buyers demand SLAs/IoT discounts, while prepaid (Asia >70% subscriptions, GSMA 2024) and ARPU pressure (USD 2–5/mo in parts of SE Asia, GSMA 2024) increase customer leverage. 5G >2bn subs (GSMA 2024) raises QoS expectations; 12–24m contracts and 24m device financing partially lock customers.
| Metric | 2024 figure |
|---|---|
| Number portability | >80% (ITU 2024) |
| 5G subscriptions | >2 billion (GSMA 2024) |
| Prepaid share (Asia) | >70% (GSMA 2024) |
| Typical contract tenure | 12–24 months |
| Device financing | 24 months |
Preview the Actual Deliverable
Telenor Porter's Five Forces Analysis
This preview shows the full Telenor Porter's Five Forces Analysis and is the exact document you'll receive after purchase—fully formatted, professionally written and ready for immediate download. No placeholders or samples, just the complete analysis for use in decision-making. Instant access to the same file you see here.
Original: $10.00
-65%$10.00
$3.50Description
A Must-Have Tool for Decision-Makers
Telenor's Porter's Five Forces reveals moderate buyer power, high competitive rivalry, and regulatory pressures shaping margins. Supplier and substitute threats vary by market, while barriers to entry remain significant in core Nordic operations. This brief snapshot only scratches the surface. Unlock the full Porter's Five Forces Analysis to explore Telenor’s competitive dynamics in detail.
Suppliers Bargaining Power
RAN and core vendors concentrated
Network equipment is concentrated: Ericsson and Nokia together account for roughly half of global RAN revenue (2023–24), creating high switching costs and vendor leverage; certification and interoperability cycles commonly run 18–36 months, locking in architectures. Telenor’s scale—about 176 million subscribers across Nordics and Asia—helps negotiate better terms, while multi-vendor and Open RAN trials are beginning to temper pricing power.
Spectrum holders and regulators pivotal
Governments control spectrum allocation and license terms, directly shaping operators' cost structures and long-term margins; Nordic 5G auctions in recent cycles have typically attracted roughly €1–2bn per market, underscoring meaningful supplier leverage. Renewal schedules, coverage obligations and reserve prices can raise effective supplier power by front-loading costs and forcing higher bid strategies. Policy stability in the Nordics mitigates this risk, while select Asian markets show regulatory uncertainty and variable reserve pricing. Active auction participation and targeted advocacy help Telenor optimize spectrum outcomes and cost predictability.
Towercos and fiber wholesalers influence access
Towercos and fiber wholesalers can set lease prices and escalation clauses, directly impacting OPEX and capex recovery for operators.
5G urban densification increases site dependency—estimates suggest 3–4x more small cells—raising supplier bargaining exposure.
Long-term master service agreements and co-location can cut unit site costs by an estimated 20–40%, while Telenor’s owned sites and JV structures provide countervailing negotiation leverage.
IT/cloud platforms and OSS/BSS vendors
Migration to public cloud and reliance on key OSS/BSS stacks increase vendor stickiness; data portability and compliance (GDPR) constrain rapid switching, while Telenor’s scale—about 170 million subscribers in 2024—enables co-development and stronger SLAs.
- Vendor stickiness: cloud + OSS/BSS
- Constraints: data portability, GDPR
- Flexibility: modular APIs, exit rights
- Leverage: scale → co-development, better SLAs
Device makers and SIM/eSIM ecosystem
Handset OEMs strongly shape device availability, 5G feature timing and subsidy pressure; Apple and Samsung accounted for roughly 70 percent of the European premium smartphone market in 2024, driving rollout cadence and retail subsidy demands.
eSIM cuts physical logistics and SIM churn but transfers leverage to platform enablement and onboarding ecosystems; GSMA reported about 600 million eSIM profiles active worldwide in 2024.
Telenor's multi-OEM sourcing and bundling/financing partnerships diffuse single-vendor risk and distribute subsidy impacts across partners, helping protect service EBITDA.
Concentrated suppliers, device power and 5G densification boost OPEX and switching costs
Supplier power is high: Ericsson+Nokia ~50% global RAN (2023–24) and vendor certification cycles (18–36 months) raise switching costs. Telenor scale (~170–176M subs in 2024) and multi-vendor/Open RAN trials mitigate leverage. Tower/fiber lease inflation and 5G densification (3–4x small cells) raise OPEX exposure. OEMs (Apple+Samsung ~70% EU premium, 2024) and eSIM (~600M profiles, 2024) concentrate device power.
| Metric | Value (2023–24/2024) |
|---|---|
| RAN share (Ericsson+Nokia) | ~50% |
| Telenor subs | ~170–176M |
| EU premium OEMs | ~70% |
| eSIM profiles | ~600M |
| Small-cell increase | 3–4x |
What is included in the product
Detailed Word Document
Uncovers competitive drivers, supplier and buyer bargaining power, entry barriers, substitutes and rivalry shaping Telenor’s pricing, margins and strategic positioning, highlighting regulatory and disruptive threats to inform investor and strategic decisions.
Customizable Excel Spreadsheet
One-sheet Telenor Porter’s Five Forces summary—visualizes competitive pressure, entry threats, and supplier/buyer power for fast strategic decisions.
Customers Bargaining Power
High price transparency and low switching costs
High price transparency makes mobile plans easily comparable, raising price sensitivity among consumers and pressuring margins. Number portability is available in over 80% of markets (ITU, 2024), materially lowering friction to churn. Promotions and family bundles temporarily reduce switching but require frequent refresh to retain ARPU, while digital channels and comparison sites amplify shopper price comparison.
Enterprise and public sector negotiation clout
In 2024 enterprise and public sector clients across Telenor markets exert strong bargaining power, demanding bespoke SLAs, advanced security and IoT solutions that often extract meaningful pricing concessions. Multi‑year contracts (commonly 3–5 years) increase customer stickiness but compress margins and defer upside. Cross‑selling ICT and managed services raises average account value, while frequent competitive bidding cycles intensify buyer leverage.
Prepaid base in Asia is elastic
Prepaid customers in Asia are highly price- and perception-sensitive; prepaid connections account for over 70% of subscriptions in the region (GSMA 2024), meaning small ARPU (typically USD 2–5/month in parts of South/Southeast Asia, GSMA 2024) scales into substantial aggregate leverage. App-based top-ups and OTT bundle promotions now steer purchase choices, while loyalty rewards and micro-segmentation raise retention.
Quality-of-service expectations rising
5G, fiber and streaming have driven QoS expectations higher; by end-2024 global 5G subscriptions surpassed 2 billion (GSMA), making speed and reliability primary churn drivers as poor QoS quickly triggers downgrades or switches. Telenor can justify premium tiers via network-leadership messaging, while real-time care and digital self-service lower dissatisfaction and churn.
- 5G adoption: >2 billion (2024, GSMA)
- QoS = churn trigger
- Premium tiers justifyable
- Real-time care + self-service reduce churn
Convergence buyers seek bundle value
Convergence buyers demand bundle value: fixed-mobile-TV packages increase lock-in but drive demands for bundle discounts, squeezing unit margins as households assess the total bill; value-added services such as security and cloud storage can raise perceived value and ARPU. Contract tenures of 12–24 months and common 24-month device financing materially reduce churn.
- Contract tenure: 12–24 months
- Device financing: typically 24 months
- Bundles raise retention but increase discount pressure
>80% portability, >70% prepaid (Asia) and USD2-5 ARPU raise churn and margin pressure
High price transparency and >80% number portability (ITU 2024) amplify churn and price sensitivity, pressuring margins. Enterprise buyers demand SLAs/IoT discounts, while prepaid (Asia >70% subscriptions, GSMA 2024) and ARPU pressure (USD 2–5/mo in parts of SE Asia, GSMA 2024) increase customer leverage. 5G >2bn subs (GSMA 2024) raises QoS expectations; 12–24m contracts and 24m device financing partially lock customers.
| Metric | 2024 figure |
|---|---|
| Number portability | >80% (ITU 2024) |
| 5G subscriptions | >2 billion (GSMA 2024) |
| Prepaid share (Asia) | >70% (GSMA 2024) |
| Typical contract tenure | 12–24 months |
| Device financing | 24 months |
Preview the Actual Deliverable
Telenor Porter's Five Forces Analysis
This preview shows the full Telenor Porter's Five Forces Analysis and is the exact document you'll receive after purchase—fully formatted, professionally written and ready for immediate download. No placeholders or samples, just the complete analysis for use in decision-making. Instant access to the same file you see here.











