Telstra Porter's Five Forces Analysis

Don't Miss the Bigger Picture
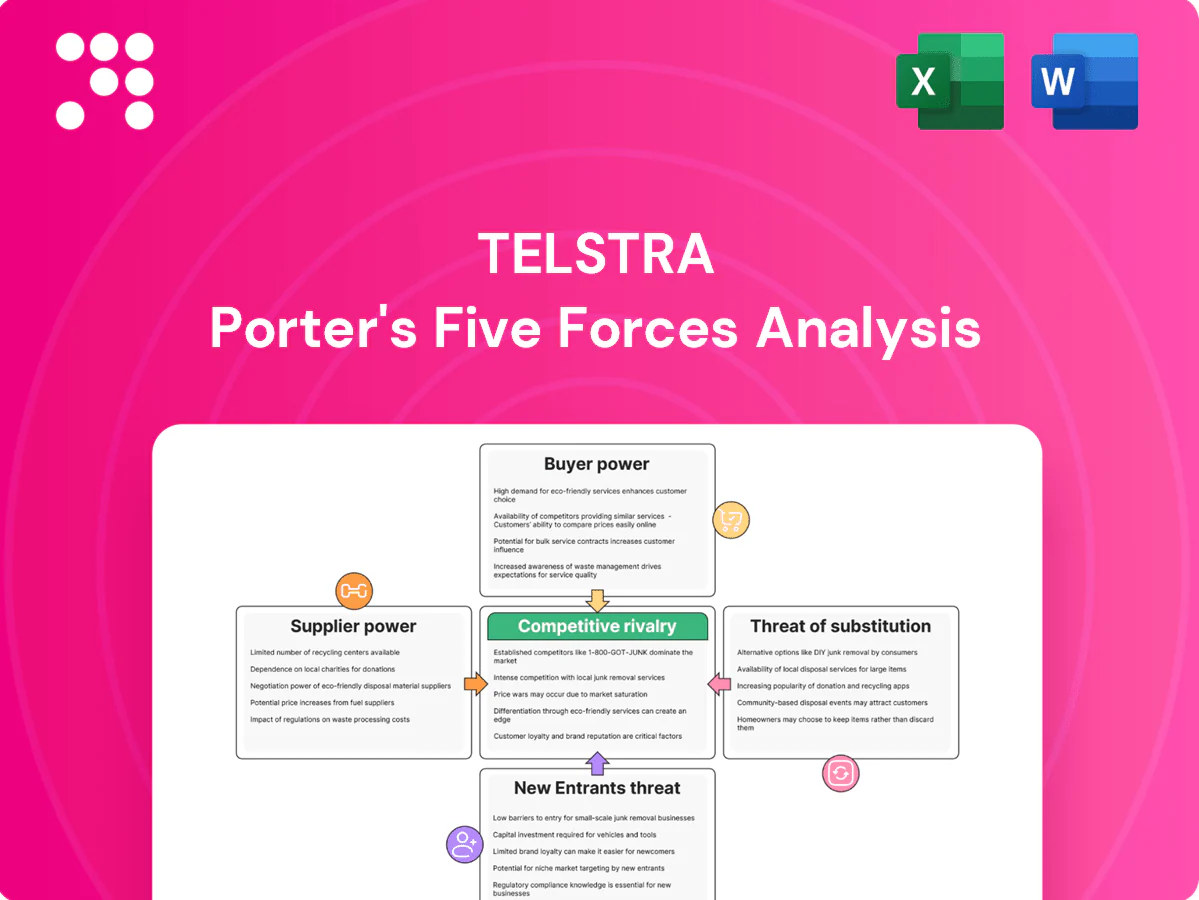
Telstra faces intense competitive rivalry from incumbents and challengers, moderate buyer power, low supplier leverage, rising substitute threats from OTTs, and high barriers limiting new entrants. This brief snapshot only scratches the surface. Unlock the full Porter's Five Forces Analysis to explore Telstra’s competitive dynamics, market pressures, and strategic advantages in detail.
Suppliers Bargaining Power

Concentrated network vendors
Core radio, transmission and 5G gear for Telstra come from a few OEMs—Ericsson and Nokia together held over 50% of the global RAN market in 2024—concentrating supplier bargaining power. Vendor switches incur high integration, performance and certification costs, while suppliers can shape pricing, upgrade cadence and support terms. Telstra offsets this via multi-vendor deployment and long-term framework agreements and network capex (about AUD 2.8bn in FY24) to secure terms.
Spectrum and regulation dependency
Spectrum is allocated by the Australian government via ACMA, making the state a pivotal upstream supplier; in 2024 ACMA remained the sole licensing authority. Auction pricing, license terms and renewal conditions directly shape Telstra’s cost base and strategic flexibility. Compliance obligations such as coverage and emergency-service requirements add non-price leverage. Predictable policy reduces risk, but spectrum scarcity sustains supplier power.

Wholesale fixed access (NBN Co)
NBN Co is the dominant fixed wholesale supplier, serving around 11.9 million premises and carrying roughly 90% of Australia’s fixed retail broadband, so its access charges and product constructs materially affect Telstra’s retail margins. ACCC and industry regulation moderate NBN pricing but do not remove dependence. Telstra counters with its mobile base, accelerating 5G FWA rollout and differentiated bundles to protect revenues.

Towers, backhaul, and utilities
Passive towers, power and backhaul are essential inputs with few local alternatives in remote Australia, so outages or price shocks in 2023–24 materially impact Telstra’s service quality and costs; long-term leases and its InfraCo/in‑house infrastructure reduce supplier leverage but do not eliminate localized bottlenecks.
- Limited alternatives in remote sites
- Outages/prices ripple through OPEX and QoS
- Long-term leases and InfraCo lower risk
- Geographic dispersion sustains local supplier power
IT, cloud, and software stacks
Digital platforms, cloud hyperscalers (AWS 32%, Azure 22%, GCP 11% global share in 2024) and OSS/BSS vendors are deeply embedded in Telstra operations; data egress fees and complex license/migration paths lock in recurring costs and raise TCO. Co-investment, multi-cloud architectures and edge partnerships lower switching barriers while strategic vendor partnerships secure roadmap influence and service commitments.
- Vendor concentration: hyperscalers ~65% market
- Cost levers: egress fees, license models, migration complexity
- Mitigants: co-investment, multi-cloud, edge
- Strategic move: roadmap influence via partnerships
Supplier power concentrated: 50%+ RAN, ~65% hyperscalers squeeze margins
Supplier power is high: Ericsson+Nokia >50% RAN share (2024) and hyperscalers ~65% combined (AWS 32%, Azure 22%, GCP 11%) concentrate leverage. Network capex AUD 2.8bn (FY24) secures terms but switching costs remain. NBN Co (11.9m premises) and remote towers sustain dependency and localized pricing power.
| Supplier | 2024 metric | Impact |
|---|---|---|
| RAN vendors | Ericsson+Nokia >50% | High pricing/control |
| Hyperscalers | AWS32% Azure22% GCP11% | Lock‑in, egress fees |
| NBN Co | 11.9m premises | Wholesale dependence |
| Network capex | AUD 2.8bn FY24 | Negotiation leverage |
What is included in the product
 Detailed Word Document
Uncovers key drivers of competition, customer influence, supplier power, and market entry risks specific to Telstra, highlighting disruptive substitutes and emerging threats to its market share. Detailed, strategic commentary evaluates buyer/supplier control, barriers protecting incumbents, and implications for pricing and profitability.

 Customizable Excel Spreadsheet
A one-sheet Telstra Porter's Five Forces summary that clarifies competitive pressures from carriers, suppliers, regulators and substitutes—ideal for quick board decisions, with editable pressure levels and a radar chart ready for decks.
Customers Bargaining Power

Price-sensitive mass market
Consumers face abundant plan choices and transparent price comparisons in 2024, increasing price sensitivity and bargaining power. Number portability effectively lowers switching costs, accelerating churn and strengthening buyer leverage. Aggressive promotions and device subsidies set low-price expectations, while Telstra defends with roughly 40% mobile market share in 2024, superior coverage, brand trust and service quality.
Enterprise and government clout
Large enterprise and government customers demand bespoke SLAs, multi-year contracts and volume discounts, leveraging procurement teams to extract better terms; this is critical given Telstra reported underlying FY24 revenue around A$24.7bn. Bundled ICT procurement intensifies pricing pressure as agencies and corporates consolidate suppliers. Telstra counters with end-to-end solutions, advanced security offerings and national support to protect margins and lock-in customers.

MVNO alternatives
Resellers operating on Telstra, Optus and TPG networks offer lower-priced, no-frills plans and streamlined onboarding, expanding buyer choice and increasing price sensitivity; this compresses ARPU and raises churn pressure for incumbents. The proliferation of MVNO offers in 2024 intensified downwards ARPU trends, prompting Telstra to deploy sub-brands and segmented value propositions to protect revenue and reduce customer defections.

Service quality expectations
Buyers demand reliable 5G, low latency and pervasive coverage; Telstra reported over 70% Australian population 5G coverage by 2024 and routinely tops local speed tests, which raises customer price tolerance. Poor experiences drive rapid switching and public complaints, visible in churn spikes after outages. Investment in network leadership, with ~A$3–4bn annual capex in recent years, tempers buyer power.
- coverage: >70% 5G population (2024)
- speed ranking: top local Ookla results (2024)
- price sensitivity: tied to speed tests
- capex: ~A$3–4bn/yr reduces switching
Bundling and device financing
Bundling and handset financing have historically increased switching costs for Telstra customers by tying devices and multi-service discounts into contracts, though growing BYOD adoption and decoupled SIM-only plans in 2024 have increased buyer flexibility and churn sensitivity.
- Retention via bundles
- 2024: rising SIM-only uptake
- Regulatory transparency limits lock-in
- Flexible bundles balance retention and autonomy
Customers have strong leverage; market leader holds ~40% share, >70% 5G coverage
Customers wield strong bargaining power in 2024 due to abundant plan choice, transparent price comparisons and low switching costs from number portability; Telstra retains ~40% mobile share but faces ARPU pressure. Large enterprise buyers leverage multi-year SLAs and volume discounts against Telstra's A$24.7bn FY24 revenue. Network leadership (>70% 5G population) and ~A$3–4bn annual capex partly mitigate churn.
| Metric | 2024 |
|---|---|
| Mobile market share | ~40% |
| 5G population coverage | >70% |
| FY24 underlying revenue | A$24.7bn |
| Annual capex | ~A$3–4bn |
Full Version Awaits
Telstra Porter's Five Forces Analysis
This preview shows the exact Telstra Porter's Five Forces Analysis you'll receive—comprehensive, professionally formatted, and ready for immediate download. It contains the full assessment of competitive rivalry, supplier and buyer power, threats of entry and substitutes. No placeholders, no samples—what you see is the deliverable upon purchase.

Don't Miss the Bigger Picture
Telstra faces intense competitive rivalry from incumbents and challengers, moderate buyer power, low supplier leverage, rising substitute threats from OTTs, and high barriers limiting new entrants. This brief snapshot only scratches the surface. Unlock the full Porter's Five Forces Analysis to explore Telstra’s competitive dynamics, market pressures, and strategic advantages in detail.
Suppliers Bargaining Power
Concentrated network vendors
Core radio, transmission and 5G gear for Telstra come from a few OEMs—Ericsson and Nokia together held over 50% of the global RAN market in 2024—concentrating supplier bargaining power. Vendor switches incur high integration, performance and certification costs, while suppliers can shape pricing, upgrade cadence and support terms. Telstra offsets this via multi-vendor deployment and long-term framework agreements and network capex (about AUD 2.8bn in FY24) to secure terms.
Spectrum and regulation dependency
Spectrum is allocated by the Australian government via ACMA, making the state a pivotal upstream supplier; in 2024 ACMA remained the sole licensing authority. Auction pricing, license terms and renewal conditions directly shape Telstra’s cost base and strategic flexibility. Compliance obligations such as coverage and emergency-service requirements add non-price leverage. Predictable policy reduces risk, but spectrum scarcity sustains supplier power.
Wholesale fixed access (NBN Co)
NBN Co is the dominant fixed wholesale supplier, serving around 11.9 million premises and carrying roughly 90% of Australia’s fixed retail broadband, so its access charges and product constructs materially affect Telstra’s retail margins. ACCC and industry regulation moderate NBN pricing but do not remove dependence. Telstra counters with its mobile base, accelerating 5G FWA rollout and differentiated bundles to protect revenues.
Towers, backhaul, and utilities
Passive towers, power and backhaul are essential inputs with few local alternatives in remote Australia, so outages or price shocks in 2023–24 materially impact Telstra’s service quality and costs; long-term leases and its InfraCo/in‑house infrastructure reduce supplier leverage but do not eliminate localized bottlenecks.
- Limited alternatives in remote sites
- Outages/prices ripple through OPEX and QoS
- Long-term leases and InfraCo lower risk
- Geographic dispersion sustains local supplier power
IT, cloud, and software stacks
Digital platforms, cloud hyperscalers (AWS 32%, Azure 22%, GCP 11% global share in 2024) and OSS/BSS vendors are deeply embedded in Telstra operations; data egress fees and complex license/migration paths lock in recurring costs and raise TCO. Co-investment, multi-cloud architectures and edge partnerships lower switching barriers while strategic vendor partnerships secure roadmap influence and service commitments.
- Vendor concentration: hyperscalers ~65% market
- Cost levers: egress fees, license models, migration complexity
- Mitigants: co-investment, multi-cloud, edge
- Strategic move: roadmap influence via partnerships
Supplier power concentrated: 50%+ RAN, ~65% hyperscalers squeeze margins
Supplier power is high: Ericsson+Nokia >50% RAN share (2024) and hyperscalers ~65% combined (AWS 32%, Azure 22%, GCP 11%) concentrate leverage. Network capex AUD 2.8bn (FY24) secures terms but switching costs remain. NBN Co (11.9m premises) and remote towers sustain dependency and localized pricing power.
| Supplier | 2024 metric | Impact |
|---|---|---|
| RAN vendors | Ericsson+Nokia >50% | High pricing/control |
| Hyperscalers | AWS32% Azure22% GCP11% | Lock‑in, egress fees |
| NBN Co | 11.9m premises | Wholesale dependence |
| Network capex | AUD 2.8bn FY24 | Negotiation leverage |
What is included in the product
Detailed Word Document
Uncovers key drivers of competition, customer influence, supplier power, and market entry risks specific to Telstra, highlighting disruptive substitutes and emerging threats to its market share. Detailed, strategic commentary evaluates buyer/supplier control, barriers protecting incumbents, and implications for pricing and profitability.
Customizable Excel Spreadsheet
A one-sheet Telstra Porter's Five Forces summary that clarifies competitive pressures from carriers, suppliers, regulators and substitutes—ideal for quick board decisions, with editable pressure levels and a radar chart ready for decks.
Customers Bargaining Power
Price-sensitive mass market
Consumers face abundant plan choices and transparent price comparisons in 2024, increasing price sensitivity and bargaining power. Number portability effectively lowers switching costs, accelerating churn and strengthening buyer leverage. Aggressive promotions and device subsidies set low-price expectations, while Telstra defends with roughly 40% mobile market share in 2024, superior coverage, brand trust and service quality.
Enterprise and government clout
Large enterprise and government customers demand bespoke SLAs, multi-year contracts and volume discounts, leveraging procurement teams to extract better terms; this is critical given Telstra reported underlying FY24 revenue around A$24.7bn. Bundled ICT procurement intensifies pricing pressure as agencies and corporates consolidate suppliers. Telstra counters with end-to-end solutions, advanced security offerings and national support to protect margins and lock-in customers.
MVNO alternatives
Resellers operating on Telstra, Optus and TPG networks offer lower-priced, no-frills plans and streamlined onboarding, expanding buyer choice and increasing price sensitivity; this compresses ARPU and raises churn pressure for incumbents. The proliferation of MVNO offers in 2024 intensified downwards ARPU trends, prompting Telstra to deploy sub-brands and segmented value propositions to protect revenue and reduce customer defections.
Service quality expectations
Buyers demand reliable 5G, low latency and pervasive coverage; Telstra reported over 70% Australian population 5G coverage by 2024 and routinely tops local speed tests, which raises customer price tolerance. Poor experiences drive rapid switching and public complaints, visible in churn spikes after outages. Investment in network leadership, with ~A$3–4bn annual capex in recent years, tempers buyer power.
- coverage: >70% 5G population (2024)
- speed ranking: top local Ookla results (2024)
- price sensitivity: tied to speed tests
- capex: ~A$3–4bn/yr reduces switching
Bundling and device financing
Bundling and handset financing have historically increased switching costs for Telstra customers by tying devices and multi-service discounts into contracts, though growing BYOD adoption and decoupled SIM-only plans in 2024 have increased buyer flexibility and churn sensitivity.
- Retention via bundles
- 2024: rising SIM-only uptake
- Regulatory transparency limits lock-in
- Flexible bundles balance retention and autonomy
Customers have strong leverage; market leader holds ~40% share, >70% 5G coverage
Customers wield strong bargaining power in 2024 due to abundant plan choice, transparent price comparisons and low switching costs from number portability; Telstra retains ~40% mobile share but faces ARPU pressure. Large enterprise buyers leverage multi-year SLAs and volume discounts against Telstra's A$24.7bn FY24 revenue. Network leadership (>70% 5G population) and ~A$3–4bn annual capex partly mitigate churn.
| Metric | 2024 |
|---|---|
| Mobile market share | ~40% |
| 5G population coverage | >70% |
| FY24 underlying revenue | A$24.7bn |
| Annual capex | ~A$3–4bn |
Full Version Awaits
Telstra Porter's Five Forces Analysis
This preview shows the exact Telstra Porter's Five Forces Analysis you'll receive—comprehensive, professionally formatted, and ready for immediate download. It contains the full assessment of competitive rivalry, supplier and buyer power, threats of entry and substitutes. No placeholders, no samples—what you see is the deliverable upon purchase.
Description
Don't Miss the Bigger Picture
Telstra faces intense competitive rivalry from incumbents and challengers, moderate buyer power, low supplier leverage, rising substitute threats from OTTs, and high barriers limiting new entrants. This brief snapshot only scratches the surface. Unlock the full Porter's Five Forces Analysis to explore Telstra’s competitive dynamics, market pressures, and strategic advantages in detail.
Suppliers Bargaining Power
Concentrated network vendors
Core radio, transmission and 5G gear for Telstra come from a few OEMs—Ericsson and Nokia together held over 50% of the global RAN market in 2024—concentrating supplier bargaining power. Vendor switches incur high integration, performance and certification costs, while suppliers can shape pricing, upgrade cadence and support terms. Telstra offsets this via multi-vendor deployment and long-term framework agreements and network capex (about AUD 2.8bn in FY24) to secure terms.
Spectrum and regulation dependency
Spectrum is allocated by the Australian government via ACMA, making the state a pivotal upstream supplier; in 2024 ACMA remained the sole licensing authority. Auction pricing, license terms and renewal conditions directly shape Telstra’s cost base and strategic flexibility. Compliance obligations such as coverage and emergency-service requirements add non-price leverage. Predictable policy reduces risk, but spectrum scarcity sustains supplier power.
Wholesale fixed access (NBN Co)
NBN Co is the dominant fixed wholesale supplier, serving around 11.9 million premises and carrying roughly 90% of Australia’s fixed retail broadband, so its access charges and product constructs materially affect Telstra’s retail margins. ACCC and industry regulation moderate NBN pricing but do not remove dependence. Telstra counters with its mobile base, accelerating 5G FWA rollout and differentiated bundles to protect revenues.
Towers, backhaul, and utilities
Passive towers, power and backhaul are essential inputs with few local alternatives in remote Australia, so outages or price shocks in 2023–24 materially impact Telstra’s service quality and costs; long-term leases and its InfraCo/in‑house infrastructure reduce supplier leverage but do not eliminate localized bottlenecks.
- Limited alternatives in remote sites
- Outages/prices ripple through OPEX and QoS
- Long-term leases and InfraCo lower risk
- Geographic dispersion sustains local supplier power
IT, cloud, and software stacks
Digital platforms, cloud hyperscalers (AWS 32%, Azure 22%, GCP 11% global share in 2024) and OSS/BSS vendors are deeply embedded in Telstra operations; data egress fees and complex license/migration paths lock in recurring costs and raise TCO. Co-investment, multi-cloud architectures and edge partnerships lower switching barriers while strategic vendor partnerships secure roadmap influence and service commitments.
- Vendor concentration: hyperscalers ~65% market
- Cost levers: egress fees, license models, migration complexity
- Mitigants: co-investment, multi-cloud, edge
- Strategic move: roadmap influence via partnerships
Supplier power concentrated: 50%+ RAN, ~65% hyperscalers squeeze margins
Supplier power is high: Ericsson+Nokia >50% RAN share (2024) and hyperscalers ~65% combined (AWS 32%, Azure 22%, GCP 11%) concentrate leverage. Network capex AUD 2.8bn (FY24) secures terms but switching costs remain. NBN Co (11.9m premises) and remote towers sustain dependency and localized pricing power.
| Supplier | 2024 metric | Impact |
|---|---|---|
| RAN vendors | Ericsson+Nokia >50% | High pricing/control |
| Hyperscalers | AWS32% Azure22% GCP11% | Lock‑in, egress fees |
| NBN Co | 11.9m premises | Wholesale dependence |
| Network capex | AUD 2.8bn FY24 | Negotiation leverage |
What is included in the product
Detailed Word Document
Uncovers key drivers of competition, customer influence, supplier power, and market entry risks specific to Telstra, highlighting disruptive substitutes and emerging threats to its market share. Detailed, strategic commentary evaluates buyer/supplier control, barriers protecting incumbents, and implications for pricing and profitability.
Customizable Excel Spreadsheet
A one-sheet Telstra Porter's Five Forces summary that clarifies competitive pressures from carriers, suppliers, regulators and substitutes—ideal for quick board decisions, with editable pressure levels and a radar chart ready for decks.
Customers Bargaining Power
Price-sensitive mass market
Consumers face abundant plan choices and transparent price comparisons in 2024, increasing price sensitivity and bargaining power. Number portability effectively lowers switching costs, accelerating churn and strengthening buyer leverage. Aggressive promotions and device subsidies set low-price expectations, while Telstra defends with roughly 40% mobile market share in 2024, superior coverage, brand trust and service quality.
Enterprise and government clout
Large enterprise and government customers demand bespoke SLAs, multi-year contracts and volume discounts, leveraging procurement teams to extract better terms; this is critical given Telstra reported underlying FY24 revenue around A$24.7bn. Bundled ICT procurement intensifies pricing pressure as agencies and corporates consolidate suppliers. Telstra counters with end-to-end solutions, advanced security offerings and national support to protect margins and lock-in customers.
MVNO alternatives
Resellers operating on Telstra, Optus and TPG networks offer lower-priced, no-frills plans and streamlined onboarding, expanding buyer choice and increasing price sensitivity; this compresses ARPU and raises churn pressure for incumbents. The proliferation of MVNO offers in 2024 intensified downwards ARPU trends, prompting Telstra to deploy sub-brands and segmented value propositions to protect revenue and reduce customer defections.
Service quality expectations
Buyers demand reliable 5G, low latency and pervasive coverage; Telstra reported over 70% Australian population 5G coverage by 2024 and routinely tops local speed tests, which raises customer price tolerance. Poor experiences drive rapid switching and public complaints, visible in churn spikes after outages. Investment in network leadership, with ~A$3–4bn annual capex in recent years, tempers buyer power.
- coverage: >70% 5G population (2024)
- speed ranking: top local Ookla results (2024)
- price sensitivity: tied to speed tests
- capex: ~A$3–4bn/yr reduces switching
Bundling and device financing
Bundling and handset financing have historically increased switching costs for Telstra customers by tying devices and multi-service discounts into contracts, though growing BYOD adoption and decoupled SIM-only plans in 2024 have increased buyer flexibility and churn sensitivity.
- Retention via bundles
- 2024: rising SIM-only uptake
- Regulatory transparency limits lock-in
- Flexible bundles balance retention and autonomy
Customers have strong leverage; market leader holds ~40% share, >70% 5G coverage
Customers wield strong bargaining power in 2024 due to abundant plan choice, transparent price comparisons and low switching costs from number portability; Telstra retains ~40% mobile share but faces ARPU pressure. Large enterprise buyers leverage multi-year SLAs and volume discounts against Telstra's A$24.7bn FY24 revenue. Network leadership (>70% 5G population) and ~A$3–4bn annual capex partly mitigate churn.
| Metric | 2024 |
|---|---|
| Mobile market share | ~40% |
| 5G population coverage | >70% |
| FY24 underlying revenue | A$24.7bn |
| Annual capex | ~A$3–4bn |
Full Version Awaits
Telstra Porter's Five Forces Analysis
This preview shows the exact Telstra Porter's Five Forces Analysis you'll receive—comprehensive, professionally formatted, and ready for immediate download. It contains the full assessment of competitive rivalry, supplier and buyer power, threats of entry and substitutes. No placeholders, no samples—what you see is the deliverable upon purchase.











