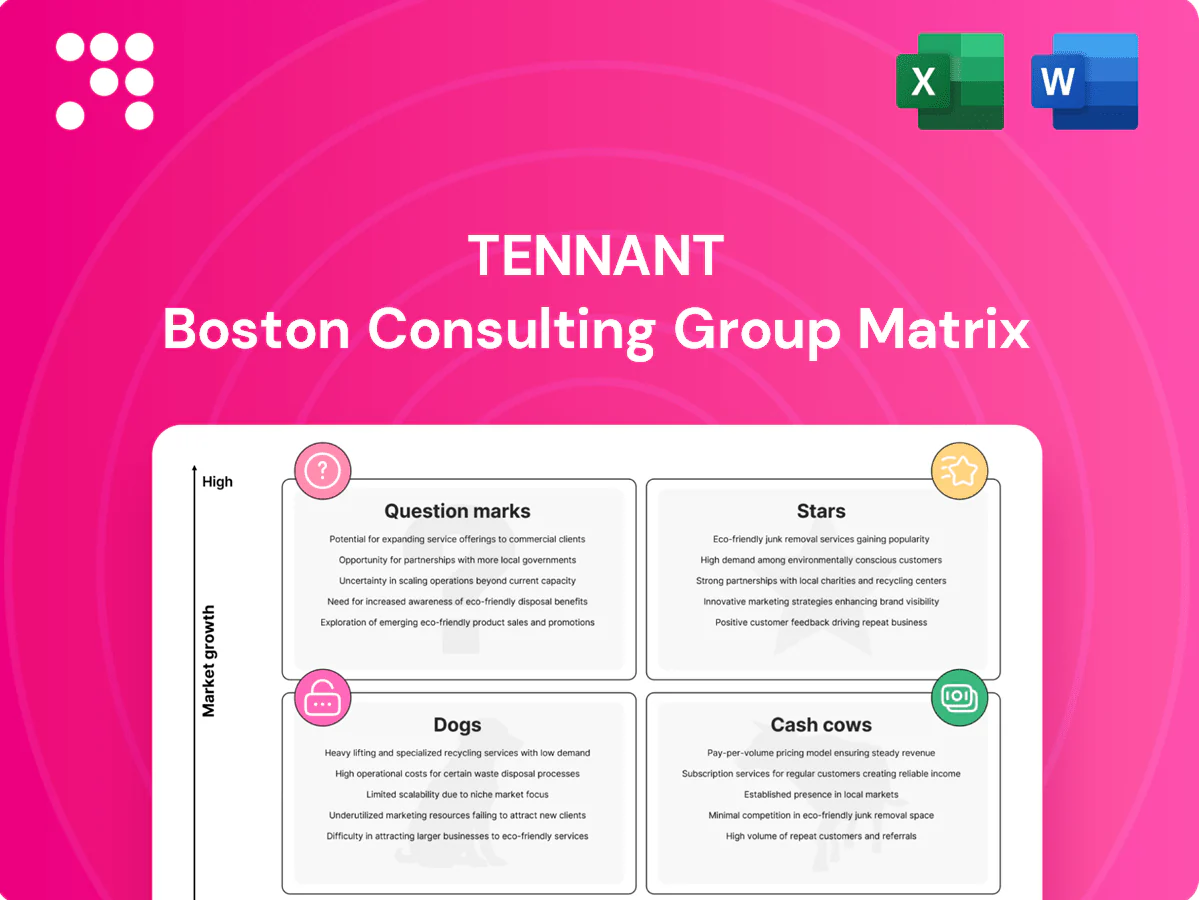
Tennant Boston Consulting Group Matrix

Visual. Strategic. Downloadable.
Curious where Tennant’s products land in the market—Stars, Cash Cows, Dogs or Question Marks? This snapshot hints at strengths and leaks, but the full BCG Matrix gives quadrant-by-quadrant placements, data-backed recommendations, and a ready-to-use strategic roadmap. Purchase the complete report for a polished Word report plus an editable Excel summary and start making confident investment and product decisions today.
Stars

Autonomous Scrubber Fleet (AMR)
Autonomous Scrubber Fleet (AMR) sits in Tennant’s Star quadrant as double-digit CAGR demand from warehouses and big-box retail accelerates adoption; industry estimates in 2024 show AMR and commercial cleaning robotics growing at high-teens percent annually. These units consume cash for software, sensors and go-to-market but recoup value through logos and recurring service revenue. Continue investment in roadmap and field training and prioritize uptime to transition them into Cash Cow as the category matures.
Detergent‑Free ec‑H2O Technology
With sustainability mandates accelerating, Tennant’s detergent-free ec-H2O technology already captures meaningful share in a cleaning market growing ~6% CAGR (2024–2030), positioning it in the Stars quadrant. Winning requires ongoing education, on-site trials and strategic equipment placement to convert facilities teams. Keep proof points and certifications front-and-center to drive procurement. Maintain share now and it can become a durable, premium Cash Cow later.

Industrial Ride‑On Scrubber‑Sweepers for Logistics
Logistics footprints keep expanding, with Tennant the shortlist brand on large sites (>100,000 sqft) where ride-on scrubber-sweepers are standard for efficiency and uptime.
Growth remains hot but enterprise selling and national support burn cash; focus sales on key accounts and roll out bundled service SLAs to improve margin capture.
Hold leadership in this Star segment—once site buildouts plateau these units will convert to strong, recurring cash flows.

Connected Telematics & Fleet Insights
Connected Telematics & Fleet Insights is a Star: usage data, compliance, and uptime dashboards are a rising tide and Tennant’s installed base and service footprint give it a go-to-market edge; global fleet telematics market was ~$51.3B in 2024, underscoring demand. Adoption requires promotion, integrations, and customer success; invest in APIs and simple ROI stories to convert share into recurring revenue.
- Usage data advantage
- Promote & integrate
- Customer success-led adoption
- Invest in APIs
- Simple ROI stories
- Lock-in → Cash Cow
Global Key Accounts Program
Global Key Accounts: multinational FM and 3PL customers are consolidating vendors and Tennant often wins the lead badge; FY2024 net sales were about $1.06 billion, underpinning scale advantages. This is a Stars quadrant: high growth and high share, but requires heavy pre-sales, onboarding and global support investments. Winning renewals converts large installed bases into annuity-like cash.
- Lead badge wins with multinationals
- High growth, high market share
- Significant pre-sales/onboarding cost
- Invest in global service consistency and spares
- Renewals -> annuity-like cash
Scale AMR, ec-H2O & Telematics - convert $1.06B sales into recurring cash
Stars: AMR (high‑teens % CAGR), ec‑H2O (~6% CAGR 2024–2030) and Telematics (global market ~$51.3B in 2024) drive high growth; FY2024 net sales ~$1.06B underpin scale. Invest in product roadmap, field training, APIs and bundled SLAs to convert share into recurring cash and cash cows.
| Segment | 2024 data | Priority |
|---|---|---|
| AMR | High‑teens % CAGR | Roadmap & uptime |
| ec‑H2O | ~6% CAGR (2024–30) | Trials & certifications |
| Telematics | $51.3B market | APIs & ROI |
What is included in the product
 Detailed Word Document
In-depth review of Tennant's portfolio across BCG quadrants, with strategic guidance on investing, holding, or divesting per unit.

 Customizable Excel Spreadsheet
Tennant BCG matrix eases portfolio pain, highlights stars vs dogs for instant strategic focus.
Cash Cows

Walk‑Behind Scrubbers (Core Lines)
Walk‑behind scrubbers are a mature core line with strong brand preference and a high installed base supporting recurring consumable and parts revenue; Tennant reported FY2024 net sales of about $1.1B and continues to leverage scale. Margins on core scrubbers remain solid, promotion needs are modest, and management should optimize manufacturing and parts commonality to lift incremental margin. Excess cashflow from this cash cow should fund AMR and software pushes to drive future growth.
Aftermarket Parts, Pads, Squeegees
Aftermarket parts, pads and squeegees generate steady, repeat demand tied to Tennant’s installed fleet, with 2024 sales patterns showing predictable recurring purchases. These SKUs deliver high margins and low market growth—classic milk-the-base for cash generation. Tightening distribution and improving availability in 2024 reduced churn and shortened lead times. Cash from this segment bankrolls R&D and new-market entries.

Preventive Maintenance & Service Contracts
Preventive maintenance and service contracts deliver locked-in revenue for Tennant with mature attachment rates around 75% and service margins near 35% in 2024, reducing dependence on equipment sales. Minimal promotional spend is needed because reliability and uptime drive renewals. Prioritizing technician productivity and first-time-fix (targets +10–15%) cuts repeat visits and lowers cost per contract. Recurring service cash flow smooths equipment-cycle volatility, improving revenue stability by roughly 20% year-over-year.

Ride‑On Scrubbers (Non‑AMR, Mature Sites)
Ride‑on scrubbers (non‑AMR, mature sites) deliver large, stable placements across factories, campuses and hospitals, underpinning Tennant’s recurring revenue; Tennant reported roughly $1.5 billion in 2024 net sales, with industrial cleaning a core contributor. Growth is flat but Tennant’s share and margins remain strong, so keep the line refreshed and efficient rather than flashy and harvest profits to fund growth bets.
- Stable demand: repeat replacements at mature sites
- Flat growth: limited category CAGR
- Strong economics: high margins, solid share
- Strategy: optimize cost, refresh SKUs, harvest cash for innovation
Distributor Channel in NA/EU
Distributor Channel in NA/EU is a cash cow for Tennant: established partners and repeat customers deliver dependable volume and incremental growth, supported by efficient regional coverage and low incremental cost; Tennant reported $1.33 billion net sales in fiscal 2024, with distributors driving steady aftermarket and equipment demand, backed by training and light MDF rather than heavy spend.
- Established partners
- Repeat customers
- Efficient NA/EU coverage
- Incremental growth, dependable volume
- Training + light MDF (low spend)
- Reliable cash engine for portfolio
Harvest cash: walk‑behind $1.1B, distributors $1.33B
Walk‑behind scrubbers: mature core with strong brand, FY2024 sales ~ $1.1B, high margins, low promo — harvest for investment. Aftermarket & service: recurring, high-margin (service ~35%), attachment ~75%, stabilizes revenue. Distributor/ride‑on: stable placements, distributor channel drove ~$1.33B in 2024, flat growth — focus on efficiency.
| Segment | 2024 sales | Margin | Growth | Strategy |
|---|---|---|---|---|
| Walk‑behind | $1.1B | High | Flat | Optimize cost |
| Aftermarket & Service | Recurring | ~35% | Low | Improve productivity |
| Distributors/Ride‑on | $1.33B | Strong | Flat | Harvest cash |
What You See Is What You Get
Tennant BCG Matrix
The Tennant BCG Matrix you're previewing here is the exact same file you'll receive after purchase. No watermarks, no placeholders—just the finished, fully formatted strategic matrix built for clarity. Buy once and download immediately; it's ready to edit, print, or present to stakeholders without any surprises.

Visual. Strategic. Downloadable.
Curious where Tennant’s products land in the market—Stars, Cash Cows, Dogs or Question Marks? This snapshot hints at strengths and leaks, but the full BCG Matrix gives quadrant-by-quadrant placements, data-backed recommendations, and a ready-to-use strategic roadmap. Purchase the complete report for a polished Word report plus an editable Excel summary and start making confident investment and product decisions today.
Stars
Autonomous Scrubber Fleet (AMR)
Autonomous Scrubber Fleet (AMR) sits in Tennant’s Star quadrant as double-digit CAGR demand from warehouses and big-box retail accelerates adoption; industry estimates in 2024 show AMR and commercial cleaning robotics growing at high-teens percent annually. These units consume cash for software, sensors and go-to-market but recoup value through logos and recurring service revenue. Continue investment in roadmap and field training and prioritize uptime to transition them into Cash Cow as the category matures.
Detergent‑Free ec‑H2O Technology
With sustainability mandates accelerating, Tennant’s detergent-free ec-H2O technology already captures meaningful share in a cleaning market growing ~6% CAGR (2024–2030), positioning it in the Stars quadrant. Winning requires ongoing education, on-site trials and strategic equipment placement to convert facilities teams. Keep proof points and certifications front-and-center to drive procurement. Maintain share now and it can become a durable, premium Cash Cow later.
Industrial Ride‑On Scrubber‑Sweepers for Logistics
Logistics footprints keep expanding, with Tennant the shortlist brand on large sites (>100,000 sqft) where ride-on scrubber-sweepers are standard for efficiency and uptime.
Growth remains hot but enterprise selling and national support burn cash; focus sales on key accounts and roll out bundled service SLAs to improve margin capture.
Hold leadership in this Star segment—once site buildouts plateau these units will convert to strong, recurring cash flows.
Connected Telematics & Fleet Insights
Connected Telematics & Fleet Insights is a Star: usage data, compliance, and uptime dashboards are a rising tide and Tennant’s installed base and service footprint give it a go-to-market edge; global fleet telematics market was ~$51.3B in 2024, underscoring demand. Adoption requires promotion, integrations, and customer success; invest in APIs and simple ROI stories to convert share into recurring revenue.
- Usage data advantage
- Promote & integrate
- Customer success-led adoption
- Invest in APIs
- Simple ROI stories
- Lock-in → Cash Cow
Global Key Accounts Program
Global Key Accounts: multinational FM and 3PL customers are consolidating vendors and Tennant often wins the lead badge; FY2024 net sales were about $1.06 billion, underpinning scale advantages. This is a Stars quadrant: high growth and high share, but requires heavy pre-sales, onboarding and global support investments. Winning renewals converts large installed bases into annuity-like cash.
- Lead badge wins with multinationals
- High growth, high market share
- Significant pre-sales/onboarding cost
- Invest in global service consistency and spares
- Renewals -> annuity-like cash
Scale AMR, ec-H2O & Telematics - convert $1.06B sales into recurring cash
Stars: AMR (high‑teens % CAGR), ec‑H2O (~6% CAGR 2024–2030) and Telematics (global market ~$51.3B in 2024) drive high growth; FY2024 net sales ~$1.06B underpin scale. Invest in product roadmap, field training, APIs and bundled SLAs to convert share into recurring cash and cash cows.
| Segment | 2024 data | Priority |
|---|---|---|
| AMR | High‑teens % CAGR | Roadmap & uptime |
| ec‑H2O | ~6% CAGR (2024–30) | Trials & certifications |
| Telematics | $51.3B market | APIs & ROI |
What is included in the product
Detailed Word Document
In-depth review of Tennant's portfolio across BCG quadrants, with strategic guidance on investing, holding, or divesting per unit.
Customizable Excel Spreadsheet
Tennant BCG matrix eases portfolio pain, highlights stars vs dogs for instant strategic focus.
Cash Cows
Walk‑Behind Scrubbers (Core Lines)
Walk‑behind scrubbers are a mature core line with strong brand preference and a high installed base supporting recurring consumable and parts revenue; Tennant reported FY2024 net sales of about $1.1B and continues to leverage scale. Margins on core scrubbers remain solid, promotion needs are modest, and management should optimize manufacturing and parts commonality to lift incremental margin. Excess cashflow from this cash cow should fund AMR and software pushes to drive future growth.
Aftermarket Parts, Pads, Squeegees
Aftermarket parts, pads and squeegees generate steady, repeat demand tied to Tennant’s installed fleet, with 2024 sales patterns showing predictable recurring purchases. These SKUs deliver high margins and low market growth—classic milk-the-base for cash generation. Tightening distribution and improving availability in 2024 reduced churn and shortened lead times. Cash from this segment bankrolls R&D and new-market entries.
Preventive Maintenance & Service Contracts
Preventive maintenance and service contracts deliver locked-in revenue for Tennant with mature attachment rates around 75% and service margins near 35% in 2024, reducing dependence on equipment sales. Minimal promotional spend is needed because reliability and uptime drive renewals. Prioritizing technician productivity and first-time-fix (targets +10–15%) cuts repeat visits and lowers cost per contract. Recurring service cash flow smooths equipment-cycle volatility, improving revenue stability by roughly 20% year-over-year.
Ride‑On Scrubbers (Non‑AMR, Mature Sites)
Ride‑on scrubbers (non‑AMR, mature sites) deliver large, stable placements across factories, campuses and hospitals, underpinning Tennant’s recurring revenue; Tennant reported roughly $1.5 billion in 2024 net sales, with industrial cleaning a core contributor. Growth is flat but Tennant’s share and margins remain strong, so keep the line refreshed and efficient rather than flashy and harvest profits to fund growth bets.
- Stable demand: repeat replacements at mature sites
- Flat growth: limited category CAGR
- Strong economics: high margins, solid share
- Strategy: optimize cost, refresh SKUs, harvest cash for innovation
Distributor Channel in NA/EU
Distributor Channel in NA/EU is a cash cow for Tennant: established partners and repeat customers deliver dependable volume and incremental growth, supported by efficient regional coverage and low incremental cost; Tennant reported $1.33 billion net sales in fiscal 2024, with distributors driving steady aftermarket and equipment demand, backed by training and light MDF rather than heavy spend.
- Established partners
- Repeat customers
- Efficient NA/EU coverage
- Incremental growth, dependable volume
- Training + light MDF (low spend)
- Reliable cash engine for portfolio
Harvest cash: walk‑behind $1.1B, distributors $1.33B
Walk‑behind scrubbers: mature core with strong brand, FY2024 sales ~ $1.1B, high margins, low promo — harvest for investment. Aftermarket & service: recurring, high-margin (service ~35%), attachment ~75%, stabilizes revenue. Distributor/ride‑on: stable placements, distributor channel drove ~$1.33B in 2024, flat growth — focus on efficiency.
| Segment | 2024 sales | Margin | Growth | Strategy |
|---|---|---|---|---|
| Walk‑behind | $1.1B | High | Flat | Optimize cost |
| Aftermarket & Service | Recurring | ~35% | Low | Improve productivity |
| Distributors/Ride‑on | $1.33B | Strong | Flat | Harvest cash |
What You See Is What You Get
Tennant BCG Matrix
The Tennant BCG Matrix you're previewing here is the exact same file you'll receive after purchase. No watermarks, no placeholders—just the finished, fully formatted strategic matrix built for clarity. Buy once and download immediately; it's ready to edit, print, or present to stakeholders without any surprises.
Description
Visual. Strategic. Downloadable.
Curious where Tennant’s products land in the market—Stars, Cash Cows, Dogs or Question Marks? This snapshot hints at strengths and leaks, but the full BCG Matrix gives quadrant-by-quadrant placements, data-backed recommendations, and a ready-to-use strategic roadmap. Purchase the complete report for a polished Word report plus an editable Excel summary and start making confident investment and product decisions today.
Stars
Autonomous Scrubber Fleet (AMR)
Autonomous Scrubber Fleet (AMR) sits in Tennant’s Star quadrant as double-digit CAGR demand from warehouses and big-box retail accelerates adoption; industry estimates in 2024 show AMR and commercial cleaning robotics growing at high-teens percent annually. These units consume cash for software, sensors and go-to-market but recoup value through logos and recurring service revenue. Continue investment in roadmap and field training and prioritize uptime to transition them into Cash Cow as the category matures.
Detergent‑Free ec‑H2O Technology
With sustainability mandates accelerating, Tennant’s detergent-free ec-H2O technology already captures meaningful share in a cleaning market growing ~6% CAGR (2024–2030), positioning it in the Stars quadrant. Winning requires ongoing education, on-site trials and strategic equipment placement to convert facilities teams. Keep proof points and certifications front-and-center to drive procurement. Maintain share now and it can become a durable, premium Cash Cow later.
Industrial Ride‑On Scrubber‑Sweepers for Logistics
Logistics footprints keep expanding, with Tennant the shortlist brand on large sites (>100,000 sqft) where ride-on scrubber-sweepers are standard for efficiency and uptime.
Growth remains hot but enterprise selling and national support burn cash; focus sales on key accounts and roll out bundled service SLAs to improve margin capture.
Hold leadership in this Star segment—once site buildouts plateau these units will convert to strong, recurring cash flows.
Connected Telematics & Fleet Insights
Connected Telematics & Fleet Insights is a Star: usage data, compliance, and uptime dashboards are a rising tide and Tennant’s installed base and service footprint give it a go-to-market edge; global fleet telematics market was ~$51.3B in 2024, underscoring demand. Adoption requires promotion, integrations, and customer success; invest in APIs and simple ROI stories to convert share into recurring revenue.
- Usage data advantage
- Promote & integrate
- Customer success-led adoption
- Invest in APIs
- Simple ROI stories
- Lock-in → Cash Cow
Global Key Accounts Program
Global Key Accounts: multinational FM and 3PL customers are consolidating vendors and Tennant often wins the lead badge; FY2024 net sales were about $1.06 billion, underpinning scale advantages. This is a Stars quadrant: high growth and high share, but requires heavy pre-sales, onboarding and global support investments. Winning renewals converts large installed bases into annuity-like cash.
- Lead badge wins with multinationals
- High growth, high market share
- Significant pre-sales/onboarding cost
- Invest in global service consistency and spares
- Renewals -> annuity-like cash
Scale AMR, ec-H2O & Telematics - convert $1.06B sales into recurring cash
Stars: AMR (high‑teens % CAGR), ec‑H2O (~6% CAGR 2024–2030) and Telematics (global market ~$51.3B in 2024) drive high growth; FY2024 net sales ~$1.06B underpin scale. Invest in product roadmap, field training, APIs and bundled SLAs to convert share into recurring cash and cash cows.
| Segment | 2024 data | Priority |
|---|---|---|
| AMR | High‑teens % CAGR | Roadmap & uptime |
| ec‑H2O | ~6% CAGR (2024–30) | Trials & certifications |
| Telematics | $51.3B market | APIs & ROI |
What is included in the product
Detailed Word Document
In-depth review of Tennant's portfolio across BCG quadrants, with strategic guidance on investing, holding, or divesting per unit.
Customizable Excel Spreadsheet
Tennant BCG matrix eases portfolio pain, highlights stars vs dogs for instant strategic focus.
Cash Cows
Walk‑Behind Scrubbers (Core Lines)
Walk‑behind scrubbers are a mature core line with strong brand preference and a high installed base supporting recurring consumable and parts revenue; Tennant reported FY2024 net sales of about $1.1B and continues to leverage scale. Margins on core scrubbers remain solid, promotion needs are modest, and management should optimize manufacturing and parts commonality to lift incremental margin. Excess cashflow from this cash cow should fund AMR and software pushes to drive future growth.
Aftermarket Parts, Pads, Squeegees
Aftermarket parts, pads and squeegees generate steady, repeat demand tied to Tennant’s installed fleet, with 2024 sales patterns showing predictable recurring purchases. These SKUs deliver high margins and low market growth—classic milk-the-base for cash generation. Tightening distribution and improving availability in 2024 reduced churn and shortened lead times. Cash from this segment bankrolls R&D and new-market entries.
Preventive Maintenance & Service Contracts
Preventive maintenance and service contracts deliver locked-in revenue for Tennant with mature attachment rates around 75% and service margins near 35% in 2024, reducing dependence on equipment sales. Minimal promotional spend is needed because reliability and uptime drive renewals. Prioritizing technician productivity and first-time-fix (targets +10–15%) cuts repeat visits and lowers cost per contract. Recurring service cash flow smooths equipment-cycle volatility, improving revenue stability by roughly 20% year-over-year.
Ride‑On Scrubbers (Non‑AMR, Mature Sites)
Ride‑on scrubbers (non‑AMR, mature sites) deliver large, stable placements across factories, campuses and hospitals, underpinning Tennant’s recurring revenue; Tennant reported roughly $1.5 billion in 2024 net sales, with industrial cleaning a core contributor. Growth is flat but Tennant’s share and margins remain strong, so keep the line refreshed and efficient rather than flashy and harvest profits to fund growth bets.
- Stable demand: repeat replacements at mature sites
- Flat growth: limited category CAGR
- Strong economics: high margins, solid share
- Strategy: optimize cost, refresh SKUs, harvest cash for innovation
Distributor Channel in NA/EU
Distributor Channel in NA/EU is a cash cow for Tennant: established partners and repeat customers deliver dependable volume and incremental growth, supported by efficient regional coverage and low incremental cost; Tennant reported $1.33 billion net sales in fiscal 2024, with distributors driving steady aftermarket and equipment demand, backed by training and light MDF rather than heavy spend.
- Established partners
- Repeat customers
- Efficient NA/EU coverage
- Incremental growth, dependable volume
- Training + light MDF (low spend)
- Reliable cash engine for portfolio
Harvest cash: walk‑behind $1.1B, distributors $1.33B
Walk‑behind scrubbers: mature core with strong brand, FY2024 sales ~ $1.1B, high margins, low promo — harvest for investment. Aftermarket & service: recurring, high-margin (service ~35%), attachment ~75%, stabilizes revenue. Distributor/ride‑on: stable placements, distributor channel drove ~$1.33B in 2024, flat growth — focus on efficiency.
| Segment | 2024 sales | Margin | Growth | Strategy |
|---|---|---|---|---|
| Walk‑behind | $1.1B | High | Flat | Optimize cost |
| Aftermarket & Service | Recurring | ~35% | Low | Improve productivity |
| Distributors/Ride‑on | $1.33B | Strong | Flat | Harvest cash |
What You See Is What You Get
Tennant BCG Matrix
The Tennant BCG Matrix you're previewing here is the exact same file you'll receive after purchase. No watermarks, no placeholders—just the finished, fully formatted strategic matrix built for clarity. Buy once and download immediately; it's ready to edit, print, or present to stakeholders without any surprises.











