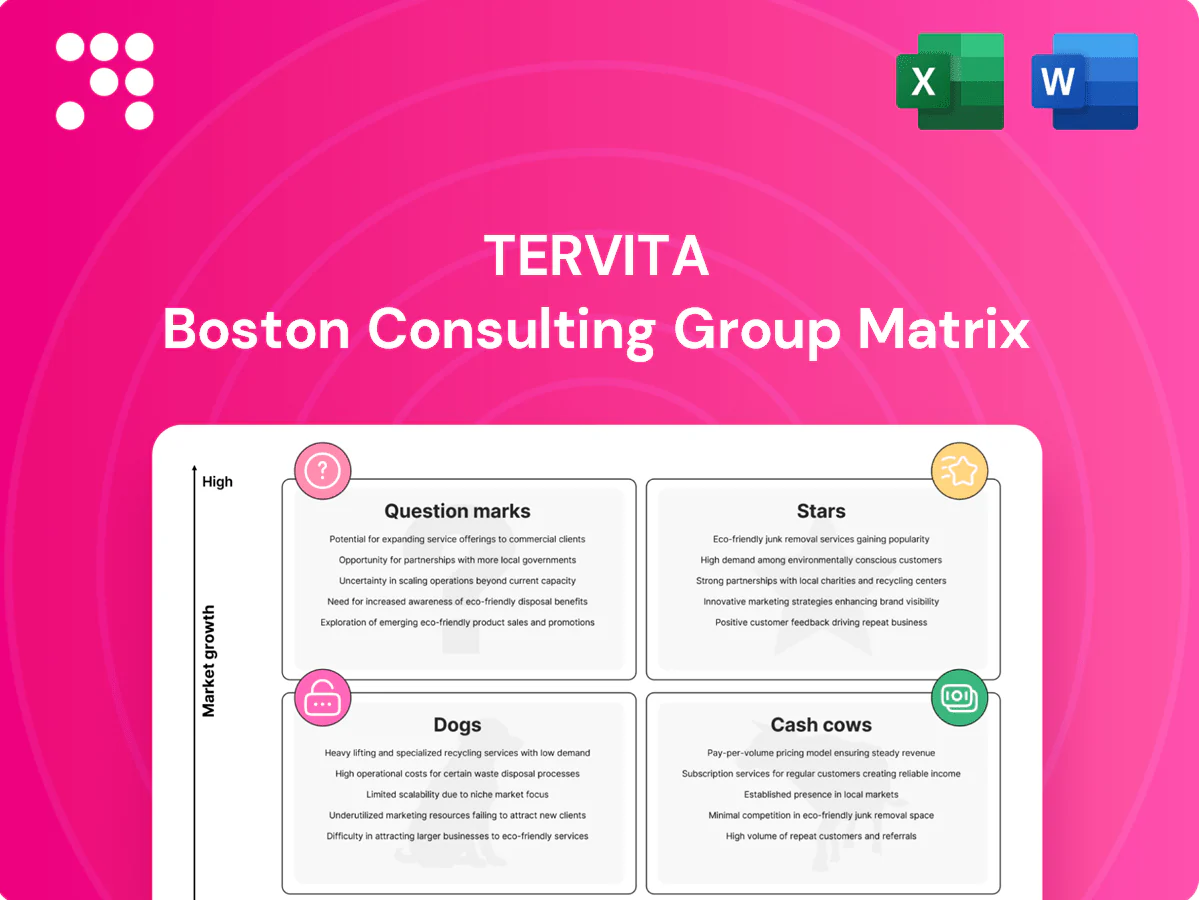
Tervita Boston Consulting Group Matrix

Actionable Strategy Starts Here
Curious where Tervita’s assets and services fall—Stars, Cash Cows, Dogs, or Question Marks? This preview scratches the surface; buy the full BCG Matrix for quadrant-by-quadrant placement, data-backed recommendations, and a practical roadmap to reallocate capital wisely. Instant download in Word + Excel to use in meetings today.
Stars

Produced‑water disposal in high‑activity basins
High drilling and completion cycles keep produced‑water volumes flowing—US annual produced‑water is estimated at ~21 billion barrels (2023) with the Permian the largest contributor—placing Tervita’s disposal network squarely where operators need it. Strong market share and continued basin growth qualify this as a star; maintain investments in capacity, uptime, and turn times to protect and extend the lead.
Integrated waste management for top-tier E&P clients
Bundled collection, processing and compliant handling position Tervita to capture large E&P programs where integrated contracts create stickiness. With global oil output near 80 million bpd in 2024 and an average produced water:oil ratio around 3:1, waste volumes are massive, so centralized vendors can scale share rapidly. Doubling down on service reliability and real-time data transparency keeps Tervita the default partner.

Environmental remediation on large field redevelopments
Regulatory pressure and field revitalization create steady, growing demand, with large remediation contracts typically spanning 3–7 years and drawing predictable backlog. Tervita’s track record in complex sites helps it win multi‑year jobs and secure repeat clients. Focus on scale execution and strict project controls preserves target margins (12–18%) so profitability holds while growth runs hot.

Lifecycle facility network adjacent to major plays
Lifecycle facility network adjacent to major plays reduces trucking time and exposure to road-transport risks, enabling faster turnarounds and higher margins as basin activity scales; sites capture outsized throughput during production upcycles and support service continuity. Keep optimizing routing and adding modular capacity to manage volume swings and improve utilization and unit economics.
- Proximity: lowers transit time and risk
- Throughput: captures peak basin volumes
- Operations: routing optimization critical
- Capacity: modular additions for agility
Compliance-driven waste processing services
Compliance-driven waste processing is a Star for Tervita as stricter 2024 standards lift a global waste-management market estimated near USD 2.1 trillion, favoring established operators; Tervita’s certified facilities position it as the safe pick when regulatory and reputational stakes are high. Keep investing in audit readiness and transparent reporting to de-risk clients’ ESG claims and capture premium contracts.
Produced-water surge: ~21B bbl US (2023), 3:1 W:O — capacity & uptime win
High drilling drives ~21B bbl produced water (US, 2023) with Permian largest; Tervita’s disposal network is well‑placed—maintain capacity, uptime and turn times. Integrated collection-to‑disposal wins large E&P programs as oil ~80M bpd (2024) with ~3:1 water:oil; target margins 12–18% on multi‑year contracts. Regulatory tightening (waste market ~USD2.1T, 2024) raises barriers; audit readiness is critical.
| Metric | Value |
|---|---|
| US produced water (2023) | ~21B bbl |
| Global oil (2024) | ~80M bpd |
| Water:Oil ratio | ~3:1 |
| Waste market (2024) | ~USD2.1T |
| Target margins | 12–18% |
What is included in the product
 Detailed Word Document
Comprehensive BCG analysis of Tervita's units - identifies Stars, Cash Cows, Question Marks, Dogs and recommends invest, hold or divest.

 Customizable Excel Spreadsheet
One-page Tervita BCG Matrix placing each business unit in a quadrant for fast portfolio clarity
Cash Cows

Routine industrial waste collection and transfer
Routine industrial waste collection and transfer is a classic cash cow for Tervita: mature, predictable routes with repeat customers and largely depreciated fleet deliver steady cash flow; industry collection services in North America show EBITDA around 18% in 2024. Maintain fleet efficiency and service SLAs to preserve margins. No need to overspend on growth—optimize OPEX and cash conversion.
Long-term water disposal contracts
Long-term water disposal contracts deliver stable volumes under contract, producing reliable, predictable cash flow for Tervita as a cash cow. The infrastructure is already built, keeping incremental capital low while variable costs remain manageable. Focus on protecting uptime and operational reliability, renegotiating rates modestly where market allows, and keeping maintenance sharp to sustain and milk margins.

Standard environmental monitoring and reporting
Standard environmental monitoring and reporting is a Cash Cow for Tervita: compliance work renews predictably (renewal rates around 90% in industry benchmarks) and invoices are collected on schedule, producing steady cash flow. Templates, tools and trained teams drive delivery efficiency, sustaining gross margins in the mid-20s to mid-30s. Maintain quality, automate paperwork (admin time cut ~50%) and bank the spread.

Mature remediation maintenance programs
Mature remediation maintenance programs—post-closure monitoring and routine site care—deliver steady, high-margin recurring cash flows for Tervita; 2024 industry data indicates recurring contracts can comprise about 50% of remediation segment revenue. Limited competitive heat and repeat scope keep unit costs low. Keep staffing lean, apply standardized playbooks, and extend contract terms where possible to sustain margins.
- Steady recurring revenue ~50% of segment
- Low competition, repeatable scopes
- Lean staffing + playbooks + term extensions
Established landfill and transfer station throughput
Established landfill and transfer station throughput continues to generate steady cash in 2024, with regional volumes remaining resilient and utilization rates typically around 80–90% across comparable Canadian sites.
High sunk capex and long asset lives underpin strong free cash flow margins, while operational focus on safety and incremental process improvements reduces variability and preserves earnings quality.
- Throughput resilience: 2024 regional demand stable
- Utilization: ~80–90%
- Capex: majority sunk; supports cash conversion
- Focus: reliability, safety, incremental ops gains
Protect uptime, cut OPEX & automate admin to lock in collection EBITDA ~18%
Routine collection, water disposal, remediation maintenance and landfill throughput are Tervita cash cows: predictable volumes, high sunk capex and 2024 EBITDA benchmarks ~18% (collection) with remediation recurring revenue ~50% of segment and utilization ~80–90%. Protect uptime, optimize OPEX, extend contract terms and automate admin to preserve cash conversion.
| Metric | 2024 Value | Priority |
|---|---|---|
| Collection EBITDA | ~18% | Efficiency |
| Remediation recurring | ~50% | Contract lengthen |
| Utilization | 80–90% | Reliability |
What You See Is What You Get
Tervita BCG Matrix
The file you're previewing is the exact BCG Matrix report you'll receive after purchase. No watermarks, no demo slides—just a fully formatted, ready-to-use analysis built for quick strategic decisions. It arrives immediately to your inbox and is editable, printable, presentable. Buy once, deploy fast—no surprises, no edits required.

Actionable Strategy Starts Here
Curious where Tervita’s assets and services fall—Stars, Cash Cows, Dogs, or Question Marks? This preview scratches the surface; buy the full BCG Matrix for quadrant-by-quadrant placement, data-backed recommendations, and a practical roadmap to reallocate capital wisely. Instant download in Word + Excel to use in meetings today.
Stars
Produced‑water disposal in high‑activity basins
High drilling and completion cycles keep produced‑water volumes flowing—US annual produced‑water is estimated at ~21 billion barrels (2023) with the Permian the largest contributor—placing Tervita’s disposal network squarely where operators need it. Strong market share and continued basin growth qualify this as a star; maintain investments in capacity, uptime, and turn times to protect and extend the lead.
Integrated waste management for top-tier E&P clients
Bundled collection, processing and compliant handling position Tervita to capture large E&P programs where integrated contracts create stickiness. With global oil output near 80 million bpd in 2024 and an average produced water:oil ratio around 3:1, waste volumes are massive, so centralized vendors can scale share rapidly. Doubling down on service reliability and real-time data transparency keeps Tervita the default partner.
Environmental remediation on large field redevelopments
Regulatory pressure and field revitalization create steady, growing demand, with large remediation contracts typically spanning 3–7 years and drawing predictable backlog. Tervita’s track record in complex sites helps it win multi‑year jobs and secure repeat clients. Focus on scale execution and strict project controls preserves target margins (12–18%) so profitability holds while growth runs hot.
Lifecycle facility network adjacent to major plays
Lifecycle facility network adjacent to major plays reduces trucking time and exposure to road-transport risks, enabling faster turnarounds and higher margins as basin activity scales; sites capture outsized throughput during production upcycles and support service continuity. Keep optimizing routing and adding modular capacity to manage volume swings and improve utilization and unit economics.
- Proximity: lowers transit time and risk
- Throughput: captures peak basin volumes
- Operations: routing optimization critical
- Capacity: modular additions for agility
Compliance-driven waste processing services
Compliance-driven waste processing is a Star for Tervita as stricter 2024 standards lift a global waste-management market estimated near USD 2.1 trillion, favoring established operators; Tervita’s certified facilities position it as the safe pick when regulatory and reputational stakes are high. Keep investing in audit readiness and transparent reporting to de-risk clients’ ESG claims and capture premium contracts.
Produced-water surge: ~21B bbl US (2023), 3:1 W:O — capacity & uptime win
High drilling drives ~21B bbl produced water (US, 2023) with Permian largest; Tervita’s disposal network is well‑placed—maintain capacity, uptime and turn times. Integrated collection-to‑disposal wins large E&P programs as oil ~80M bpd (2024) with ~3:1 water:oil; target margins 12–18% on multi‑year contracts. Regulatory tightening (waste market ~USD2.1T, 2024) raises barriers; audit readiness is critical.
| Metric | Value |
|---|---|
| US produced water (2023) | ~21B bbl |
| Global oil (2024) | ~80M bpd |
| Water:Oil ratio | ~3:1 |
| Waste market (2024) | ~USD2.1T |
| Target margins | 12–18% |
What is included in the product
Detailed Word Document
Comprehensive BCG analysis of Tervita's units - identifies Stars, Cash Cows, Question Marks, Dogs and recommends invest, hold or divest.
Customizable Excel Spreadsheet
One-page Tervita BCG Matrix placing each business unit in a quadrant for fast portfolio clarity
Cash Cows
Routine industrial waste collection and transfer
Routine industrial waste collection and transfer is a classic cash cow for Tervita: mature, predictable routes with repeat customers and largely depreciated fleet deliver steady cash flow; industry collection services in North America show EBITDA around 18% in 2024. Maintain fleet efficiency and service SLAs to preserve margins. No need to overspend on growth—optimize OPEX and cash conversion.
Long-term water disposal contracts
Long-term water disposal contracts deliver stable volumes under contract, producing reliable, predictable cash flow for Tervita as a cash cow. The infrastructure is already built, keeping incremental capital low while variable costs remain manageable. Focus on protecting uptime and operational reliability, renegotiating rates modestly where market allows, and keeping maintenance sharp to sustain and milk margins.
Standard environmental monitoring and reporting
Standard environmental monitoring and reporting is a Cash Cow for Tervita: compliance work renews predictably (renewal rates around 90% in industry benchmarks) and invoices are collected on schedule, producing steady cash flow. Templates, tools and trained teams drive delivery efficiency, sustaining gross margins in the mid-20s to mid-30s. Maintain quality, automate paperwork (admin time cut ~50%) and bank the spread.
Mature remediation maintenance programs
Mature remediation maintenance programs—post-closure monitoring and routine site care—deliver steady, high-margin recurring cash flows for Tervita; 2024 industry data indicates recurring contracts can comprise about 50% of remediation segment revenue. Limited competitive heat and repeat scope keep unit costs low. Keep staffing lean, apply standardized playbooks, and extend contract terms where possible to sustain margins.
- Steady recurring revenue ~50% of segment
- Low competition, repeatable scopes
- Lean staffing + playbooks + term extensions
Established landfill and transfer station throughput
Established landfill and transfer station throughput continues to generate steady cash in 2024, with regional volumes remaining resilient and utilization rates typically around 80–90% across comparable Canadian sites.
High sunk capex and long asset lives underpin strong free cash flow margins, while operational focus on safety and incremental process improvements reduces variability and preserves earnings quality.
- Throughput resilience: 2024 regional demand stable
- Utilization: ~80–90%
- Capex: majority sunk; supports cash conversion
- Focus: reliability, safety, incremental ops gains
Protect uptime, cut OPEX & automate admin to lock in collection EBITDA ~18%
Routine collection, water disposal, remediation maintenance and landfill throughput are Tervita cash cows: predictable volumes, high sunk capex and 2024 EBITDA benchmarks ~18% (collection) with remediation recurring revenue ~50% of segment and utilization ~80–90%. Protect uptime, optimize OPEX, extend contract terms and automate admin to preserve cash conversion.
| Metric | 2024 Value | Priority |
|---|---|---|
| Collection EBITDA | ~18% | Efficiency |
| Remediation recurring | ~50% | Contract lengthen |
| Utilization | 80–90% | Reliability |
What You See Is What You Get
Tervita BCG Matrix
The file you're previewing is the exact BCG Matrix report you'll receive after purchase. No watermarks, no demo slides—just a fully formatted, ready-to-use analysis built for quick strategic decisions. It arrives immediately to your inbox and is editable, printable, presentable. Buy once, deploy fast—no surprises, no edits required.
Description
Actionable Strategy Starts Here
Curious where Tervita’s assets and services fall—Stars, Cash Cows, Dogs, or Question Marks? This preview scratches the surface; buy the full BCG Matrix for quadrant-by-quadrant placement, data-backed recommendations, and a practical roadmap to reallocate capital wisely. Instant download in Word + Excel to use in meetings today.
Stars
Produced‑water disposal in high‑activity basins
High drilling and completion cycles keep produced‑water volumes flowing—US annual produced‑water is estimated at ~21 billion barrels (2023) with the Permian the largest contributor—placing Tervita’s disposal network squarely where operators need it. Strong market share and continued basin growth qualify this as a star; maintain investments in capacity, uptime, and turn times to protect and extend the lead.
Integrated waste management for top-tier E&P clients
Bundled collection, processing and compliant handling position Tervita to capture large E&P programs where integrated contracts create stickiness. With global oil output near 80 million bpd in 2024 and an average produced water:oil ratio around 3:1, waste volumes are massive, so centralized vendors can scale share rapidly. Doubling down on service reliability and real-time data transparency keeps Tervita the default partner.
Environmental remediation on large field redevelopments
Regulatory pressure and field revitalization create steady, growing demand, with large remediation contracts typically spanning 3–7 years and drawing predictable backlog. Tervita’s track record in complex sites helps it win multi‑year jobs and secure repeat clients. Focus on scale execution and strict project controls preserves target margins (12–18%) so profitability holds while growth runs hot.
Lifecycle facility network adjacent to major plays
Lifecycle facility network adjacent to major plays reduces trucking time and exposure to road-transport risks, enabling faster turnarounds and higher margins as basin activity scales; sites capture outsized throughput during production upcycles and support service continuity. Keep optimizing routing and adding modular capacity to manage volume swings and improve utilization and unit economics.
- Proximity: lowers transit time and risk
- Throughput: captures peak basin volumes
- Operations: routing optimization critical
- Capacity: modular additions for agility
Compliance-driven waste processing services
Compliance-driven waste processing is a Star for Tervita as stricter 2024 standards lift a global waste-management market estimated near USD 2.1 trillion, favoring established operators; Tervita’s certified facilities position it as the safe pick when regulatory and reputational stakes are high. Keep investing in audit readiness and transparent reporting to de-risk clients’ ESG claims and capture premium contracts.
Produced-water surge: ~21B bbl US (2023), 3:1 W:O — capacity & uptime win
High drilling drives ~21B bbl produced water (US, 2023) with Permian largest; Tervita’s disposal network is well‑placed—maintain capacity, uptime and turn times. Integrated collection-to‑disposal wins large E&P programs as oil ~80M bpd (2024) with ~3:1 water:oil; target margins 12–18% on multi‑year contracts. Regulatory tightening (waste market ~USD2.1T, 2024) raises barriers; audit readiness is critical.
| Metric | Value |
|---|---|
| US produced water (2023) | ~21B bbl |
| Global oil (2024) | ~80M bpd |
| Water:Oil ratio | ~3:1 |
| Waste market (2024) | ~USD2.1T |
| Target margins | 12–18% |
What is included in the product
Detailed Word Document
Comprehensive BCG analysis of Tervita's units - identifies Stars, Cash Cows, Question Marks, Dogs and recommends invest, hold or divest.
Customizable Excel Spreadsheet
One-page Tervita BCG Matrix placing each business unit in a quadrant for fast portfolio clarity
Cash Cows
Routine industrial waste collection and transfer
Routine industrial waste collection and transfer is a classic cash cow for Tervita: mature, predictable routes with repeat customers and largely depreciated fleet deliver steady cash flow; industry collection services in North America show EBITDA around 18% in 2024. Maintain fleet efficiency and service SLAs to preserve margins. No need to overspend on growth—optimize OPEX and cash conversion.
Long-term water disposal contracts
Long-term water disposal contracts deliver stable volumes under contract, producing reliable, predictable cash flow for Tervita as a cash cow. The infrastructure is already built, keeping incremental capital low while variable costs remain manageable. Focus on protecting uptime and operational reliability, renegotiating rates modestly where market allows, and keeping maintenance sharp to sustain and milk margins.
Standard environmental monitoring and reporting
Standard environmental monitoring and reporting is a Cash Cow for Tervita: compliance work renews predictably (renewal rates around 90% in industry benchmarks) and invoices are collected on schedule, producing steady cash flow. Templates, tools and trained teams drive delivery efficiency, sustaining gross margins in the mid-20s to mid-30s. Maintain quality, automate paperwork (admin time cut ~50%) and bank the spread.
Mature remediation maintenance programs
Mature remediation maintenance programs—post-closure monitoring and routine site care—deliver steady, high-margin recurring cash flows for Tervita; 2024 industry data indicates recurring contracts can comprise about 50% of remediation segment revenue. Limited competitive heat and repeat scope keep unit costs low. Keep staffing lean, apply standardized playbooks, and extend contract terms where possible to sustain margins.
- Steady recurring revenue ~50% of segment
- Low competition, repeatable scopes
- Lean staffing + playbooks + term extensions
Established landfill and transfer station throughput
Established landfill and transfer station throughput continues to generate steady cash in 2024, with regional volumes remaining resilient and utilization rates typically around 80–90% across comparable Canadian sites.
High sunk capex and long asset lives underpin strong free cash flow margins, while operational focus on safety and incremental process improvements reduces variability and preserves earnings quality.
- Throughput resilience: 2024 regional demand stable
- Utilization: ~80–90%
- Capex: majority sunk; supports cash conversion
- Focus: reliability, safety, incremental ops gains
Protect uptime, cut OPEX & automate admin to lock in collection EBITDA ~18%
Routine collection, water disposal, remediation maintenance and landfill throughput are Tervita cash cows: predictable volumes, high sunk capex and 2024 EBITDA benchmarks ~18% (collection) with remediation recurring revenue ~50% of segment and utilization ~80–90%. Protect uptime, optimize OPEX, extend contract terms and automate admin to preserve cash conversion.
| Metric | 2024 Value | Priority |
|---|---|---|
| Collection EBITDA | ~18% | Efficiency |
| Remediation recurring | ~50% | Contract lengthen |
| Utilization | 80–90% | Reliability |
What You See Is What You Get
Tervita BCG Matrix
The file you're previewing is the exact BCG Matrix report you'll receive after purchase. No watermarks, no demo slides—just a fully formatted, ready-to-use analysis built for quick strategic decisions. It arrives immediately to your inbox and is editable, printable, presentable. Buy once, deploy fast—no surprises, no edits required.











