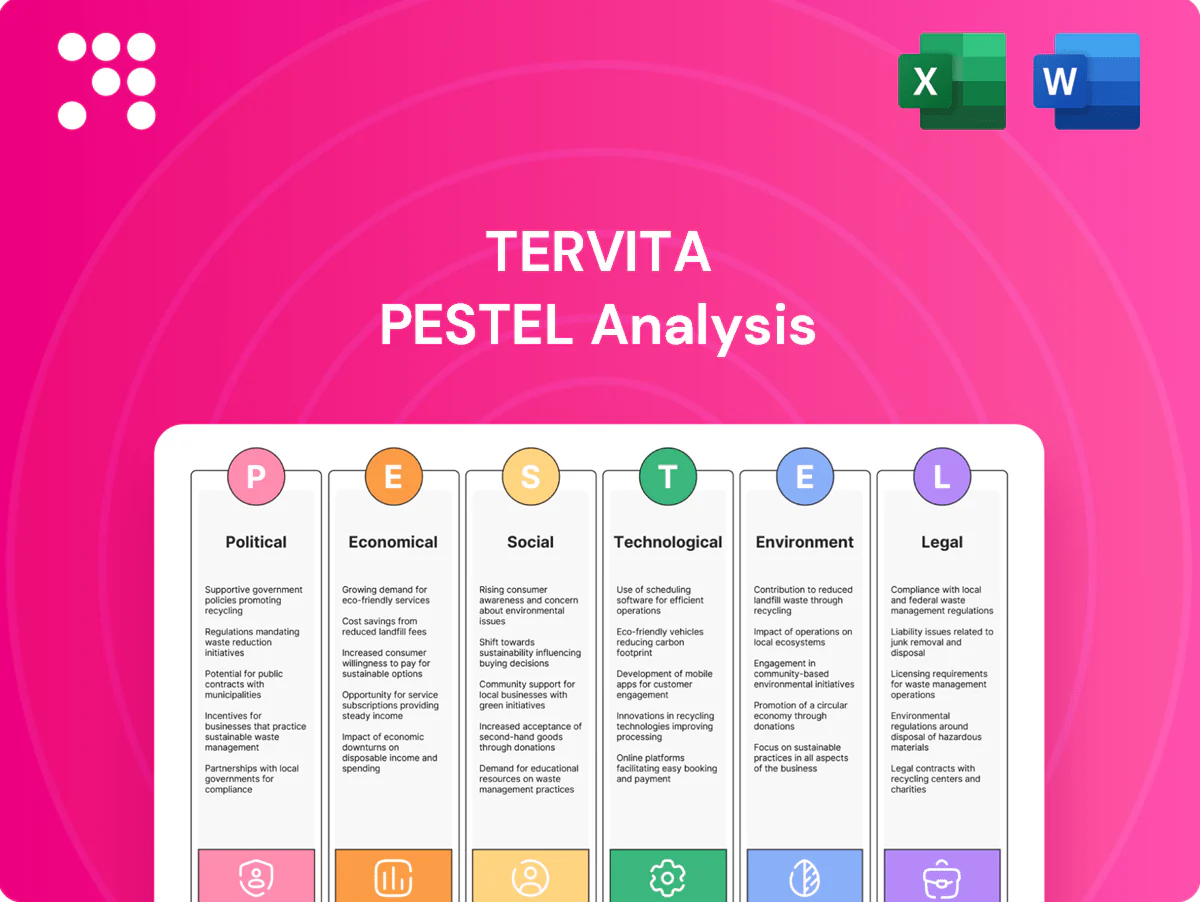
Tervita PESTLE Analysis

Make Smarter Strategic Decisions with a Complete PESTEL View
Discover how political shifts, economic cycles, regulatory pressure, technological change, social trends, and environmental risks converge to shape Tervita’s strategy and value—our PESTLE distills these forces into clear implications. Ideal for investors and planners, the full, ready-to-use analysis gives actionable insights and forecasts. Purchase now to download the complete report instantly.
Political factors

Energy policy direction
Shifts in federal and provincial energy strategies directly alter drilling intensity and waste volumes; Canada's carbon price rose to CAD 65/t in 2023 and is scheduled to reach CAD 170/t by 2030, influencing capital allocation. Supportive incentives and royalty credits can spur upstream activity and lift demand for disposal and remediation services. Conversely, decarbonization mandates and methane rules can curtail fossil investment and shift Tervita's service mix, so Tervita must hedge exposure across policy cycles.
Carbon pricing signals
Federal carbon pricing was CAD 65/tonne in 2023 and is legislated to rise to CAD 170/tonne by 2030, altering Tervita’s cost base as taxes and cap-and-trade affect hauling fuel, facility energy and landfill operations. Higher prices favor recycling and waste-to-value projects and lower-emission logistics, while predictable pricing supports long-term tech CAPEX decisions.

Provincial regulatory variance
Provincial regulatory variance across four jurisdictions—Alberta, British Columbia, Saskatchewan and others—creates material differences in facility siting, permitting timelines and waste classifications that affect Tervitas throughput and margins.
Permit timelines and classification rules vary by province, complicating cross-border logistics and capacity utilization while making harmonization a clear efficiency lever.
Tervitas regulatory fluency and local stakeholder engagement position it to capture network benefits as provinces move toward greater alignment.

Indigenous relations and approvals
Projects often intersect with Indigenous lands and rights; Indigenous peoples comprised 5.0% of Canada’s population in the 2021 Census, increasing community impacts and consultation needs. Early consultation and impact-benefit agreements under the federal Impact Assessment Act (2019) reduce approval risk and delays and strengthen social licence. Non-compliance has led to court injunctions halting projects and causing material reputational and financial harm.
- Consultation requirement: Impact Assessment Act (2019)
- Indigenous population (2021): 5.0% of Canada
- Benefit agreements: lower approval delays, improved workforce access
- Non-compliance: risk of injunctions, operational halts
Trade and cross-border flows
US-Canada relations and USMCA-era protocols govern transboundary waste and equipment movement, with two-way goods trade exceeding roughly US$1 trillion in 2024, keeping cross-border logistics critical for Tervita. Tariffs are low under USMCA but customs rules and transport policies drive cost and turnaround; harmonized standards improve asset utilization while disruptions force contingency routing and temporary storage capacity.
- Trade framework: USMCA continuity
- 2024 trade: ~US$1 trillion two-way goods
- Operational impact: tariffs low, customs/process delays raise costs
- Mitigation: harmonized standards, contingency routing, spare storage
Policy shifts raise drilling costs and approvals risk; CAD 65→170/t
Federal/provincial energy policy shifts change drilling intensity and waste volumes; federal carbon price was CAD 65/t in 2023 and is legislated to reach CAD 170/t by 2030, altering cost and CAPEX signals. Provincial regulatory variance (Alberta, BC, Saskatchewan, others) and permit timelines drive site economics and margins. Indigenous consultation (5.0% pop, 2021) and the Impact Assessment Act raise approval risk; US‑Canada two‑way trade ~US$1T (2024) keeps cross‑border logistics strategic.
| Factor | Key metric | Operational impact |
|---|---|---|
| Carbon price | CAD 65/t (2023) → CAD 170/t (2030) | Drives recycling, CAPEX timing |
| Provincial variance | AB, BC, SK, others | Permits, classifications, margins |
| Indigenous | 5.0% pop (2021) | Consultation, IBA, approval risk |
| Trade | ~US$1T two‑way (2024) | Cross‑border logistics, customs delays |
What is included in the product
 Detailed Word Document
Explores how macro-environmental forces uniquely impact Tervita across Political, Economic, Social, Technological, Environmental and Legal dimensions, with data-backed trends and region-specific examples to identify risks and opportunities for executives, investors and strategists.

 Customizable Excel Spreadsheet
A concise, visually segmented Tervita PESTLE summary that’s easy to drop into presentations, editable for local context, and shareable across teams to quickly align on external risks and strategic positioning during planning sessions.
Economic factors

Oil and gas cycle exposure
Waste volumes at Tervita closely follow drilling, completions and production activity; with WTI averaging about $80/bbl in 2024, price downturns compressed volumes and pricing across service lines. Upcycles strain disposal and treatment capacity and lifted margins during 2023–24 recovery periods. Counter-cyclical remediation work provided partial revenue cushioning, and a balanced basin portfolio reduced regional volatility.
Inflation and input costs
Diesel, chemicals, steel and labour remain primary OPEX drivers for Tervita; diesel averaged about $85/barrel in 2024 and fuel/consumables can represent roughly 8–12% of site operating costs. Persistent inflation (Canada CPI ~3.0% in 2024) pressures unindexed contracts. Operational efficiency and route optimization protect margins, while supplier hedging reduces consumables volatility.

Interest rates and capex
Higher interest rates raise financing costs for new facilities and remediation equipment, with Bank of Canada policy at 5.00% and the US Fed funds target around 5.25–5.50% in 2024–25, increasing borrowing spreads for service providers. Producers commonly defer projects under tighter credit, reducing demand for environmental and remediation services. Flexible capex and modular builds improve ROI when credit tightens, while strong cash generation funds maintenance and compliance spend.

FX and USD exposure
CAD/USD shifts (USD ~1.34 per CAD mid‑2025) push imported equipment and cross‑border service costs higher; a weaker CAD raises Tervita capex in CAD terms but can boost USD‑priced export margins. Active hedging reduces procurement budgeting volatility, while contractual pricing clauses enable pass‑through of currency impacts to customers.
- FX exposure: USD/CAD ~1.34 (mid‑2025)
- Capex risk: imported equipment cost up when CAD weakens
- Mitigation: hedging smooths budgets
- Contract tool: pricing pass‑through clauses
Industry consolidation
M&A among producers and service firms shifts bargaining power and network requirements; Secure Energy completed the acquisition of Tervita in 2021, illustrating sector consolidation and client demand for scale. Larger clients increasingly require integrated, standardized solutions and volume discounts, while consolidation can unlock routing and facility-utilization synergies. Antitrust review continues to influence deal timing and structure.
- Bargaining power: increased
- Client demand: integrated solutions, discounts
- Synergies: routing & facility utilization
- Regulatory: antitrust shapes pace
Policy shifts raise drilling costs and approvals risk; CAD 65→170/t
Waste volumes follow drilling with WTI ≈ $80/bbl (2024); upcycles tightened disposal capacity and lifted margins, while remediation softened downturns. Diesel ≈ $85/bbl (2024) and Canada CPI ≈ 3.0% (2024) raise OPEX. BoC policy 5.00% and USD/CAD ≈ 1.34 (mid‑2025) increase capex/financing costs.
| Metric | Value |
|---|---|
| WTI (2024) | $80/bbl |
| Diesel (2024) | $85/bbl |
| Canada CPI (2024) | 3.0% |
| BoC rate | 5.00% |
| USD/CAD | 1.34 (mid‑2025) |
| M&A note | Secure Energy acquired Tervita 2021 |
Preview Before You Purchase
Tervita PESTLE Analysis
This Tervita PESTLE Analysis provides concise, actionable insights into political, economic, social, technological, legal and environmental factors affecting the company. The preview shown here is the exact document you’ll receive after purchase—fully formatted and ready to use. It’s structured for immediate download and practical application.

Make Smarter Strategic Decisions with a Complete PESTEL View
Discover how political shifts, economic cycles, regulatory pressure, technological change, social trends, and environmental risks converge to shape Tervita’s strategy and value—our PESTLE distills these forces into clear implications. Ideal for investors and planners, the full, ready-to-use analysis gives actionable insights and forecasts. Purchase now to download the complete report instantly.
Political factors
Energy policy direction
Shifts in federal and provincial energy strategies directly alter drilling intensity and waste volumes; Canada's carbon price rose to CAD 65/t in 2023 and is scheduled to reach CAD 170/t by 2030, influencing capital allocation. Supportive incentives and royalty credits can spur upstream activity and lift demand for disposal and remediation services. Conversely, decarbonization mandates and methane rules can curtail fossil investment and shift Tervita's service mix, so Tervita must hedge exposure across policy cycles.
Carbon pricing signals
Federal carbon pricing was CAD 65/tonne in 2023 and is legislated to rise to CAD 170/tonne by 2030, altering Tervita’s cost base as taxes and cap-and-trade affect hauling fuel, facility energy and landfill operations. Higher prices favor recycling and waste-to-value projects and lower-emission logistics, while predictable pricing supports long-term tech CAPEX decisions.
Provincial regulatory variance
Provincial regulatory variance across four jurisdictions—Alberta, British Columbia, Saskatchewan and others—creates material differences in facility siting, permitting timelines and waste classifications that affect Tervitas throughput and margins.
Permit timelines and classification rules vary by province, complicating cross-border logistics and capacity utilization while making harmonization a clear efficiency lever.
Tervitas regulatory fluency and local stakeholder engagement position it to capture network benefits as provinces move toward greater alignment.
Indigenous relations and approvals
Projects often intersect with Indigenous lands and rights; Indigenous peoples comprised 5.0% of Canada’s population in the 2021 Census, increasing community impacts and consultation needs. Early consultation and impact-benefit agreements under the federal Impact Assessment Act (2019) reduce approval risk and delays and strengthen social licence. Non-compliance has led to court injunctions halting projects and causing material reputational and financial harm.
- Consultation requirement: Impact Assessment Act (2019)
- Indigenous population (2021): 5.0% of Canada
- Benefit agreements: lower approval delays, improved workforce access
- Non-compliance: risk of injunctions, operational halts
Trade and cross-border flows
US-Canada relations and USMCA-era protocols govern transboundary waste and equipment movement, with two-way goods trade exceeding roughly US$1 trillion in 2024, keeping cross-border logistics critical for Tervita. Tariffs are low under USMCA but customs rules and transport policies drive cost and turnaround; harmonized standards improve asset utilization while disruptions force contingency routing and temporary storage capacity.
- Trade framework: USMCA continuity
- 2024 trade: ~US$1 trillion two-way goods
- Operational impact: tariffs low, customs/process delays raise costs
- Mitigation: harmonized standards, contingency routing, spare storage
Policy shifts raise drilling costs and approvals risk; CAD 65→170/t
Federal/provincial energy policy shifts change drilling intensity and waste volumes; federal carbon price was CAD 65/t in 2023 and is legislated to reach CAD 170/t by 2030, altering cost and CAPEX signals. Provincial regulatory variance (Alberta, BC, Saskatchewan, others) and permit timelines drive site economics and margins. Indigenous consultation (5.0% pop, 2021) and the Impact Assessment Act raise approval risk; US‑Canada two‑way trade ~US$1T (2024) keeps cross‑border logistics strategic.
| Factor | Key metric | Operational impact |
|---|---|---|
| Carbon price | CAD 65/t (2023) → CAD 170/t (2030) | Drives recycling, CAPEX timing |
| Provincial variance | AB, BC, SK, others | Permits, classifications, margins |
| Indigenous | 5.0% pop (2021) | Consultation, IBA, approval risk |
| Trade | ~US$1T two‑way (2024) | Cross‑border logistics, customs delays |
What is included in the product
Detailed Word Document
Explores how macro-environmental forces uniquely impact Tervita across Political, Economic, Social, Technological, Environmental and Legal dimensions, with data-backed trends and region-specific examples to identify risks and opportunities for executives, investors and strategists.
Customizable Excel Spreadsheet
A concise, visually segmented Tervita PESTLE summary that’s easy to drop into presentations, editable for local context, and shareable across teams to quickly align on external risks and strategic positioning during planning sessions.
Economic factors
Oil and gas cycle exposure
Waste volumes at Tervita closely follow drilling, completions and production activity; with WTI averaging about $80/bbl in 2024, price downturns compressed volumes and pricing across service lines. Upcycles strain disposal and treatment capacity and lifted margins during 2023–24 recovery periods. Counter-cyclical remediation work provided partial revenue cushioning, and a balanced basin portfolio reduced regional volatility.
Inflation and input costs
Diesel, chemicals, steel and labour remain primary OPEX drivers for Tervita; diesel averaged about $85/barrel in 2024 and fuel/consumables can represent roughly 8–12% of site operating costs. Persistent inflation (Canada CPI ~3.0% in 2024) pressures unindexed contracts. Operational efficiency and route optimization protect margins, while supplier hedging reduces consumables volatility.
Interest rates and capex
Higher interest rates raise financing costs for new facilities and remediation equipment, with Bank of Canada policy at 5.00% and the US Fed funds target around 5.25–5.50% in 2024–25, increasing borrowing spreads for service providers. Producers commonly defer projects under tighter credit, reducing demand for environmental and remediation services. Flexible capex and modular builds improve ROI when credit tightens, while strong cash generation funds maintenance and compliance spend.
FX and USD exposure
CAD/USD shifts (USD ~1.34 per CAD mid‑2025) push imported equipment and cross‑border service costs higher; a weaker CAD raises Tervita capex in CAD terms but can boost USD‑priced export margins. Active hedging reduces procurement budgeting volatility, while contractual pricing clauses enable pass‑through of currency impacts to customers.
- FX exposure: USD/CAD ~1.34 (mid‑2025)
- Capex risk: imported equipment cost up when CAD weakens
- Mitigation: hedging smooths budgets
- Contract tool: pricing pass‑through clauses
Industry consolidation
M&A among producers and service firms shifts bargaining power and network requirements; Secure Energy completed the acquisition of Tervita in 2021, illustrating sector consolidation and client demand for scale. Larger clients increasingly require integrated, standardized solutions and volume discounts, while consolidation can unlock routing and facility-utilization synergies. Antitrust review continues to influence deal timing and structure.
- Bargaining power: increased
- Client demand: integrated solutions, discounts
- Synergies: routing & facility utilization
- Regulatory: antitrust shapes pace
Policy shifts raise drilling costs and approvals risk; CAD 65→170/t
Waste volumes follow drilling with WTI ≈ $80/bbl (2024); upcycles tightened disposal capacity and lifted margins, while remediation softened downturns. Diesel ≈ $85/bbl (2024) and Canada CPI ≈ 3.0% (2024) raise OPEX. BoC policy 5.00% and USD/CAD ≈ 1.34 (mid‑2025) increase capex/financing costs.
| Metric | Value |
|---|---|
| WTI (2024) | $80/bbl |
| Diesel (2024) | $85/bbl |
| Canada CPI (2024) | 3.0% |
| BoC rate | 5.00% |
| USD/CAD | 1.34 (mid‑2025) |
| M&A note | Secure Energy acquired Tervita 2021 |
Preview Before You Purchase
Tervita PESTLE Analysis
This Tervita PESTLE Analysis provides concise, actionable insights into political, economic, social, technological, legal and environmental factors affecting the company. The preview shown here is the exact document you’ll receive after purchase—fully formatted and ready to use. It’s structured for immediate download and practical application.
Description
Make Smarter Strategic Decisions with a Complete PESTEL View
Discover how political shifts, economic cycles, regulatory pressure, technological change, social trends, and environmental risks converge to shape Tervita’s strategy and value—our PESTLE distills these forces into clear implications. Ideal for investors and planners, the full, ready-to-use analysis gives actionable insights and forecasts. Purchase now to download the complete report instantly.
Political factors
Energy policy direction
Shifts in federal and provincial energy strategies directly alter drilling intensity and waste volumes; Canada's carbon price rose to CAD 65/t in 2023 and is scheduled to reach CAD 170/t by 2030, influencing capital allocation. Supportive incentives and royalty credits can spur upstream activity and lift demand for disposal and remediation services. Conversely, decarbonization mandates and methane rules can curtail fossil investment and shift Tervita's service mix, so Tervita must hedge exposure across policy cycles.
Carbon pricing signals
Federal carbon pricing was CAD 65/tonne in 2023 and is legislated to rise to CAD 170/tonne by 2030, altering Tervita’s cost base as taxes and cap-and-trade affect hauling fuel, facility energy and landfill operations. Higher prices favor recycling and waste-to-value projects and lower-emission logistics, while predictable pricing supports long-term tech CAPEX decisions.
Provincial regulatory variance
Provincial regulatory variance across four jurisdictions—Alberta, British Columbia, Saskatchewan and others—creates material differences in facility siting, permitting timelines and waste classifications that affect Tervitas throughput and margins.
Permit timelines and classification rules vary by province, complicating cross-border logistics and capacity utilization while making harmonization a clear efficiency lever.
Tervitas regulatory fluency and local stakeholder engagement position it to capture network benefits as provinces move toward greater alignment.
Indigenous relations and approvals
Projects often intersect with Indigenous lands and rights; Indigenous peoples comprised 5.0% of Canada’s population in the 2021 Census, increasing community impacts and consultation needs. Early consultation and impact-benefit agreements under the federal Impact Assessment Act (2019) reduce approval risk and delays and strengthen social licence. Non-compliance has led to court injunctions halting projects and causing material reputational and financial harm.
- Consultation requirement: Impact Assessment Act (2019)
- Indigenous population (2021): 5.0% of Canada
- Benefit agreements: lower approval delays, improved workforce access
- Non-compliance: risk of injunctions, operational halts
Trade and cross-border flows
US-Canada relations and USMCA-era protocols govern transboundary waste and equipment movement, with two-way goods trade exceeding roughly US$1 trillion in 2024, keeping cross-border logistics critical for Tervita. Tariffs are low under USMCA but customs rules and transport policies drive cost and turnaround; harmonized standards improve asset utilization while disruptions force contingency routing and temporary storage capacity.
- Trade framework: USMCA continuity
- 2024 trade: ~US$1 trillion two-way goods
- Operational impact: tariffs low, customs/process delays raise costs
- Mitigation: harmonized standards, contingency routing, spare storage
Policy shifts raise drilling costs and approvals risk; CAD 65→170/t
Federal/provincial energy policy shifts change drilling intensity and waste volumes; federal carbon price was CAD 65/t in 2023 and is legislated to reach CAD 170/t by 2030, altering cost and CAPEX signals. Provincial regulatory variance (Alberta, BC, Saskatchewan, others) and permit timelines drive site economics and margins. Indigenous consultation (5.0% pop, 2021) and the Impact Assessment Act raise approval risk; US‑Canada two‑way trade ~US$1T (2024) keeps cross‑border logistics strategic.
| Factor | Key metric | Operational impact |
|---|---|---|
| Carbon price | CAD 65/t (2023) → CAD 170/t (2030) | Drives recycling, CAPEX timing |
| Provincial variance | AB, BC, SK, others | Permits, classifications, margins |
| Indigenous | 5.0% pop (2021) | Consultation, IBA, approval risk |
| Trade | ~US$1T two‑way (2024) | Cross‑border logistics, customs delays |
What is included in the product
Detailed Word Document
Explores how macro-environmental forces uniquely impact Tervita across Political, Economic, Social, Technological, Environmental and Legal dimensions, with data-backed trends and region-specific examples to identify risks and opportunities for executives, investors and strategists.
Customizable Excel Spreadsheet
A concise, visually segmented Tervita PESTLE summary that’s easy to drop into presentations, editable for local context, and shareable across teams to quickly align on external risks and strategic positioning during planning sessions.
Economic factors
Oil and gas cycle exposure
Waste volumes at Tervita closely follow drilling, completions and production activity; with WTI averaging about $80/bbl in 2024, price downturns compressed volumes and pricing across service lines. Upcycles strain disposal and treatment capacity and lifted margins during 2023–24 recovery periods. Counter-cyclical remediation work provided partial revenue cushioning, and a balanced basin portfolio reduced regional volatility.
Inflation and input costs
Diesel, chemicals, steel and labour remain primary OPEX drivers for Tervita; diesel averaged about $85/barrel in 2024 and fuel/consumables can represent roughly 8–12% of site operating costs. Persistent inflation (Canada CPI ~3.0% in 2024) pressures unindexed contracts. Operational efficiency and route optimization protect margins, while supplier hedging reduces consumables volatility.
Interest rates and capex
Higher interest rates raise financing costs for new facilities and remediation equipment, with Bank of Canada policy at 5.00% and the US Fed funds target around 5.25–5.50% in 2024–25, increasing borrowing spreads for service providers. Producers commonly defer projects under tighter credit, reducing demand for environmental and remediation services. Flexible capex and modular builds improve ROI when credit tightens, while strong cash generation funds maintenance and compliance spend.
FX and USD exposure
CAD/USD shifts (USD ~1.34 per CAD mid‑2025) push imported equipment and cross‑border service costs higher; a weaker CAD raises Tervita capex in CAD terms but can boost USD‑priced export margins. Active hedging reduces procurement budgeting volatility, while contractual pricing clauses enable pass‑through of currency impacts to customers.
- FX exposure: USD/CAD ~1.34 (mid‑2025)
- Capex risk: imported equipment cost up when CAD weakens
- Mitigation: hedging smooths budgets
- Contract tool: pricing pass‑through clauses
Industry consolidation
M&A among producers and service firms shifts bargaining power and network requirements; Secure Energy completed the acquisition of Tervita in 2021, illustrating sector consolidation and client demand for scale. Larger clients increasingly require integrated, standardized solutions and volume discounts, while consolidation can unlock routing and facility-utilization synergies. Antitrust review continues to influence deal timing and structure.
- Bargaining power: increased
- Client demand: integrated solutions, discounts
- Synergies: routing & facility utilization
- Regulatory: antitrust shapes pace
Policy shifts raise drilling costs and approvals risk; CAD 65→170/t
Waste volumes follow drilling with WTI ≈ $80/bbl (2024); upcycles tightened disposal capacity and lifted margins, while remediation softened downturns. Diesel ≈ $85/bbl (2024) and Canada CPI ≈ 3.0% (2024) raise OPEX. BoC policy 5.00% and USD/CAD ≈ 1.34 (mid‑2025) increase capex/financing costs.
| Metric | Value |
|---|---|
| WTI (2024) | $80/bbl |
| Diesel (2024) | $85/bbl |
| Canada CPI (2024) | 3.0% |
| BoC rate | 5.00% |
| USD/CAD | 1.34 (mid‑2025) |
| M&A note | Secure Energy acquired Tervita 2021 |
Preview Before You Purchase
Tervita PESTLE Analysis
This Tervita PESTLE Analysis provides concise, actionable insights into political, economic, social, technological, legal and environmental factors affecting the company. The preview shown here is the exact document you’ll receive after purchase—fully formatted and ready to use. It’s structured for immediate download and practical application.











