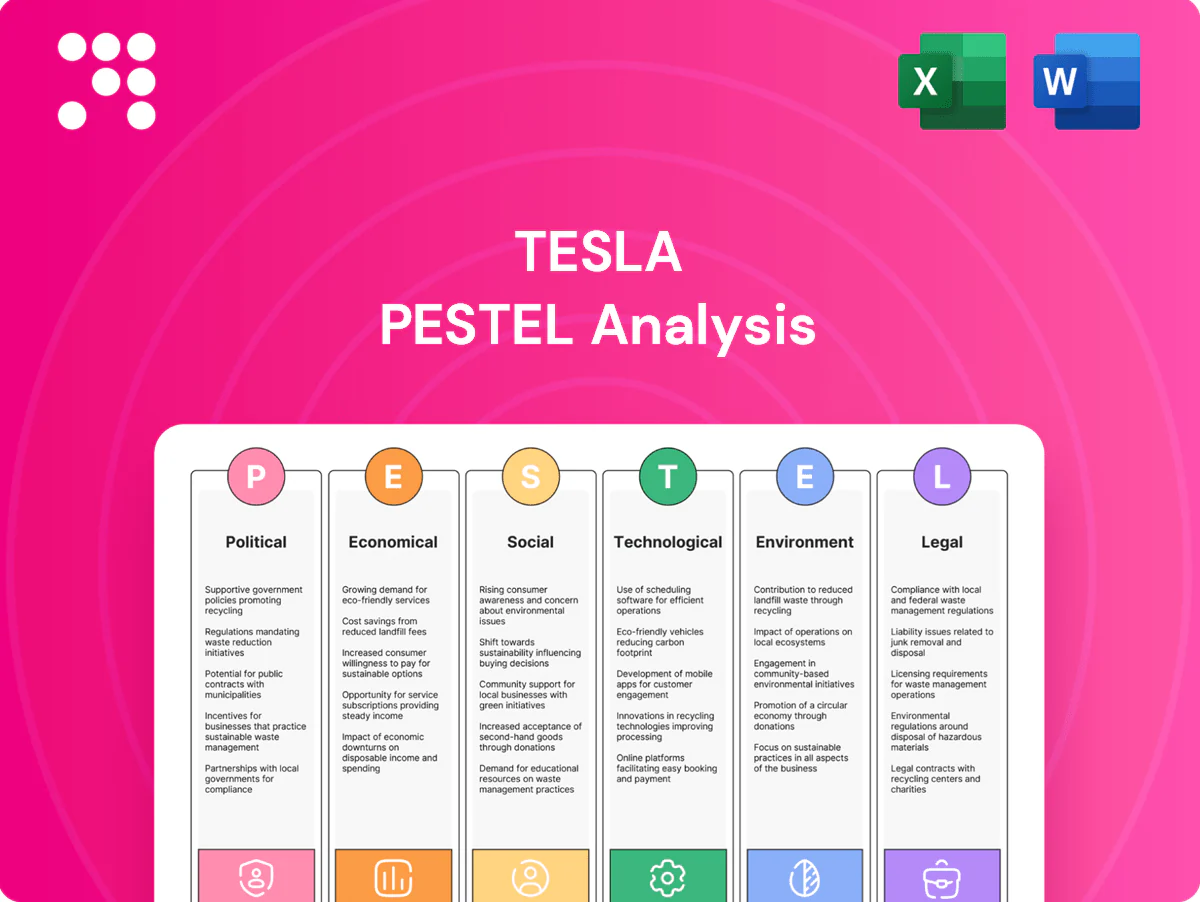
Tesla PESTLE Analysis

Plan Smarter. Present Sharper. Compete Stronger.
Quick PESTLE snapshot: Tesla faces regulatory pressure, shifting economic conditions, rapid tech innovation, social adoption trends, and rising environmental scrutiny—each shaping strategic choices. Our full PESTLE drills into risks, opportunities, and scenario impacts to guide investors and planners. Download the complete, editable analysis now for actionable intelligence.
Political factors

EV incentives and subsidies
Government purchase incentives, tax credits (US IRA up to $7,500) and grants directly shape Tesla pricing power and demand; the IRA’s $369 billion clean-energy package and changing eligibility rules have already shifted buying patterns. Shifts in income caps, domestic-content and battery rules can accelerate or slow deliveries. Monitoring US, EU state-aid frameworks and Asian subsidy cycles—China still ~50% of global EV sales—is critical for demand stability and planning.
Trade policy and tariffs
Tariffs on vehicles (US MFN 2.5% and EU external tariff ~10%) and on battery components, plus IRA battery sourcing rules for EV tax credits, materially affect Tesla’s cost structure and pricing across markets. Geopolitical tensions (US-China, EU-Russia) can disrupt cross-border supply chains and market access. Localizing production in Shanghai, Berlin and Texas reduces tariff exposure and logistics costs. Export strategies must align with blocs like USMCA and EU trade rules.

Charging standards and infrastructure
Government-backed programs and standard-setting materially shape charging network economics; the US Bipartisan Infrastructure Law allocated 7.5 billion USD for public EV charging deployment, lowering public subsidy needs for operators. Adoption of Tesla NACS by over 10 automakers representing >70% of the US new-EV market improves interoperability and can raise utilization. Policy support can cut average capex per DC fast site (roughly 250–350k USD) and speed coverage. Regulators increasingly push open-access terms and pricing transparency.

Industrial policy and onshoring
Industrial policy and onshoring — including the US Inflation Reduction Act EV tax credit of up to 7,500 USD — steers Tesla toward greater vertical integration in battery and materials production, while local content rules for credits and tariffs shape gigafactory siting. Competition among regions offering billions in incentives reallocates capital toward jurisdictions promising faster approvals and supply-chain clustering, which cuts logistics risk and lead times.
Geopolitical and sanctions risk
Geopolitical shocks, export controls and sanctions can curb Tesla’s tech transfer and supply lines; Tesla reported $81.46B revenue in 2023 and faced near‑half concentration of vehicle deliveries in China in 2023, highlighting exposure. Competition for politicized critical minerals (lithium, nickel) raises contract risk and could force market exits or heavier compliance costs in high‑risk jurisdictions. Diversifying suppliers and markets preserves operational continuity and mitigates single‑country disruptions.
- Sanctions/export controls: restrict tech transfer and sourcing
- Critical minerals: politicized access raises contract risk
- Market exits/compliance: possible in high‑risk regions
- Diversification: maintains continuity, lowers concentration risk
Incentives, China's EV dominance and tariffs reshape EV demand, supply chains and gigafactories
Government incentives (US IRA up to 7,500 USD, 369B USD clean-energy package) and China’s ~50% share of global EV sales materially drive Tesla demand and siting. Tariffs (US 2.5%, EU ~10%), export controls and competition for critical minerals raise cost and sourcing risk. US Bipartisan Infrastructure Law 7.5B USD accelerates charging rollout; onshoring and local-content rules reshape gigafactory strategy.
| Metric | Value |
|---|---|
| IRA EV tax credit | up to 7,500 USD |
| US charging funds | 7.5B USD |
| Tariffs | US 2.5% / EU ~10% |
| China EV share | ~50% |
What is included in the product
 Detailed Word Document
Explores how external macro-environmental factors uniquely affect Tesla across Political, Economic, Social, Technological, Environmental and Legal dimensions, with sections backed by current data and trends. Designed to support executives, consultants and entrepreneurs by identifying threats, opportunities and forward-looking insights ready for business plans, pitch decks or scenario planning.

 Customizable Excel Spreadsheet
A clean, summarized Tesla PESTLE that’s visually segmented by category for quick interpretation, easily dropped into presentations or shared across teams to support risk discussions, regional notes, and decision-making during planning sessions.
Economic factors

Interest rates and financing
Higher policy rates (US fed funds ~5.25% in 2024–25) pushed 60‑month new‑car loan averages toward 7–8% in 2024, raising monthly payments and pressuring Tesla EV affordability and order intake. Leasing residuals and Tesla’s captive financing terms act as key demand levers. Rate cycles shape timing of factory and Supercharger capex; lower rates can quickly unlock deferred demand.
Battery materials costs
Prices for lithium, nickel, graphite and cobalt — which drove EV pack costs and margins when lithium carbonate peaked above $70,000/ton in 2022 — have settled (roughly $20k–30k/ton by 2024–25), helping pack-cost decline (battery pack costs fell toward ~$120–140/kWh in 2023); long-term offtakes, shifts to LFP and high-manganese chemistries and scaling recycling (e.g., Redwood/partner programs) damp volatility; regional refining capacity shapes landed costs and lead times; Tesla’s hedging and vertical integration raise cost predictability.

Consumer demand and elasticity
Macro slowdowns raise price sensitivity and stretch replacement cycles, with global EV share still only 14% of new-car sales in 2023 (IEA), slowing purchase urgency. Tesla's targeted price cuts—up to about 20% on some models in 2023–24—have captured share but compressed profitability. Brand equity and superior total cost of ownership versus ICE remain key conversion drivers. Better inventory management and mix shifts across models and trims help stabilize plant utilization.

FX and global footprint
Multi-currency revenues and costs expose Tesla to translation and transaction risk; in 2023 Tesla reported $81.46B revenue and relies on major markets in North America, Europe and China. Local production at Fremont, Giga Texas, Giga Berlin and Giga Shanghai provides natural hedges, while FX swings affect export competitiveness and component sourcing. Treasury hedging and periodic pricing adjustments are used to mitigate impact.
- Multi-currency risk: translation & transaction exposure
- Natural hedge: local production in US, EU, CN (Fremont, Texas, Berlin, Shanghai)
- Mitigants: treasury hedging, dynamic pricing, sourcing adjustments
Energy markets and grid economics
Volatile electricity prices (US average retail ~16¢/kWh in 2023) and commercial demand charges (commonly $10–50/kW-month) erode charging and energy-storage ROI, making hourly arbitrage and demand-charge avoidance central to Tesla value propositions. Utility incentives and capacity markets (capacity clearing prices and capacity payments) materially improve Megapack economics in markets like CAISO and PJM. Rising grid costs and reliability concerns are accelerating solar+storage adoption after global battery additions (~27 GW in 2023). Aggregation and VPPs unlock recurring revenue streams by monetizing capacity, frequency response and peak shaving.
- Price pressure: US avg retail ~16¢/kWh (EIA 2023)
- Demand charges: $10–50/kW-month impact ROI
- Storage growth: ~27 GW added globally in 2023 (IEA)
- VPPs/aggregation: create recurring revenue via capacity and ancillary markets
Incentives, China's EV dominance and tariffs reshape EV demand, supply chains and gigafactories
Higher policy rates (US fed funds ~5.25% in 2024–25) pushed 60‑month loan rates toward 7–8%, pressuring EV affordability and order intake. Battery-pack costs fell toward ~$120–140/kWh (2023) as lithium eased to ~$20k–30k/ton (2024–25), improving margins. Global EV share was ~14% of new sales (2023); Tesla 2023 revenue $81.46B. Electricity ~16¢/kWh (US avg 2023) raises charging/storage ROI sensitivity.
| Metric | Value |
|---|---|
| Fed funds | ~5.25% (2024–25) |
| Loan rates | ~7–8% (60m, 2024) |
| Battery cost | $120–140/kWh (2023) |
| Lithium | $20k–30k/ton (2024–25) |
| EV share | ~14% (2023) |
| Tesla rev | $81.46B (2023) |
| US electricity | ~16¢/kWh (2023) |
| Storage addn | ~27 GW (2023) |
Preview Before You Purchase
Tesla PESTLE Analysis
The preview shown here is the exact document you’ll receive after purchase—fully formatted and ready to use. This Tesla PESTLE Analysis contains the same content, layout, and professional structure as the downloadable file. No placeholders or edits are needed; after checkout you’ll instantly get this finished report. What you see is what you’ll own.

Plan Smarter. Present Sharper. Compete Stronger.
Quick PESTLE snapshot: Tesla faces regulatory pressure, shifting economic conditions, rapid tech innovation, social adoption trends, and rising environmental scrutiny—each shaping strategic choices. Our full PESTLE drills into risks, opportunities, and scenario impacts to guide investors and planners. Download the complete, editable analysis now for actionable intelligence.
Political factors
EV incentives and subsidies
Government purchase incentives, tax credits (US IRA up to $7,500) and grants directly shape Tesla pricing power and demand; the IRA’s $369 billion clean-energy package and changing eligibility rules have already shifted buying patterns. Shifts in income caps, domestic-content and battery rules can accelerate or slow deliveries. Monitoring US, EU state-aid frameworks and Asian subsidy cycles—China still ~50% of global EV sales—is critical for demand stability and planning.
Trade policy and tariffs
Tariffs on vehicles (US MFN 2.5% and EU external tariff ~10%) and on battery components, plus IRA battery sourcing rules for EV tax credits, materially affect Tesla’s cost structure and pricing across markets. Geopolitical tensions (US-China, EU-Russia) can disrupt cross-border supply chains and market access. Localizing production in Shanghai, Berlin and Texas reduces tariff exposure and logistics costs. Export strategies must align with blocs like USMCA and EU trade rules.
Charging standards and infrastructure
Government-backed programs and standard-setting materially shape charging network economics; the US Bipartisan Infrastructure Law allocated 7.5 billion USD for public EV charging deployment, lowering public subsidy needs for operators. Adoption of Tesla NACS by over 10 automakers representing >70% of the US new-EV market improves interoperability and can raise utilization. Policy support can cut average capex per DC fast site (roughly 250–350k USD) and speed coverage. Regulators increasingly push open-access terms and pricing transparency.
Industrial policy and onshoring
Industrial policy and onshoring — including the US Inflation Reduction Act EV tax credit of up to 7,500 USD — steers Tesla toward greater vertical integration in battery and materials production, while local content rules for credits and tariffs shape gigafactory siting. Competition among regions offering billions in incentives reallocates capital toward jurisdictions promising faster approvals and supply-chain clustering, which cuts logistics risk and lead times.
Geopolitical and sanctions risk
Geopolitical shocks, export controls and sanctions can curb Tesla’s tech transfer and supply lines; Tesla reported $81.46B revenue in 2023 and faced near‑half concentration of vehicle deliveries in China in 2023, highlighting exposure. Competition for politicized critical minerals (lithium, nickel) raises contract risk and could force market exits or heavier compliance costs in high‑risk jurisdictions. Diversifying suppliers and markets preserves operational continuity and mitigates single‑country disruptions.
- Sanctions/export controls: restrict tech transfer and sourcing
- Critical minerals: politicized access raises contract risk
- Market exits/compliance: possible in high‑risk regions
- Diversification: maintains continuity, lowers concentration risk
Incentives, China's EV dominance and tariffs reshape EV demand, supply chains and gigafactories
Government incentives (US IRA up to 7,500 USD, 369B USD clean-energy package) and China’s ~50% share of global EV sales materially drive Tesla demand and siting. Tariffs (US 2.5%, EU ~10%), export controls and competition for critical minerals raise cost and sourcing risk. US Bipartisan Infrastructure Law 7.5B USD accelerates charging rollout; onshoring and local-content rules reshape gigafactory strategy.
| Metric | Value |
|---|---|
| IRA EV tax credit | up to 7,500 USD |
| US charging funds | 7.5B USD |
| Tariffs | US 2.5% / EU ~10% |
| China EV share | ~50% |
What is included in the product
Detailed Word Document
Explores how external macro-environmental factors uniquely affect Tesla across Political, Economic, Social, Technological, Environmental and Legal dimensions, with sections backed by current data and trends. Designed to support executives, consultants and entrepreneurs by identifying threats, opportunities and forward-looking insights ready for business plans, pitch decks or scenario planning.
Customizable Excel Spreadsheet
A clean, summarized Tesla PESTLE that’s visually segmented by category for quick interpretation, easily dropped into presentations or shared across teams to support risk discussions, regional notes, and decision-making during planning sessions.
Economic factors
Interest rates and financing
Higher policy rates (US fed funds ~5.25% in 2024–25) pushed 60‑month new‑car loan averages toward 7–8% in 2024, raising monthly payments and pressuring Tesla EV affordability and order intake. Leasing residuals and Tesla’s captive financing terms act as key demand levers. Rate cycles shape timing of factory and Supercharger capex; lower rates can quickly unlock deferred demand.
Battery materials costs
Prices for lithium, nickel, graphite and cobalt — which drove EV pack costs and margins when lithium carbonate peaked above $70,000/ton in 2022 — have settled (roughly $20k–30k/ton by 2024–25), helping pack-cost decline (battery pack costs fell toward ~$120–140/kWh in 2023); long-term offtakes, shifts to LFP and high-manganese chemistries and scaling recycling (e.g., Redwood/partner programs) damp volatility; regional refining capacity shapes landed costs and lead times; Tesla’s hedging and vertical integration raise cost predictability.
Consumer demand and elasticity
Macro slowdowns raise price sensitivity and stretch replacement cycles, with global EV share still only 14% of new-car sales in 2023 (IEA), slowing purchase urgency. Tesla's targeted price cuts—up to about 20% on some models in 2023–24—have captured share but compressed profitability. Brand equity and superior total cost of ownership versus ICE remain key conversion drivers. Better inventory management and mix shifts across models and trims help stabilize plant utilization.
FX and global footprint
Multi-currency revenues and costs expose Tesla to translation and transaction risk; in 2023 Tesla reported $81.46B revenue and relies on major markets in North America, Europe and China. Local production at Fremont, Giga Texas, Giga Berlin and Giga Shanghai provides natural hedges, while FX swings affect export competitiveness and component sourcing. Treasury hedging and periodic pricing adjustments are used to mitigate impact.
- Multi-currency risk: translation & transaction exposure
- Natural hedge: local production in US, EU, CN (Fremont, Texas, Berlin, Shanghai)
- Mitigants: treasury hedging, dynamic pricing, sourcing adjustments
Energy markets and grid economics
Volatile electricity prices (US average retail ~16¢/kWh in 2023) and commercial demand charges (commonly $10–50/kW-month) erode charging and energy-storage ROI, making hourly arbitrage and demand-charge avoidance central to Tesla value propositions. Utility incentives and capacity markets (capacity clearing prices and capacity payments) materially improve Megapack economics in markets like CAISO and PJM. Rising grid costs and reliability concerns are accelerating solar+storage adoption after global battery additions (~27 GW in 2023). Aggregation and VPPs unlock recurring revenue streams by monetizing capacity, frequency response and peak shaving.
- Price pressure: US avg retail ~16¢/kWh (EIA 2023)
- Demand charges: $10–50/kW-month impact ROI
- Storage growth: ~27 GW added globally in 2023 (IEA)
- VPPs/aggregation: create recurring revenue via capacity and ancillary markets
Incentives, China's EV dominance and tariffs reshape EV demand, supply chains and gigafactories
Higher policy rates (US fed funds ~5.25% in 2024–25) pushed 60‑month loan rates toward 7–8%, pressuring EV affordability and order intake. Battery-pack costs fell toward ~$120–140/kWh (2023) as lithium eased to ~$20k–30k/ton (2024–25), improving margins. Global EV share was ~14% of new sales (2023); Tesla 2023 revenue $81.46B. Electricity ~16¢/kWh (US avg 2023) raises charging/storage ROI sensitivity.
| Metric | Value |
|---|---|
| Fed funds | ~5.25% (2024–25) |
| Loan rates | ~7–8% (60m, 2024) |
| Battery cost | $120–140/kWh (2023) |
| Lithium | $20k–30k/ton (2024–25) |
| EV share | ~14% (2023) |
| Tesla rev | $81.46B (2023) |
| US electricity | ~16¢/kWh (2023) |
| Storage addn | ~27 GW (2023) |
Preview Before You Purchase
Tesla PESTLE Analysis
The preview shown here is the exact document you’ll receive after purchase—fully formatted and ready to use. This Tesla PESTLE Analysis contains the same content, layout, and professional structure as the downloadable file. No placeholders or edits are needed; after checkout you’ll instantly get this finished report. What you see is what you’ll own.
Description
Plan Smarter. Present Sharper. Compete Stronger.
Quick PESTLE snapshot: Tesla faces regulatory pressure, shifting economic conditions, rapid tech innovation, social adoption trends, and rising environmental scrutiny—each shaping strategic choices. Our full PESTLE drills into risks, opportunities, and scenario impacts to guide investors and planners. Download the complete, editable analysis now for actionable intelligence.
Political factors
EV incentives and subsidies
Government purchase incentives, tax credits (US IRA up to $7,500) and grants directly shape Tesla pricing power and demand; the IRA’s $369 billion clean-energy package and changing eligibility rules have already shifted buying patterns. Shifts in income caps, domestic-content and battery rules can accelerate or slow deliveries. Monitoring US, EU state-aid frameworks and Asian subsidy cycles—China still ~50% of global EV sales—is critical for demand stability and planning.
Trade policy and tariffs
Tariffs on vehicles (US MFN 2.5% and EU external tariff ~10%) and on battery components, plus IRA battery sourcing rules for EV tax credits, materially affect Tesla’s cost structure and pricing across markets. Geopolitical tensions (US-China, EU-Russia) can disrupt cross-border supply chains and market access. Localizing production in Shanghai, Berlin and Texas reduces tariff exposure and logistics costs. Export strategies must align with blocs like USMCA and EU trade rules.
Charging standards and infrastructure
Government-backed programs and standard-setting materially shape charging network economics; the US Bipartisan Infrastructure Law allocated 7.5 billion USD for public EV charging deployment, lowering public subsidy needs for operators. Adoption of Tesla NACS by over 10 automakers representing >70% of the US new-EV market improves interoperability and can raise utilization. Policy support can cut average capex per DC fast site (roughly 250–350k USD) and speed coverage. Regulators increasingly push open-access terms and pricing transparency.
Industrial policy and onshoring
Industrial policy and onshoring — including the US Inflation Reduction Act EV tax credit of up to 7,500 USD — steers Tesla toward greater vertical integration in battery and materials production, while local content rules for credits and tariffs shape gigafactory siting. Competition among regions offering billions in incentives reallocates capital toward jurisdictions promising faster approvals and supply-chain clustering, which cuts logistics risk and lead times.
Geopolitical and sanctions risk
Geopolitical shocks, export controls and sanctions can curb Tesla’s tech transfer and supply lines; Tesla reported $81.46B revenue in 2023 and faced near‑half concentration of vehicle deliveries in China in 2023, highlighting exposure. Competition for politicized critical minerals (lithium, nickel) raises contract risk and could force market exits or heavier compliance costs in high‑risk jurisdictions. Diversifying suppliers and markets preserves operational continuity and mitigates single‑country disruptions.
- Sanctions/export controls: restrict tech transfer and sourcing
- Critical minerals: politicized access raises contract risk
- Market exits/compliance: possible in high‑risk regions
- Diversification: maintains continuity, lowers concentration risk
Incentives, China's EV dominance and tariffs reshape EV demand, supply chains and gigafactories
Government incentives (US IRA up to 7,500 USD, 369B USD clean-energy package) and China’s ~50% share of global EV sales materially drive Tesla demand and siting. Tariffs (US 2.5%, EU ~10%), export controls and competition for critical minerals raise cost and sourcing risk. US Bipartisan Infrastructure Law 7.5B USD accelerates charging rollout; onshoring and local-content rules reshape gigafactory strategy.
| Metric | Value |
|---|---|
| IRA EV tax credit | up to 7,500 USD |
| US charging funds | 7.5B USD |
| Tariffs | US 2.5% / EU ~10% |
| China EV share | ~50% |
What is included in the product
Detailed Word Document
Explores how external macro-environmental factors uniquely affect Tesla across Political, Economic, Social, Technological, Environmental and Legal dimensions, with sections backed by current data and trends. Designed to support executives, consultants and entrepreneurs by identifying threats, opportunities and forward-looking insights ready for business plans, pitch decks or scenario planning.
Customizable Excel Spreadsheet
A clean, summarized Tesla PESTLE that’s visually segmented by category for quick interpretation, easily dropped into presentations or shared across teams to support risk discussions, regional notes, and decision-making during planning sessions.
Economic factors
Interest rates and financing
Higher policy rates (US fed funds ~5.25% in 2024–25) pushed 60‑month new‑car loan averages toward 7–8% in 2024, raising monthly payments and pressuring Tesla EV affordability and order intake. Leasing residuals and Tesla’s captive financing terms act as key demand levers. Rate cycles shape timing of factory and Supercharger capex; lower rates can quickly unlock deferred demand.
Battery materials costs
Prices for lithium, nickel, graphite and cobalt — which drove EV pack costs and margins when lithium carbonate peaked above $70,000/ton in 2022 — have settled (roughly $20k–30k/ton by 2024–25), helping pack-cost decline (battery pack costs fell toward ~$120–140/kWh in 2023); long-term offtakes, shifts to LFP and high-manganese chemistries and scaling recycling (e.g., Redwood/partner programs) damp volatility; regional refining capacity shapes landed costs and lead times; Tesla’s hedging and vertical integration raise cost predictability.
Consumer demand and elasticity
Macro slowdowns raise price sensitivity and stretch replacement cycles, with global EV share still only 14% of new-car sales in 2023 (IEA), slowing purchase urgency. Tesla's targeted price cuts—up to about 20% on some models in 2023–24—have captured share but compressed profitability. Brand equity and superior total cost of ownership versus ICE remain key conversion drivers. Better inventory management and mix shifts across models and trims help stabilize plant utilization.
FX and global footprint
Multi-currency revenues and costs expose Tesla to translation and transaction risk; in 2023 Tesla reported $81.46B revenue and relies on major markets in North America, Europe and China. Local production at Fremont, Giga Texas, Giga Berlin and Giga Shanghai provides natural hedges, while FX swings affect export competitiveness and component sourcing. Treasury hedging and periodic pricing adjustments are used to mitigate impact.
- Multi-currency risk: translation & transaction exposure
- Natural hedge: local production in US, EU, CN (Fremont, Texas, Berlin, Shanghai)
- Mitigants: treasury hedging, dynamic pricing, sourcing adjustments
Energy markets and grid economics
Volatile electricity prices (US average retail ~16¢/kWh in 2023) and commercial demand charges (commonly $10–50/kW-month) erode charging and energy-storage ROI, making hourly arbitrage and demand-charge avoidance central to Tesla value propositions. Utility incentives and capacity markets (capacity clearing prices and capacity payments) materially improve Megapack economics in markets like CAISO and PJM. Rising grid costs and reliability concerns are accelerating solar+storage adoption after global battery additions (~27 GW in 2023). Aggregation and VPPs unlock recurring revenue streams by monetizing capacity, frequency response and peak shaving.
- Price pressure: US avg retail ~16¢/kWh (EIA 2023)
- Demand charges: $10–50/kW-month impact ROI
- Storage growth: ~27 GW added globally in 2023 (IEA)
- VPPs/aggregation: create recurring revenue via capacity and ancillary markets
Incentives, China's EV dominance and tariffs reshape EV demand, supply chains and gigafactories
Higher policy rates (US fed funds ~5.25% in 2024–25) pushed 60‑month loan rates toward 7–8%, pressuring EV affordability and order intake. Battery-pack costs fell toward ~$120–140/kWh (2023) as lithium eased to ~$20k–30k/ton (2024–25), improving margins. Global EV share was ~14% of new sales (2023); Tesla 2023 revenue $81.46B. Electricity ~16¢/kWh (US avg 2023) raises charging/storage ROI sensitivity.
| Metric | Value |
|---|---|
| Fed funds | ~5.25% (2024–25) |
| Loan rates | ~7–8% (60m, 2024) |
| Battery cost | $120–140/kWh (2023) |
| Lithium | $20k–30k/ton (2024–25) |
| EV share | ~14% (2023) |
| Tesla rev | $81.46B (2023) |
| US electricity | ~16¢/kWh (2023) |
| Storage addn | ~27 GW (2023) |
Preview Before You Purchase
Tesla PESTLE Analysis
The preview shown here is the exact document you’ll receive after purchase—fully formatted and ready to use. This Tesla PESTLE Analysis contains the same content, layout, and professional structure as the downloadable file. No placeholders or edits are needed; after checkout you’ll instantly get this finished report. What you see is what you’ll own.











