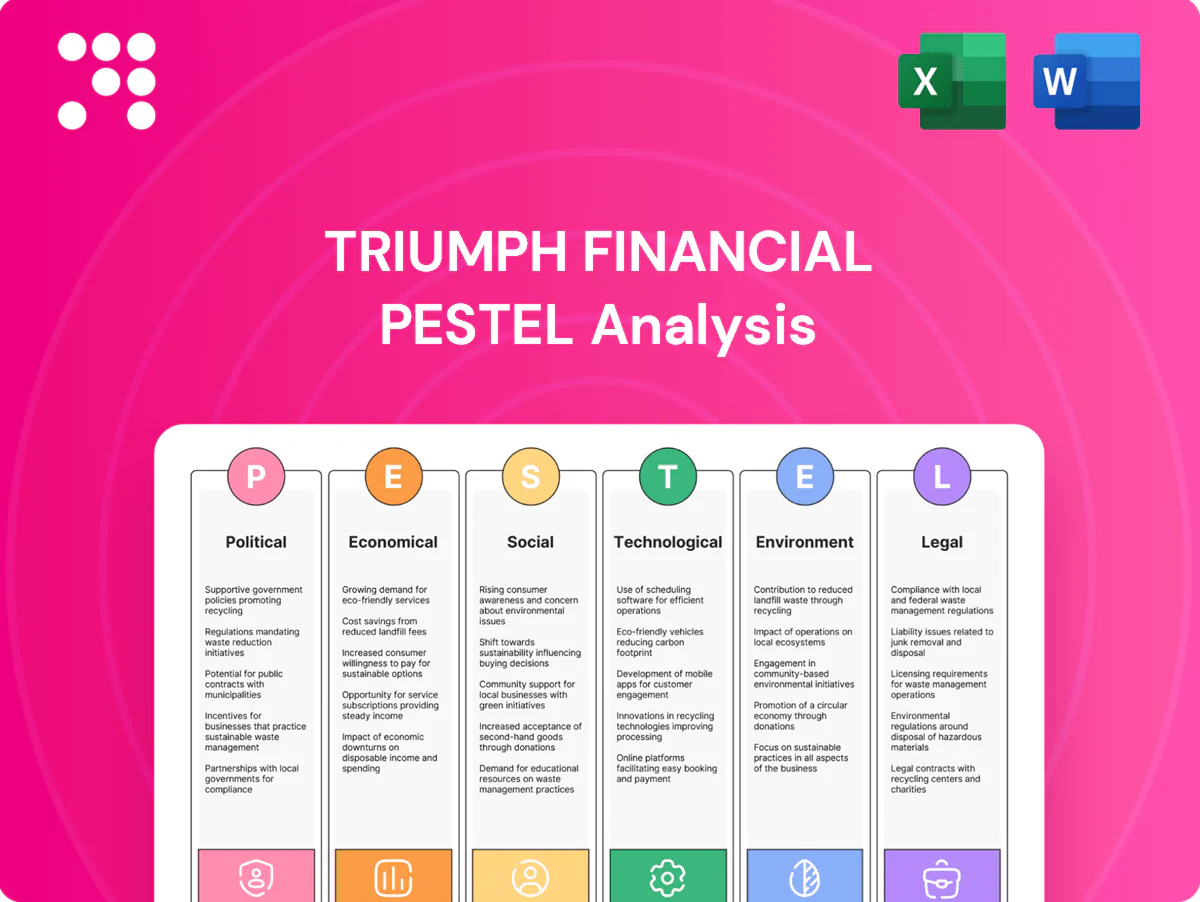
Triumph Financial PESTLE Analysis

Your Competitive Advantage Starts with This Report
Discover how political shifts, economic cycles, and technological disruption are reshaping Triumph Financial’s prospects in our concise PESTLE overview—perfect for investors and strategists. This snapshot highlights risks and opportunities; purchase the full PESTLE to access detailed, actionable intelligence and ready-to-use insights for immediate strategy or investment decisions.
Political factors

Infrastructure spending
Federal and state infrastructure investments, anchored by the 2021 Infrastructure Investment and Jobs Act which committed roughly 1.2 trillion dollars total and about 550 billion dollars in new spending (including ~110 billion for roads and bridges and ~17 billion for ports), shift freight flows and raise demand for factoring and equipment loans for carriers. Policy continuity versus gridlock drives capex cycles; Triumph should scenario-plan for accelerated, delayed, and phased funding timelines. Aligning product offerings and partnerships with announced port and road projects can capture incremental volume and financing opportunities.
Trade and tariffs
Shifts in tariffs and cross-border policy alter freight volumes and seasonality, with port operations historically spiking congestion (Los Angeles/Long Beach peaked ~109 ships waiting in 2021). USMCA, in force since 2020, and variable border wait-times compress carriers’ cash cycles Triumph finances. Mapping exposure to import-heavy lanes and hedging portfolio concentrations reduces risk from geopolitical shocks.

Energy policy stance
Triumph clients' operating costs shift with fuel policy—U.S. federal diesel tax is 24.4 cents/gal, while federal clean-vehicle incentives (up to 7,500 dollars consumer EV credit) and IRA/BIL funding boost demand for low-emission trucks. Policy pushes toward cleaner fleets can redirect lending to newer equipment; Triumph can tailor loan structures to capture fuel-transition incentives. Ongoing monitoring of DOE guidance helps price residual and regulatory risk accurately.

SMB support programs
Small-carrier grants, guarantees or tax credits shift credit demand and default risk, and political appetite for Main Street support directly alters factoring volumes; for example the federal Small Business Credit Initiative allocated 10 billion USD to expand lending capacity. Triumph can align with such government-backed programs to lower capital costs and use advocacy to shape eligibility rules that favor owner-operators.
- small-carrier grants
- 10 billion USD SBCI
- lower capital costs via guarantees
- advocacy for owner-operator eligibility
Public procurement and USPS
Government freight and mail contracts create steady lanes for carriers; USPS handled about 120 billion pieces annually in 2023, providing predictable volume. Changes in procurement rules or budgets can ripple into client revenue stability, with award cycles typically 1–5 years. Triumph can prioritize carriers with strong government exposure and time underwriting to award cycles.
- Government volume: USPS ~120B pieces (2023)
- Award cycles: 1–5 years inform underwriting timing
- Priority: favor carriers with resilient government contracts
IIJA ~1.2T & SBCI 10B spur carrier lending; USPS 120B lanes
Federal infrastructure spending (IIJA ~1.2 trillion total; ~550B new) and SBCI (10B) expand demand for carrier lending and factoring while timing risk requires scenario planning. Fuel and clean-vehicle policies (federal diesel tax 24.4 cents/gal; EV credit up to 7,500 dollars) shift fleet capex and residual risk. Stable government volumes (USPS ~120B pieces in 2023) create predictable lanes to prioritize.
| Policy | Metric | Implication |
|---|---|---|
| IIJA | ~1.2T total; ~550B new | Higher equipment financing |
| SBCI | 10B | Lower funding costs |
| USPS | ~120B pieces (2023) | Predictable lanes |
What is included in the product
 Detailed Word Document
Explores how external macro-environmental factors uniquely affect Triumph Financial across Political, Economic, Social, Technological, Environmental, and Legal dimensions, with data-backed trends and forward-looking insights to identify risks and opportunities for executives, investors, and strategists, presented in clean, report-ready format for planning and funding discussions.

 Customizable Excel Spreadsheet
A concise, visually segmented PESTLE summary for Triumph Financial that can be dropped into presentations, annotated with region- or business-specific notes, and easily shared across teams to streamline external risk discussions and strategic alignment.
Economic factors

Freight cycle volatility
Spot vs contract swings directly shift client cash flows and factoring volumes, with container spot rates peaking near $10,000 per FEU in Sept 2021 then plunging roughly 80% into 2023, compressing carriers margins. Downcycles raise delinquencies and advance-rate risk for Triumph as receivable quality deteriorates. Triumph should adopt dynamic advance rates tied to rate indices. Diversifying across truckload, intermodal and specialty segments cushions cyclicality.
Interest rates
Rising benchmarks (Fed funds ~5.25–5.50% in July 2025) increase funding costs for equipment loans and working capital, squeezing margins. Net interest margin hinges on asset/liability repricing speed and effectiveness of hedges. Triumph can ladder funding and deploy interest rate swaps to lock spreads. Regular sensitivity analysis (e.g., ±100bps scenarios) enforces pricing discipline.

Fuel price shocks
Diesel price shocks—highlighted by the U.S. retail diesel peak of $5.719/gal in June 2022 (EIA)—compress carrier margins even when fuel surcharges exist, raising working-capital needs and pushing shippers toward factoring. Higher cash needs lift factoring demand but also elevate credit risk as receivable durations stretch. Triumph can stress-test clients’ surcharge recovery rates and embed indexed covenants to align incentives for active fuel management.

Used truck values
Used truck values fell sharply from post‑pandemic peaks, with Class 8 values down roughly 30% from 2021 highs to 2024, squeezing collateral coverage and increasing loss given default after boom corrections; Triumph must refresh LTVs by class and vintage frequently while leveraging faster online remarketing—median recovery lags fell to about 21 days in 2024, reducing ultimate losses.
- Residual swings: reduce collateral coverage
- Post‑boom corrections: LGD +8–12 ppt risk
- Action: update LTVs by class/vintage frequently
- Remarketing: ~21 day recovery lag (2024)
Labor availability
Labor availability pressures—1.7 million U.S. heavy/tractor-trailer drivers employed (BLS 2023)—mean driver shortages and rising wages shift client cost structures, squeezing margins and prompting fleet consolidation that alters Triumph’s borrower mix. Payroll-smoothing products improve retention and reduce churn risk; portfolio allocation should overweight regions showing tighter labor markets and higher wage growth.
- Driver workforce: 1.7M (BLS 2023)
- Wage pressure: rising driver pay increases client OPEX
- Strategy: payroll-smoothing products; regional portfolio tilt
IIJA ~1.2T & SBCI 10B spur carrier lending; USPS 120B lanes
Spot freight volatility (container rates -~80% from Sept 2021 to 2023) raises delinquencies; funding costs (Fed funds ~5.25–5.50% Jul 2025) squeeze spreads. Diesel shocks (peak $5.719/gal Jun 2022) and Class 8 values -~30% vs 2021 increase LGD; driver shortage (1.7M drivers, BLS 2023) raises borrower OPEX—recommend dynamic advance rates, laddered funding, indexed covenants.
| Metric | Value | Impact |
|---|---|---|
| Fed funds | 5.25–5.50% | Higher funding cost |
| Container swings | -80% | Cashflow shock |
| Diesel peak | $5.719/gal | Higher OPEX |
| Class 8 values | -30% | Lower collateral |
| Drivers | 1.7M | Wage pressure |
Same Document Delivered
Triumph Financial PESTLE Analysis
The preview shown here is the exact Triumph Financial PESTLE Analysis document you’ll receive after purchase—fully formatted and ready to use. The content, layout, and structure are final with no placeholders or teasers. After checkout you’ll instantly download this same professionally structured file.

Your Competitive Advantage Starts with This Report
Discover how political shifts, economic cycles, and technological disruption are reshaping Triumph Financial’s prospects in our concise PESTLE overview—perfect for investors and strategists. This snapshot highlights risks and opportunities; purchase the full PESTLE to access detailed, actionable intelligence and ready-to-use insights for immediate strategy or investment decisions.
Political factors
Infrastructure spending
Federal and state infrastructure investments, anchored by the 2021 Infrastructure Investment and Jobs Act which committed roughly 1.2 trillion dollars total and about 550 billion dollars in new spending (including ~110 billion for roads and bridges and ~17 billion for ports), shift freight flows and raise demand for factoring and equipment loans for carriers. Policy continuity versus gridlock drives capex cycles; Triumph should scenario-plan for accelerated, delayed, and phased funding timelines. Aligning product offerings and partnerships with announced port and road projects can capture incremental volume and financing opportunities.
Trade and tariffs
Shifts in tariffs and cross-border policy alter freight volumes and seasonality, with port operations historically spiking congestion (Los Angeles/Long Beach peaked ~109 ships waiting in 2021). USMCA, in force since 2020, and variable border wait-times compress carriers’ cash cycles Triumph finances. Mapping exposure to import-heavy lanes and hedging portfolio concentrations reduces risk from geopolitical shocks.
Energy policy stance
Triumph clients' operating costs shift with fuel policy—U.S. federal diesel tax is 24.4 cents/gal, while federal clean-vehicle incentives (up to 7,500 dollars consumer EV credit) and IRA/BIL funding boost demand for low-emission trucks. Policy pushes toward cleaner fleets can redirect lending to newer equipment; Triumph can tailor loan structures to capture fuel-transition incentives. Ongoing monitoring of DOE guidance helps price residual and regulatory risk accurately.
SMB support programs
Small-carrier grants, guarantees or tax credits shift credit demand and default risk, and political appetite for Main Street support directly alters factoring volumes; for example the federal Small Business Credit Initiative allocated 10 billion USD to expand lending capacity. Triumph can align with such government-backed programs to lower capital costs and use advocacy to shape eligibility rules that favor owner-operators.
- small-carrier grants
- 10 billion USD SBCI
- lower capital costs via guarantees
- advocacy for owner-operator eligibility
Public procurement and USPS
Government freight and mail contracts create steady lanes for carriers; USPS handled about 120 billion pieces annually in 2023, providing predictable volume. Changes in procurement rules or budgets can ripple into client revenue stability, with award cycles typically 1–5 years. Triumph can prioritize carriers with strong government exposure and time underwriting to award cycles.
- Government volume: USPS ~120B pieces (2023)
- Award cycles: 1–5 years inform underwriting timing
- Priority: favor carriers with resilient government contracts
IIJA ~1.2T & SBCI 10B spur carrier lending; USPS 120B lanes
Federal infrastructure spending (IIJA ~1.2 trillion total; ~550B new) and SBCI (10B) expand demand for carrier lending and factoring while timing risk requires scenario planning. Fuel and clean-vehicle policies (federal diesel tax 24.4 cents/gal; EV credit up to 7,500 dollars) shift fleet capex and residual risk. Stable government volumes (USPS ~120B pieces in 2023) create predictable lanes to prioritize.
| Policy | Metric | Implication |
|---|---|---|
| IIJA | ~1.2T total; ~550B new | Higher equipment financing |
| SBCI | 10B | Lower funding costs |
| USPS | ~120B pieces (2023) | Predictable lanes |
What is included in the product
Detailed Word Document
Explores how external macro-environmental factors uniquely affect Triumph Financial across Political, Economic, Social, Technological, Environmental, and Legal dimensions, with data-backed trends and forward-looking insights to identify risks and opportunities for executives, investors, and strategists, presented in clean, report-ready format for planning and funding discussions.
Customizable Excel Spreadsheet
A concise, visually segmented PESTLE summary for Triumph Financial that can be dropped into presentations, annotated with region- or business-specific notes, and easily shared across teams to streamline external risk discussions and strategic alignment.
Economic factors
Freight cycle volatility
Spot vs contract swings directly shift client cash flows and factoring volumes, with container spot rates peaking near $10,000 per FEU in Sept 2021 then plunging roughly 80% into 2023, compressing carriers margins. Downcycles raise delinquencies and advance-rate risk for Triumph as receivable quality deteriorates. Triumph should adopt dynamic advance rates tied to rate indices. Diversifying across truckload, intermodal and specialty segments cushions cyclicality.
Interest rates
Rising benchmarks (Fed funds ~5.25–5.50% in July 2025) increase funding costs for equipment loans and working capital, squeezing margins. Net interest margin hinges on asset/liability repricing speed and effectiveness of hedges. Triumph can ladder funding and deploy interest rate swaps to lock spreads. Regular sensitivity analysis (e.g., ±100bps scenarios) enforces pricing discipline.
Fuel price shocks
Diesel price shocks—highlighted by the U.S. retail diesel peak of $5.719/gal in June 2022 (EIA)—compress carrier margins even when fuel surcharges exist, raising working-capital needs and pushing shippers toward factoring. Higher cash needs lift factoring demand but also elevate credit risk as receivable durations stretch. Triumph can stress-test clients’ surcharge recovery rates and embed indexed covenants to align incentives for active fuel management.
Used truck values
Used truck values fell sharply from post‑pandemic peaks, with Class 8 values down roughly 30% from 2021 highs to 2024, squeezing collateral coverage and increasing loss given default after boom corrections; Triumph must refresh LTVs by class and vintage frequently while leveraging faster online remarketing—median recovery lags fell to about 21 days in 2024, reducing ultimate losses.
- Residual swings: reduce collateral coverage
- Post‑boom corrections: LGD +8–12 ppt risk
- Action: update LTVs by class/vintage frequently
- Remarketing: ~21 day recovery lag (2024)
Labor availability
Labor availability pressures—1.7 million U.S. heavy/tractor-trailer drivers employed (BLS 2023)—mean driver shortages and rising wages shift client cost structures, squeezing margins and prompting fleet consolidation that alters Triumph’s borrower mix. Payroll-smoothing products improve retention and reduce churn risk; portfolio allocation should overweight regions showing tighter labor markets and higher wage growth.
- Driver workforce: 1.7M (BLS 2023)
- Wage pressure: rising driver pay increases client OPEX
- Strategy: payroll-smoothing products; regional portfolio tilt
IIJA ~1.2T & SBCI 10B spur carrier lending; USPS 120B lanes
Spot freight volatility (container rates -~80% from Sept 2021 to 2023) raises delinquencies; funding costs (Fed funds ~5.25–5.50% Jul 2025) squeeze spreads. Diesel shocks (peak $5.719/gal Jun 2022) and Class 8 values -~30% vs 2021 increase LGD; driver shortage (1.7M drivers, BLS 2023) raises borrower OPEX—recommend dynamic advance rates, laddered funding, indexed covenants.
| Metric | Value | Impact |
|---|---|---|
| Fed funds | 5.25–5.50% | Higher funding cost |
| Container swings | -80% | Cashflow shock |
| Diesel peak | $5.719/gal | Higher OPEX |
| Class 8 values | -30% | Lower collateral |
| Drivers | 1.7M | Wage pressure |
Same Document Delivered
Triumph Financial PESTLE Analysis
The preview shown here is the exact Triumph Financial PESTLE Analysis document you’ll receive after purchase—fully formatted and ready to use. The content, layout, and structure are final with no placeholders or teasers. After checkout you’ll instantly download this same professionally structured file.
Original: $10.00
-65%$10.00
$3.50Description
Your Competitive Advantage Starts with This Report
Discover how political shifts, economic cycles, and technological disruption are reshaping Triumph Financial’s prospects in our concise PESTLE overview—perfect for investors and strategists. This snapshot highlights risks and opportunities; purchase the full PESTLE to access detailed, actionable intelligence and ready-to-use insights for immediate strategy or investment decisions.
Political factors
Infrastructure spending
Federal and state infrastructure investments, anchored by the 2021 Infrastructure Investment and Jobs Act which committed roughly 1.2 trillion dollars total and about 550 billion dollars in new spending (including ~110 billion for roads and bridges and ~17 billion for ports), shift freight flows and raise demand for factoring and equipment loans for carriers. Policy continuity versus gridlock drives capex cycles; Triumph should scenario-plan for accelerated, delayed, and phased funding timelines. Aligning product offerings and partnerships with announced port and road projects can capture incremental volume and financing opportunities.
Trade and tariffs
Shifts in tariffs and cross-border policy alter freight volumes and seasonality, with port operations historically spiking congestion (Los Angeles/Long Beach peaked ~109 ships waiting in 2021). USMCA, in force since 2020, and variable border wait-times compress carriers’ cash cycles Triumph finances. Mapping exposure to import-heavy lanes and hedging portfolio concentrations reduces risk from geopolitical shocks.
Energy policy stance
Triumph clients' operating costs shift with fuel policy—U.S. federal diesel tax is 24.4 cents/gal, while federal clean-vehicle incentives (up to 7,500 dollars consumer EV credit) and IRA/BIL funding boost demand for low-emission trucks. Policy pushes toward cleaner fleets can redirect lending to newer equipment; Triumph can tailor loan structures to capture fuel-transition incentives. Ongoing monitoring of DOE guidance helps price residual and regulatory risk accurately.
SMB support programs
Small-carrier grants, guarantees or tax credits shift credit demand and default risk, and political appetite for Main Street support directly alters factoring volumes; for example the federal Small Business Credit Initiative allocated 10 billion USD to expand lending capacity. Triumph can align with such government-backed programs to lower capital costs and use advocacy to shape eligibility rules that favor owner-operators.
- small-carrier grants
- 10 billion USD SBCI
- lower capital costs via guarantees
- advocacy for owner-operator eligibility
Public procurement and USPS
Government freight and mail contracts create steady lanes for carriers; USPS handled about 120 billion pieces annually in 2023, providing predictable volume. Changes in procurement rules or budgets can ripple into client revenue stability, with award cycles typically 1–5 years. Triumph can prioritize carriers with strong government exposure and time underwriting to award cycles.
- Government volume: USPS ~120B pieces (2023)
- Award cycles: 1–5 years inform underwriting timing
- Priority: favor carriers with resilient government contracts
IIJA ~1.2T & SBCI 10B spur carrier lending; USPS 120B lanes
Federal infrastructure spending (IIJA ~1.2 trillion total; ~550B new) and SBCI (10B) expand demand for carrier lending and factoring while timing risk requires scenario planning. Fuel and clean-vehicle policies (federal diesel tax 24.4 cents/gal; EV credit up to 7,500 dollars) shift fleet capex and residual risk. Stable government volumes (USPS ~120B pieces in 2023) create predictable lanes to prioritize.
| Policy | Metric | Implication |
|---|---|---|
| IIJA | ~1.2T total; ~550B new | Higher equipment financing |
| SBCI | 10B | Lower funding costs |
| USPS | ~120B pieces (2023) | Predictable lanes |
What is included in the product
Detailed Word Document
Explores how external macro-environmental factors uniquely affect Triumph Financial across Political, Economic, Social, Technological, Environmental, and Legal dimensions, with data-backed trends and forward-looking insights to identify risks and opportunities for executives, investors, and strategists, presented in clean, report-ready format for planning and funding discussions.
Customizable Excel Spreadsheet
A concise, visually segmented PESTLE summary for Triumph Financial that can be dropped into presentations, annotated with region- or business-specific notes, and easily shared across teams to streamline external risk discussions and strategic alignment.
Economic factors
Freight cycle volatility
Spot vs contract swings directly shift client cash flows and factoring volumes, with container spot rates peaking near $10,000 per FEU in Sept 2021 then plunging roughly 80% into 2023, compressing carriers margins. Downcycles raise delinquencies and advance-rate risk for Triumph as receivable quality deteriorates. Triumph should adopt dynamic advance rates tied to rate indices. Diversifying across truckload, intermodal and specialty segments cushions cyclicality.
Interest rates
Rising benchmarks (Fed funds ~5.25–5.50% in July 2025) increase funding costs for equipment loans and working capital, squeezing margins. Net interest margin hinges on asset/liability repricing speed and effectiveness of hedges. Triumph can ladder funding and deploy interest rate swaps to lock spreads. Regular sensitivity analysis (e.g., ±100bps scenarios) enforces pricing discipline.
Fuel price shocks
Diesel price shocks—highlighted by the U.S. retail diesel peak of $5.719/gal in June 2022 (EIA)—compress carrier margins even when fuel surcharges exist, raising working-capital needs and pushing shippers toward factoring. Higher cash needs lift factoring demand but also elevate credit risk as receivable durations stretch. Triumph can stress-test clients’ surcharge recovery rates and embed indexed covenants to align incentives for active fuel management.
Used truck values
Used truck values fell sharply from post‑pandemic peaks, with Class 8 values down roughly 30% from 2021 highs to 2024, squeezing collateral coverage and increasing loss given default after boom corrections; Triumph must refresh LTVs by class and vintage frequently while leveraging faster online remarketing—median recovery lags fell to about 21 days in 2024, reducing ultimate losses.
- Residual swings: reduce collateral coverage
- Post‑boom corrections: LGD +8–12 ppt risk
- Action: update LTVs by class/vintage frequently
- Remarketing: ~21 day recovery lag (2024)
Labor availability
Labor availability pressures—1.7 million U.S. heavy/tractor-trailer drivers employed (BLS 2023)—mean driver shortages and rising wages shift client cost structures, squeezing margins and prompting fleet consolidation that alters Triumph’s borrower mix. Payroll-smoothing products improve retention and reduce churn risk; portfolio allocation should overweight regions showing tighter labor markets and higher wage growth.
- Driver workforce: 1.7M (BLS 2023)
- Wage pressure: rising driver pay increases client OPEX
- Strategy: payroll-smoothing products; regional portfolio tilt
IIJA ~1.2T & SBCI 10B spur carrier lending; USPS 120B lanes
Spot freight volatility (container rates -~80% from Sept 2021 to 2023) raises delinquencies; funding costs (Fed funds ~5.25–5.50% Jul 2025) squeeze spreads. Diesel shocks (peak $5.719/gal Jun 2022) and Class 8 values -~30% vs 2021 increase LGD; driver shortage (1.7M drivers, BLS 2023) raises borrower OPEX—recommend dynamic advance rates, laddered funding, indexed covenants.
| Metric | Value | Impact |
|---|---|---|
| Fed funds | 5.25–5.50% | Higher funding cost |
| Container swings | -80% | Cashflow shock |
| Diesel peak | $5.719/gal | Higher OPEX |
| Class 8 values | -30% | Lower collateral |
| Drivers | 1.7M | Wage pressure |
Same Document Delivered
Triumph Financial PESTLE Analysis
The preview shown here is the exact Triumph Financial PESTLE Analysis document you’ll receive after purchase—fully formatted and ready to use. The content, layout, and structure are final with no placeholders or teasers. After checkout you’ll instantly download this same professionally structured file.











