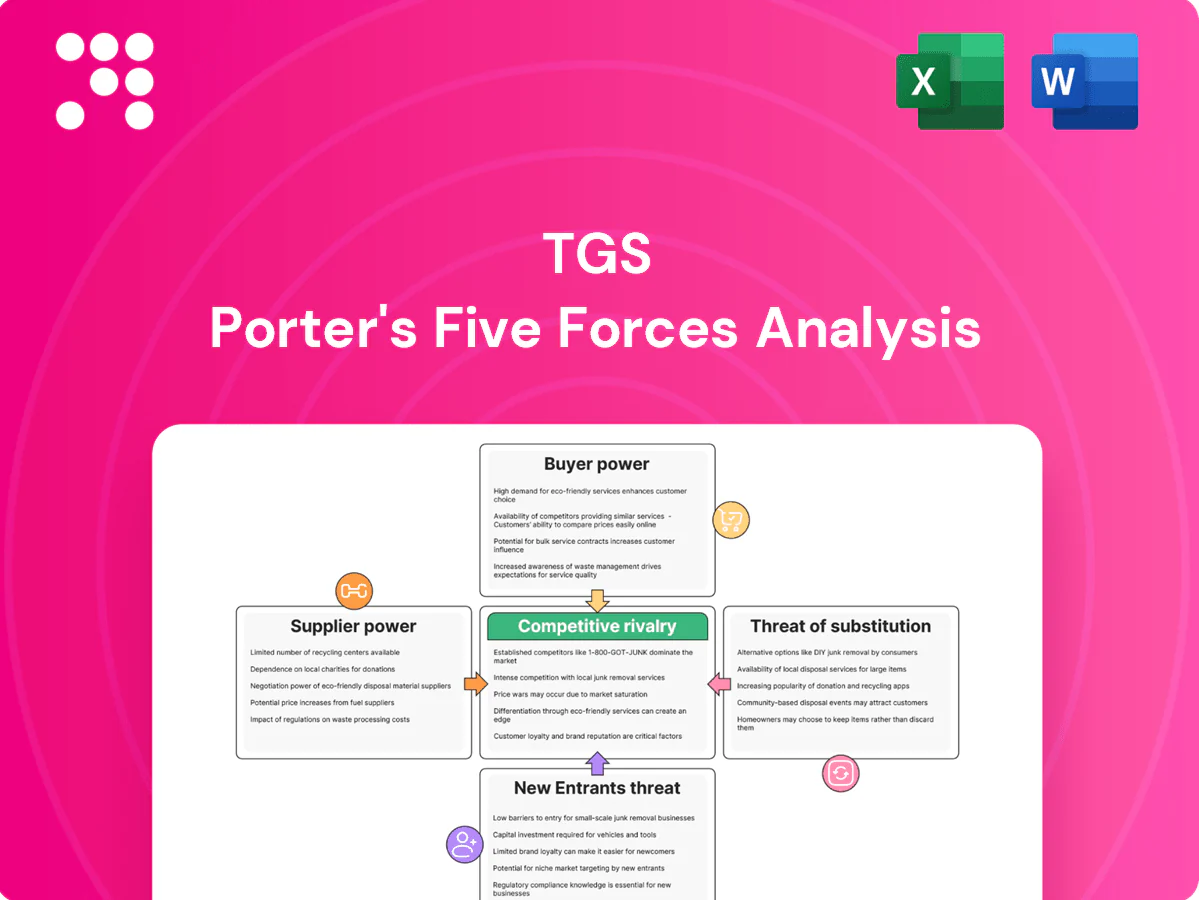
TGS Porter's Five Forces Analysis

From Overview to Strategy Blueprint
TGS's Porter’s Five Forces snapshot highlights key pressures—from supplier leverage and buyer bargaining to competitive rivalry and substitute risks—showing where strategic vulnerabilities lie. This brief overview teases force-by-force implications and competitive positioning. Unlock the full Porter’s Five Forces Analysis to access detailed ratings, visuals, and actionable insights to inform investment or strategy decisions.
Suppliers Bargaining Power

Specialized seismic equipment vendors
Providers of seismic vessels, nodes, streamers and processing hardware remain highly concentrated, with the top three vendors controlling roughly 60% of capacity in 2024, giving them pricing and availability leverage. High switching costs from integration and calibration mean clients face multi-month redeployment and certification cycles. Long-term framework agreements and multi-supplier strategies—which account for over half of current contracts—help moderate supplier power. Supply-chain disruptions and tight vessel markets lifted vessel day rates ~25% year‑over‑year in 2023–24, extending delivery times.
Exclusive geological and governmental data sources
As of 2024 many national data repositories, licensing agencies and geological surveys remain controlled by governments and NOCs, creating exclusive access to subsurface information. Governments often set terms, timelines and strict data-usage rules, and permit lead times are routinely measured in months, increasing dependency on these suppliers. Compliance burdens and local content rules heighten supplier power, while strong local partnerships can materially reduce access delays and contractual friction.

Skilled geoscientists and data scientists
Talent scarcity in advanced imaging, machine learning and subsurface interpretation drove wage pressure in 2024, with median data scientist pay around $120,000 and geoscientist pay near $95,000, and reported salary growth roughly 8–12% year-over-year.
Retention and recruitment are critical as project-based demand spikes create intermittent hiring surges and contractor premiums.
Remote work and global talent pools ease supply constraints but onboarding and deep domain expertise remain bottlenecks; a strong employer brand and clear career pathways materially reduce supplier power.

Cloud and high-performance compute providers
HPC, large-scale storage and cloud analytics are core to processing massive datasets; the global HPC/cloud infrastructure demand drove an estimated market around 45 billion USD in 2024. A few hyperscalers—AWS ~33%, Azure ~22%, GCP ~12% market share in 2024—can exert pricing influence, while multi-cloud strategies and in-house optimization reduce vendor lock-in; data egress fees and 99.9–99.99% performance SLAs are key negotiation levers.
- HPC/storage critical to TGS workflows
- Top 3 hyperscalers ~67% share (2024)
- Global HPC/cloud infra ~45B USD (2024)
- Negotiate egress fees and 99.9–99.99% SLAs
Sensor, satellite, and metocean data inputs
Sensor, satellite, and metocean inputs for renewables siting and CCS (wind, wave, current, satellite imagery) come from niche providers whose data quality, spatial coverage, and update frequency — sub‑meter resolution and daily revisit widely available by 2024 — drive substitution options and pricing power.
- High quality, frequent feeds reduce supplier switchability
- Bundled multi-year feeds yield better commercial terms
- Market fragmentation lets TGS arbitrage sources and negotiate
Top suppliers (~60%) squeeze pricing; vessels +25%
Top suppliers (top‑3 ~60% capacity) and hyperscalers (AWS ~33%, Azure ~22%, GCP ~12% in 2024) exert pricing and availability pressure; vessel day‑rates rose ~25% YoY in 2023–24. Long‑term frameworks and multi‑supplier contracts (>50% of deals) moderate but don’t eliminate leverage. Talent scarcity and government-controlled subsurface data sustain asymmetric supplier power.
| Metric | 2024 |
|---|---|
| Top‑3 vendor share | ~60% |
| Vessel day‑rate change | +25% YoY |
| HPC/cloud market | $45B |
| Data scientist pay (median) | $120k |
What is included in the product
 Detailed Word Document
Tailored Porter’s Five Forces analysis for TGS that uncovers key drivers of competition, buyer and supplier power, barriers to entry, substitutes, and emergent threats to market share. Strategic commentary and industry data reveal pricing influence, profitability risks, and defensive positions TGS can leverage.

 Customizable Excel Spreadsheet
A concise one-sheet TGS Porter's Five Forces summary that instantly visualizes competitive pressure with an interactive spider chart, lets you customize force levels for evolving market scenarios, and slots cleanly into decks or Excel dashboards—no macros or finance expertise needed.
Customers Bargaining Power

Concentrated oil and gas supermajors/NOCs
Large E&Ps and NOCs buy at scale and secure volume discounts and preferred license terms; top supermajors' combined upstream capex exceeded roughly $80–90 billion in 2023–24, amplifying buyer leverage. They pit vendors in competitive bid rounds and use 3–5 year procurement cycles and strict CAPEX oversight to extract favorable pricing. TGS's unique library assets and faster imaging lower price sensitivity but do not eliminate strong buyer negotiation power.
Project cyclicality and budget volatility
Exploration spend swings with commodity prices—Brent averaged about $88/bbl in 2024—reducing buyers willingness to pay and prompting delays or cancellations of surveys in downturns. Customers demand flexible terms and deferments, strengthening their bargaining power. TGS offsets this via multi-client models and pre-funding pools that stabilize cash flow. Growing countercyclical demand for renewables and CCS services helps damp revenue volatility.

Data substitutability and reprocessing options
Buyers often reprocess legacy data instead of buying new surveys, with reprocessing able to reduce acquisition costs by up to 50% versus new shoots in 2024. Overlap among competing libraries enables switching when datasets cover similar basins, increasing buyer mobility. Superior resolution, broader coverage and faster turnaround from providers materially reduce buyer leverage. Differentiated analytics and interpretation services raise customer stickiness and lifetime value.

Procurement sophistication and compliance
Enterprise procurement now enforces strict technical, security and ESG requirements that lengthen sales cycles and increase discount pressure; in 2024 surveys procurement-led deals saw sales-cycle increases of up to 40% and margin compression from heightened rebate and compliance demands.
- Preferred supplier lists: enforce price benchmarks, limit smaller rivals
- Certifications: ISO27001/SSAE and ESG reports reduce pushback
- ROI proof: shortlists prioritize demonstrable payback
Emerging renewables developers
Emerging renewables developers are growing but remain fragmented and price‑conscious; by 2024 global offshore wind capacity surpassed 70 GW and over 200 CCS projects were reported in development, so many buyers test smaller pilots before scaling contracts. Bundling multi‑source datasets with planning tools raises perceived value and can justify premium pricing, while early engagement in lease rounds measurably reduces buyer price sensitivity.
- Fragmented buyers
- Price-conscious
- Pilot-first approach
- Data+tools = higher value
- Early lease engagement lowers price pressure
Buyers hold leverage; reprocessing saves 50%, procurement cycles lengthen
Large buyers (supermajors capex ~80–90bn USD in 2023–24) secure volume discounts and 3–5y procurement cycles; Brent averaged ~88 USD/bbl in 2024, depressing spend. Reprocessing cut costs up to 50% vs new surveys; procurement-led deals lengthened ~40% in 2024. TGS library and analytics raise stickiness, but buyer leverage remains high.
| Metric | 2024 value |
|---|---|
| Supermajors upstream capex | 80–90bn USD |
| Brent avg | ~88 USD/bbl |
| Reprocessing cost saving | up to 50% |
| Sales-cycle increase | ~40% |
Preview Before You Purchase
TGS Porter's Five Forces Analysis
This preview shows the exact TGS Porter's Five Forces Analysis you'll receive immediately after purchase—no placeholders or mockups. The document displayed is fully formatted, professionally written, and ready for download and use the moment you buy. You're viewing the final deliverable; once payment is complete you get instant access to this identical file.

From Overview to Strategy Blueprint
TGS's Porter’s Five Forces snapshot highlights key pressures—from supplier leverage and buyer bargaining to competitive rivalry and substitute risks—showing where strategic vulnerabilities lie. This brief overview teases force-by-force implications and competitive positioning. Unlock the full Porter’s Five Forces Analysis to access detailed ratings, visuals, and actionable insights to inform investment or strategy decisions.
Suppliers Bargaining Power
Specialized seismic equipment vendors
Providers of seismic vessels, nodes, streamers and processing hardware remain highly concentrated, with the top three vendors controlling roughly 60% of capacity in 2024, giving them pricing and availability leverage. High switching costs from integration and calibration mean clients face multi-month redeployment and certification cycles. Long-term framework agreements and multi-supplier strategies—which account for over half of current contracts—help moderate supplier power. Supply-chain disruptions and tight vessel markets lifted vessel day rates ~25% year‑over‑year in 2023–24, extending delivery times.
Exclusive geological and governmental data sources
As of 2024 many national data repositories, licensing agencies and geological surveys remain controlled by governments and NOCs, creating exclusive access to subsurface information. Governments often set terms, timelines and strict data-usage rules, and permit lead times are routinely measured in months, increasing dependency on these suppliers. Compliance burdens and local content rules heighten supplier power, while strong local partnerships can materially reduce access delays and contractual friction.
Skilled geoscientists and data scientists
Talent scarcity in advanced imaging, machine learning and subsurface interpretation drove wage pressure in 2024, with median data scientist pay around $120,000 and geoscientist pay near $95,000, and reported salary growth roughly 8–12% year-over-year.
Retention and recruitment are critical as project-based demand spikes create intermittent hiring surges and contractor premiums.
Remote work and global talent pools ease supply constraints but onboarding and deep domain expertise remain bottlenecks; a strong employer brand and clear career pathways materially reduce supplier power.
Cloud and high-performance compute providers
HPC, large-scale storage and cloud analytics are core to processing massive datasets; the global HPC/cloud infrastructure demand drove an estimated market around 45 billion USD in 2024. A few hyperscalers—AWS ~33%, Azure ~22%, GCP ~12% market share in 2024—can exert pricing influence, while multi-cloud strategies and in-house optimization reduce vendor lock-in; data egress fees and 99.9–99.99% performance SLAs are key negotiation levers.
- HPC/storage critical to TGS workflows
- Top 3 hyperscalers ~67% share (2024)
- Global HPC/cloud infra ~45B USD (2024)
- Negotiate egress fees and 99.9–99.99% SLAs
Sensor, satellite, and metocean data inputs
Sensor, satellite, and metocean inputs for renewables siting and CCS (wind, wave, current, satellite imagery) come from niche providers whose data quality, spatial coverage, and update frequency — sub‑meter resolution and daily revisit widely available by 2024 — drive substitution options and pricing power.
- High quality, frequent feeds reduce supplier switchability
- Bundled multi-year feeds yield better commercial terms
- Market fragmentation lets TGS arbitrage sources and negotiate
Top suppliers (~60%) squeeze pricing; vessels +25%
Top suppliers (top‑3 ~60% capacity) and hyperscalers (AWS ~33%, Azure ~22%, GCP ~12% in 2024) exert pricing and availability pressure; vessel day‑rates rose ~25% YoY in 2023–24. Long‑term frameworks and multi‑supplier contracts (>50% of deals) moderate but don’t eliminate leverage. Talent scarcity and government-controlled subsurface data sustain asymmetric supplier power.
| Metric | 2024 |
|---|---|
| Top‑3 vendor share | ~60% |
| Vessel day‑rate change | +25% YoY |
| HPC/cloud market | $45B |
| Data scientist pay (median) | $120k |
What is included in the product
Detailed Word Document
Tailored Porter’s Five Forces analysis for TGS that uncovers key drivers of competition, buyer and supplier power, barriers to entry, substitutes, and emergent threats to market share. Strategic commentary and industry data reveal pricing influence, profitability risks, and defensive positions TGS can leverage.
Customizable Excel Spreadsheet
A concise one-sheet TGS Porter's Five Forces summary that instantly visualizes competitive pressure with an interactive spider chart, lets you customize force levels for evolving market scenarios, and slots cleanly into decks or Excel dashboards—no macros or finance expertise needed.
Customers Bargaining Power
Concentrated oil and gas supermajors/NOCs
Large E&Ps and NOCs buy at scale and secure volume discounts and preferred license terms; top supermajors' combined upstream capex exceeded roughly $80–90 billion in 2023–24, amplifying buyer leverage. They pit vendors in competitive bid rounds and use 3–5 year procurement cycles and strict CAPEX oversight to extract favorable pricing. TGS's unique library assets and faster imaging lower price sensitivity but do not eliminate strong buyer negotiation power.
Project cyclicality and budget volatility
Exploration spend swings with commodity prices—Brent averaged about $88/bbl in 2024—reducing buyers willingness to pay and prompting delays or cancellations of surveys in downturns. Customers demand flexible terms and deferments, strengthening their bargaining power. TGS offsets this via multi-client models and pre-funding pools that stabilize cash flow. Growing countercyclical demand for renewables and CCS services helps damp revenue volatility.
Data substitutability and reprocessing options
Buyers often reprocess legacy data instead of buying new surveys, with reprocessing able to reduce acquisition costs by up to 50% versus new shoots in 2024. Overlap among competing libraries enables switching when datasets cover similar basins, increasing buyer mobility. Superior resolution, broader coverage and faster turnaround from providers materially reduce buyer leverage. Differentiated analytics and interpretation services raise customer stickiness and lifetime value.
Procurement sophistication and compliance
Enterprise procurement now enforces strict technical, security and ESG requirements that lengthen sales cycles and increase discount pressure; in 2024 surveys procurement-led deals saw sales-cycle increases of up to 40% and margin compression from heightened rebate and compliance demands.
- Preferred supplier lists: enforce price benchmarks, limit smaller rivals
- Certifications: ISO27001/SSAE and ESG reports reduce pushback
- ROI proof: shortlists prioritize demonstrable payback
Emerging renewables developers
Emerging renewables developers are growing but remain fragmented and price‑conscious; by 2024 global offshore wind capacity surpassed 70 GW and over 200 CCS projects were reported in development, so many buyers test smaller pilots before scaling contracts. Bundling multi‑source datasets with planning tools raises perceived value and can justify premium pricing, while early engagement in lease rounds measurably reduces buyer price sensitivity.
- Fragmented buyers
- Price-conscious
- Pilot-first approach
- Data+tools = higher value
- Early lease engagement lowers price pressure
Buyers hold leverage; reprocessing saves 50%, procurement cycles lengthen
Large buyers (supermajors capex ~80–90bn USD in 2023–24) secure volume discounts and 3–5y procurement cycles; Brent averaged ~88 USD/bbl in 2024, depressing spend. Reprocessing cut costs up to 50% vs new surveys; procurement-led deals lengthened ~40% in 2024. TGS library and analytics raise stickiness, but buyer leverage remains high.
| Metric | 2024 value |
|---|---|
| Supermajors upstream capex | 80–90bn USD |
| Brent avg | ~88 USD/bbl |
| Reprocessing cost saving | up to 50% |
| Sales-cycle increase | ~40% |
Preview Before You Purchase
TGS Porter's Five Forces Analysis
This preview shows the exact TGS Porter's Five Forces Analysis you'll receive immediately after purchase—no placeholders or mockups. The document displayed is fully formatted, professionally written, and ready for download and use the moment you buy. You're viewing the final deliverable; once payment is complete you get instant access to this identical file.
Description
From Overview to Strategy Blueprint
TGS's Porter’s Five Forces snapshot highlights key pressures—from supplier leverage and buyer bargaining to competitive rivalry and substitute risks—showing where strategic vulnerabilities lie. This brief overview teases force-by-force implications and competitive positioning. Unlock the full Porter’s Five Forces Analysis to access detailed ratings, visuals, and actionable insights to inform investment or strategy decisions.
Suppliers Bargaining Power
Specialized seismic equipment vendors
Providers of seismic vessels, nodes, streamers and processing hardware remain highly concentrated, with the top three vendors controlling roughly 60% of capacity in 2024, giving them pricing and availability leverage. High switching costs from integration and calibration mean clients face multi-month redeployment and certification cycles. Long-term framework agreements and multi-supplier strategies—which account for over half of current contracts—help moderate supplier power. Supply-chain disruptions and tight vessel markets lifted vessel day rates ~25% year‑over‑year in 2023–24, extending delivery times.
Exclusive geological and governmental data sources
As of 2024 many national data repositories, licensing agencies and geological surveys remain controlled by governments and NOCs, creating exclusive access to subsurface information. Governments often set terms, timelines and strict data-usage rules, and permit lead times are routinely measured in months, increasing dependency on these suppliers. Compliance burdens and local content rules heighten supplier power, while strong local partnerships can materially reduce access delays and contractual friction.
Skilled geoscientists and data scientists
Talent scarcity in advanced imaging, machine learning and subsurface interpretation drove wage pressure in 2024, with median data scientist pay around $120,000 and geoscientist pay near $95,000, and reported salary growth roughly 8–12% year-over-year.
Retention and recruitment are critical as project-based demand spikes create intermittent hiring surges and contractor premiums.
Remote work and global talent pools ease supply constraints but onboarding and deep domain expertise remain bottlenecks; a strong employer brand and clear career pathways materially reduce supplier power.
Cloud and high-performance compute providers
HPC, large-scale storage and cloud analytics are core to processing massive datasets; the global HPC/cloud infrastructure demand drove an estimated market around 45 billion USD in 2024. A few hyperscalers—AWS ~33%, Azure ~22%, GCP ~12% market share in 2024—can exert pricing influence, while multi-cloud strategies and in-house optimization reduce vendor lock-in; data egress fees and 99.9–99.99% performance SLAs are key negotiation levers.
- HPC/storage critical to TGS workflows
- Top 3 hyperscalers ~67% share (2024)
- Global HPC/cloud infra ~45B USD (2024)
- Negotiate egress fees and 99.9–99.99% SLAs
Sensor, satellite, and metocean data inputs
Sensor, satellite, and metocean inputs for renewables siting and CCS (wind, wave, current, satellite imagery) come from niche providers whose data quality, spatial coverage, and update frequency — sub‑meter resolution and daily revisit widely available by 2024 — drive substitution options and pricing power.
- High quality, frequent feeds reduce supplier switchability
- Bundled multi-year feeds yield better commercial terms
- Market fragmentation lets TGS arbitrage sources and negotiate
Top suppliers (~60%) squeeze pricing; vessels +25%
Top suppliers (top‑3 ~60% capacity) and hyperscalers (AWS ~33%, Azure ~22%, GCP ~12% in 2024) exert pricing and availability pressure; vessel day‑rates rose ~25% YoY in 2023–24. Long‑term frameworks and multi‑supplier contracts (>50% of deals) moderate but don’t eliminate leverage. Talent scarcity and government-controlled subsurface data sustain asymmetric supplier power.
| Metric | 2024 |
|---|---|
| Top‑3 vendor share | ~60% |
| Vessel day‑rate change | +25% YoY |
| HPC/cloud market | $45B |
| Data scientist pay (median) | $120k |
What is included in the product
Detailed Word Document
Tailored Porter’s Five Forces analysis for TGS that uncovers key drivers of competition, buyer and supplier power, barriers to entry, substitutes, and emergent threats to market share. Strategic commentary and industry data reveal pricing influence, profitability risks, and defensive positions TGS can leverage.
Customizable Excel Spreadsheet
A concise one-sheet TGS Porter's Five Forces summary that instantly visualizes competitive pressure with an interactive spider chart, lets you customize force levels for evolving market scenarios, and slots cleanly into decks or Excel dashboards—no macros or finance expertise needed.
Customers Bargaining Power
Concentrated oil and gas supermajors/NOCs
Large E&Ps and NOCs buy at scale and secure volume discounts and preferred license terms; top supermajors' combined upstream capex exceeded roughly $80–90 billion in 2023–24, amplifying buyer leverage. They pit vendors in competitive bid rounds and use 3–5 year procurement cycles and strict CAPEX oversight to extract favorable pricing. TGS's unique library assets and faster imaging lower price sensitivity but do not eliminate strong buyer negotiation power.
Project cyclicality and budget volatility
Exploration spend swings with commodity prices—Brent averaged about $88/bbl in 2024—reducing buyers willingness to pay and prompting delays or cancellations of surveys in downturns. Customers demand flexible terms and deferments, strengthening their bargaining power. TGS offsets this via multi-client models and pre-funding pools that stabilize cash flow. Growing countercyclical demand for renewables and CCS services helps damp revenue volatility.
Data substitutability and reprocessing options
Buyers often reprocess legacy data instead of buying new surveys, with reprocessing able to reduce acquisition costs by up to 50% versus new shoots in 2024. Overlap among competing libraries enables switching when datasets cover similar basins, increasing buyer mobility. Superior resolution, broader coverage and faster turnaround from providers materially reduce buyer leverage. Differentiated analytics and interpretation services raise customer stickiness and lifetime value.
Procurement sophistication and compliance
Enterprise procurement now enforces strict technical, security and ESG requirements that lengthen sales cycles and increase discount pressure; in 2024 surveys procurement-led deals saw sales-cycle increases of up to 40% and margin compression from heightened rebate and compliance demands.
- Preferred supplier lists: enforce price benchmarks, limit smaller rivals
- Certifications: ISO27001/SSAE and ESG reports reduce pushback
- ROI proof: shortlists prioritize demonstrable payback
Emerging renewables developers
Emerging renewables developers are growing but remain fragmented and price‑conscious; by 2024 global offshore wind capacity surpassed 70 GW and over 200 CCS projects were reported in development, so many buyers test smaller pilots before scaling contracts. Bundling multi‑source datasets with planning tools raises perceived value and can justify premium pricing, while early engagement in lease rounds measurably reduces buyer price sensitivity.
- Fragmented buyers
- Price-conscious
- Pilot-first approach
- Data+tools = higher value
- Early lease engagement lowers price pressure
Buyers hold leverage; reprocessing saves 50%, procurement cycles lengthen
Large buyers (supermajors capex ~80–90bn USD in 2023–24) secure volume discounts and 3–5y procurement cycles; Brent averaged ~88 USD/bbl in 2024, depressing spend. Reprocessing cut costs up to 50% vs new surveys; procurement-led deals lengthened ~40% in 2024. TGS library and analytics raise stickiness, but buyer leverage remains high.
| Metric | 2024 value |
|---|---|
| Supermajors upstream capex | 80–90bn USD |
| Brent avg | ~88 USD/bbl |
| Reprocessing cost saving | up to 50% |
| Sales-cycle increase | ~40% |
Preview Before You Purchase
TGS Porter's Five Forces Analysis
This preview shows the exact TGS Porter's Five Forces Analysis you'll receive immediately after purchase—no placeholders or mockups. The document displayed is fully formatted, professionally written, and ready for download and use the moment you buy. You're viewing the final deliverable; once payment is complete you get instant access to this identical file.











