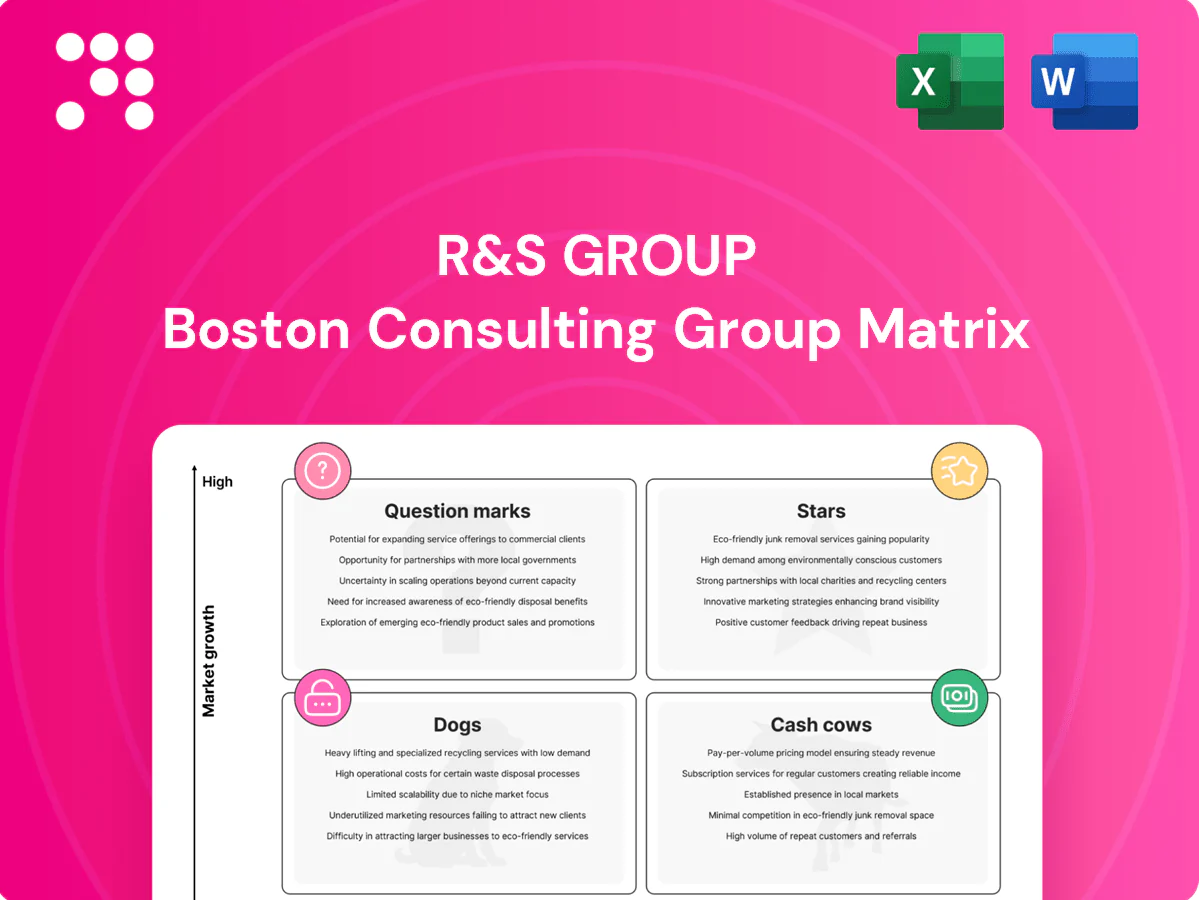
R&S Group Boston Consulting Group Matrix

Unlock Strategic Clarity
The R&S Group BCG Matrix snapshot shows who’s winning, who’s draining cash, and where opportunity hides — but it’s just the tip of the iceberg. Want quadrant-level clarity, prioritized actions, and numbers you can take to the board? Purchase the full BCG Matrix for a ready-to-use Word report plus an Excel summary with clear recommendations so you can decide where to invest, divest, or double down. Get it and skip the guesswork.
Stars

Utility‑grade switchgear programs
Utility‑grade switchgear programs are Stars: they hold high market share with utilities and industrial plants and lead bids and specs, pulling substantial follow‑on work. IEA reported global electricity demand rose 2.4% in 2023, supporting 2024 grid expansion and sustained demand for switchgear. Projects consume working capital during build but repay through reputation and repeat orders; keep investing in capacity and delivery speed to retain the lead.
Industrial automation & control systems
Industrial automation & control systems sit in the Stars quadrant as factory and logistics automation demand accelerates, with the global industrial automation market topping an estimated 250 billion USD in 2024 and ~7% CAGR. R&S leverages a strong install base and a sticky service tail, yielding high visibility but current engineering and commissioning keep cash in roughly matching cash out. Prioritize talent and strategic integrator partnerships to convert high growth into sustainable margin expansion.

Renewables substation & grid‑connection packages
Wind, solar and storage projects require turnkey protection and control systems delivered fast, and R&S solutions are frequently specified early, securing share advantage in the hot renewables market. Long development cycles consume cash, yet R&S reports a strong, high‑quality pipeline and recurring demand underpinned by framework agreements. Standardized kits and secure contracts enable rapid scaling and margin protection.

Smart building electrical fit‑outs (tier‑A commercial)
Premium offices, hospitals and data centers accelerated intelligent power/control upgrades in 2024; sector growth runs near a 10% CAGR (2024–30) as clients pay for reliability. R&S wins on quality and end‑to‑end delivery, securing a leading share in a growing tier‑A fit‑out niche. Heavy coordination keeps margins tight; invest in BIM/DFMA and site leadership to lock position.
- Premium segment focus
- End‑to‑end delivery advantage
- 10% CAGR (2024–30)
- BIM/DFMA + site leaders = moat
Medium‑voltage switchgear modernization
Medium‑voltage switchgear modernization sits as a Star in R&S Group’s BCG matrix: 2024 reliability mandates are accelerating fleet replacements, and R&S’s engineered replacements lead spec lists and approvals. Growth is strong while project cash needs remain elevated until customer acceptance; securing vendor slots and pre‑engineered variants speeds throughput and margin conversion.
- 2024 regulatory uptick
- Spec & approval leadership
- High project cash burn
- Secure vendor slots
- Pre‑engineered variants
Prioritize capacity, pre-eng kits, BIM/DFMA, commissioning to capture 2024 growth
Stars: utility switchgear, industrial automation, renewables, premium fit-outs and MV modernization all show high share and double‑digit/strong growth in 2024 (IEA electricity +2.4% in 2023; industrial automation ~250bn USD in 2024, ~7% CAGR; premium fit‑outs ~10% CAGR 2024–30). Projects consume cash during delivery; prioritize capacity, pre‑engineered kits, BIM/DFMA and commissioning skills to convert growth to margin.
| Segment | 2024 KPI | Growth | Cash burn | Priority |
|---|---|---|---|---|
| Utility switchgear | High share | Stable+ | High | Capacity |
| Industrial automation | 250bn USD | ~7% CAGR | Neutral | Talent |
| Renewables | Strong pipeline | High | High | Standard kits |
| Premium fit‑outs | Tier‑A lead | ~10% CAGR | Moderate | BIM/DFMA |
| MV modernization | Regulatory uptick 2024 | High | High | Pre‑engines |
What is included in the product
 Detailed Word Document
In-depth review of R&S Group's products across BCG quadrants, with clear investment, hold, or divest guidance and trend context.

 Customizable Excel Spreadsheet
One-page BCG Matrix that maps R&S units to prioritize resources—quick, printable, C‑suite ready.
Cash Cows

Residential & SME electrical installations
Residential & SME electrical installations sit in a mature market with stable demand and high local brand recall, driving over 70% of leads via referrals. Standard scopes and predictable crews deliver solid gross margins around 25–30% when scheduling and routing are optimized. Low promotional spend needed; service repeatability makes this a cash-milk segment. Prioritize routing and procurement efficiencies to maximize steady cash flow.
Standard low‑voltage switchboards
Standard low‑voltage switchboards are R&S Group’s core catalog panels with repeatable designs and short lead times (typically 2–3 weeks), delivering high utilization and an estimated gross margin near 28% on catalog SKUs. They occupy a high share in a slow‑growth segment (approx. 1–3% CAGR) and are efficient to produce with low engineering drag. Tight yields (target ≤2% scrap) and negotiated volume buys (discounts 5–12%) widen contribution.

Preventive maintenance contracts
Preventive maintenance contracts deliver recurring revenue across the installed base, typically accounting for over 70% of service income with churn under 5%. They are mature, low-growth but high gross-margin (around 60%) offerings with minimal selling cost once landed. Expanding coverage and using remote checklists can improve cash conversion by 10–20%.

Retrofit & compliance upgrades
Retrofit & compliance upgrades deliver steady, regulatory-driven replacement demand in 2024 as jurisdictions tighten building rules under the EPBD and local codes; scope is well-defined and competition narrows once specifications are set. Margins remain strong from technical expertise rather than market hype. Standardized surveys and kitted parts cut onsite time and cost.
- Regulatory demand: 2024-driven
- Known scopes, limited bidders
- Expertise-based margins
- Standardized surveys & kitted parts
Spares and panel refurbishment
Spares and panel refurbishment underpin legacy-asset support and deliver steady volumes; 2024 industry data shows aftermarket spares account for roughly 40% of total service revenue with low market growth (~1–3% CAGR), generating reliable cash and limited capex requirements. Customers pay premiums for speed and availability, and firms maintain 3–6 months of critical inventory to preserve uptime and command 15–25% premium pricing.
- Role: Essential support for legacy assets
- Revenue mix: ~40% of service revenue (2024)
- Growth: Low (~1–3% CAGR)
- Margin/cash: Reliable, limited capex, spare margins ~25%
- Inventory: 3–6 months held
- Pricing: 15–25% premium for uptime
Stable cash cows: high-margin services, low growth—optimize utilization & inventory
R&S Group cash cows are stable, high-utility services—residential/SME installs, catalog panels, PM contracts, retrofits and spares—that produce steady cash with low growth but strong margins (25–60%) and high referral lead share. Efficiency in routing, procurement, kitted parts and volume buys (5–12% discounts) maximizes free cash flow. Focus on utilization, churn <5% for PMs and 3–6 months critical inventory to preserve uptime.
| Metric | 2024 Value |
|---|---|
| Residential lead share | >70% |
| Gross margins | 25–60% |
| Catalog panel margin | ~28% |
| Service growth CAGR | 1–3% |
| PM churn | <5% |
| Spares revenue | ~40% |
| Inventory | 3–6 months |
What You’re Viewing Is Included
R&S Group BCG Matrix
The file you’re previewing here is the exact R&S Group BCG Matrix report you’ll receive after purchase — no watermarks, no demo notes, just the finished, professionally formatted document. It’s built for strategic clarity and ready to plug into your planning, decks, or client meetings. After checkout you’ll get the full file immediately, editable and print-ready. No surprises, just a market-tested tool you can use right away.

Unlock Strategic Clarity
The R&S Group BCG Matrix snapshot shows who’s winning, who’s draining cash, and where opportunity hides — but it’s just the tip of the iceberg. Want quadrant-level clarity, prioritized actions, and numbers you can take to the board? Purchase the full BCG Matrix for a ready-to-use Word report plus an Excel summary with clear recommendations so you can decide where to invest, divest, or double down. Get it and skip the guesswork.
Stars
Utility‑grade switchgear programs
Utility‑grade switchgear programs are Stars: they hold high market share with utilities and industrial plants and lead bids and specs, pulling substantial follow‑on work. IEA reported global electricity demand rose 2.4% in 2023, supporting 2024 grid expansion and sustained demand for switchgear. Projects consume working capital during build but repay through reputation and repeat orders; keep investing in capacity and delivery speed to retain the lead.
Industrial automation & control systems
Industrial automation & control systems sit in the Stars quadrant as factory and logistics automation demand accelerates, with the global industrial automation market topping an estimated 250 billion USD in 2024 and ~7% CAGR. R&S leverages a strong install base and a sticky service tail, yielding high visibility but current engineering and commissioning keep cash in roughly matching cash out. Prioritize talent and strategic integrator partnerships to convert high growth into sustainable margin expansion.
Renewables substation & grid‑connection packages
Wind, solar and storage projects require turnkey protection and control systems delivered fast, and R&S solutions are frequently specified early, securing share advantage in the hot renewables market. Long development cycles consume cash, yet R&S reports a strong, high‑quality pipeline and recurring demand underpinned by framework agreements. Standardized kits and secure contracts enable rapid scaling and margin protection.
Smart building electrical fit‑outs (tier‑A commercial)
Premium offices, hospitals and data centers accelerated intelligent power/control upgrades in 2024; sector growth runs near a 10% CAGR (2024–30) as clients pay for reliability. R&S wins on quality and end‑to‑end delivery, securing a leading share in a growing tier‑A fit‑out niche. Heavy coordination keeps margins tight; invest in BIM/DFMA and site leadership to lock position.
- Premium segment focus
- End‑to‑end delivery advantage
- 10% CAGR (2024–30)
- BIM/DFMA + site leaders = moat
Medium‑voltage switchgear modernization
Medium‑voltage switchgear modernization sits as a Star in R&S Group’s BCG matrix: 2024 reliability mandates are accelerating fleet replacements, and R&S’s engineered replacements lead spec lists and approvals. Growth is strong while project cash needs remain elevated until customer acceptance; securing vendor slots and pre‑engineered variants speeds throughput and margin conversion.
- 2024 regulatory uptick
- Spec & approval leadership
- High project cash burn
- Secure vendor slots
- Pre‑engineered variants
Prioritize capacity, pre-eng kits, BIM/DFMA, commissioning to capture 2024 growth
Stars: utility switchgear, industrial automation, renewables, premium fit-outs and MV modernization all show high share and double‑digit/strong growth in 2024 (IEA electricity +2.4% in 2023; industrial automation ~250bn USD in 2024, ~7% CAGR; premium fit‑outs ~10% CAGR 2024–30). Projects consume cash during delivery; prioritize capacity, pre‑engineered kits, BIM/DFMA and commissioning skills to convert growth to margin.
| Segment | 2024 KPI | Growth | Cash burn | Priority |
|---|---|---|---|---|
| Utility switchgear | High share | Stable+ | High | Capacity |
| Industrial automation | 250bn USD | ~7% CAGR | Neutral | Talent |
| Renewables | Strong pipeline | High | High | Standard kits |
| Premium fit‑outs | Tier‑A lead | ~10% CAGR | Moderate | BIM/DFMA |
| MV modernization | Regulatory uptick 2024 | High | High | Pre‑engines |
What is included in the product
Detailed Word Document
In-depth review of R&S Group's products across BCG quadrants, with clear investment, hold, or divest guidance and trend context.
Customizable Excel Spreadsheet
One-page BCG Matrix that maps R&S units to prioritize resources—quick, printable, C‑suite ready.
Cash Cows
Residential & SME electrical installations
Residential & SME electrical installations sit in a mature market with stable demand and high local brand recall, driving over 70% of leads via referrals. Standard scopes and predictable crews deliver solid gross margins around 25–30% when scheduling and routing are optimized. Low promotional spend needed; service repeatability makes this a cash-milk segment. Prioritize routing and procurement efficiencies to maximize steady cash flow.
Standard low‑voltage switchboards
Standard low‑voltage switchboards are R&S Group’s core catalog panels with repeatable designs and short lead times (typically 2–3 weeks), delivering high utilization and an estimated gross margin near 28% on catalog SKUs. They occupy a high share in a slow‑growth segment (approx. 1–3% CAGR) and are efficient to produce with low engineering drag. Tight yields (target ≤2% scrap) and negotiated volume buys (discounts 5–12%) widen contribution.
Preventive maintenance contracts
Preventive maintenance contracts deliver recurring revenue across the installed base, typically accounting for over 70% of service income with churn under 5%. They are mature, low-growth but high gross-margin (around 60%) offerings with minimal selling cost once landed. Expanding coverage and using remote checklists can improve cash conversion by 10–20%.
Retrofit & compliance upgrades
Retrofit & compliance upgrades deliver steady, regulatory-driven replacement demand in 2024 as jurisdictions tighten building rules under the EPBD and local codes; scope is well-defined and competition narrows once specifications are set. Margins remain strong from technical expertise rather than market hype. Standardized surveys and kitted parts cut onsite time and cost.
- Regulatory demand: 2024-driven
- Known scopes, limited bidders
- Expertise-based margins
- Standardized surveys & kitted parts
Spares and panel refurbishment
Spares and panel refurbishment underpin legacy-asset support and deliver steady volumes; 2024 industry data shows aftermarket spares account for roughly 40% of total service revenue with low market growth (~1–3% CAGR), generating reliable cash and limited capex requirements. Customers pay premiums for speed and availability, and firms maintain 3–6 months of critical inventory to preserve uptime and command 15–25% premium pricing.
- Role: Essential support for legacy assets
- Revenue mix: ~40% of service revenue (2024)
- Growth: Low (~1–3% CAGR)
- Margin/cash: Reliable, limited capex, spare margins ~25%
- Inventory: 3–6 months held
- Pricing: 15–25% premium for uptime
Stable cash cows: high-margin services, low growth—optimize utilization & inventory
R&S Group cash cows are stable, high-utility services—residential/SME installs, catalog panels, PM contracts, retrofits and spares—that produce steady cash with low growth but strong margins (25–60%) and high referral lead share. Efficiency in routing, procurement, kitted parts and volume buys (5–12% discounts) maximizes free cash flow. Focus on utilization, churn <5% for PMs and 3–6 months critical inventory to preserve uptime.
| Metric | 2024 Value |
|---|---|
| Residential lead share | >70% |
| Gross margins | 25–60% |
| Catalog panel margin | ~28% |
| Service growth CAGR | 1–3% |
| PM churn | <5% |
| Spares revenue | ~40% |
| Inventory | 3–6 months |
What You’re Viewing Is Included
R&S Group BCG Matrix
The file you’re previewing here is the exact R&S Group BCG Matrix report you’ll receive after purchase — no watermarks, no demo notes, just the finished, professionally formatted document. It’s built for strategic clarity and ready to plug into your planning, decks, or client meetings. After checkout you’ll get the full file immediately, editable and print-ready. No surprises, just a market-tested tool you can use right away.
Description
Unlock Strategic Clarity
The R&S Group BCG Matrix snapshot shows who’s winning, who’s draining cash, and where opportunity hides — but it’s just the tip of the iceberg. Want quadrant-level clarity, prioritized actions, and numbers you can take to the board? Purchase the full BCG Matrix for a ready-to-use Word report plus an Excel summary with clear recommendations so you can decide where to invest, divest, or double down. Get it and skip the guesswork.
Stars
Utility‑grade switchgear programs
Utility‑grade switchgear programs are Stars: they hold high market share with utilities and industrial plants and lead bids and specs, pulling substantial follow‑on work. IEA reported global electricity demand rose 2.4% in 2023, supporting 2024 grid expansion and sustained demand for switchgear. Projects consume working capital during build but repay through reputation and repeat orders; keep investing in capacity and delivery speed to retain the lead.
Industrial automation & control systems
Industrial automation & control systems sit in the Stars quadrant as factory and logistics automation demand accelerates, with the global industrial automation market topping an estimated 250 billion USD in 2024 and ~7% CAGR. R&S leverages a strong install base and a sticky service tail, yielding high visibility but current engineering and commissioning keep cash in roughly matching cash out. Prioritize talent and strategic integrator partnerships to convert high growth into sustainable margin expansion.
Renewables substation & grid‑connection packages
Wind, solar and storage projects require turnkey protection and control systems delivered fast, and R&S solutions are frequently specified early, securing share advantage in the hot renewables market. Long development cycles consume cash, yet R&S reports a strong, high‑quality pipeline and recurring demand underpinned by framework agreements. Standardized kits and secure contracts enable rapid scaling and margin protection.
Smart building electrical fit‑outs (tier‑A commercial)
Premium offices, hospitals and data centers accelerated intelligent power/control upgrades in 2024; sector growth runs near a 10% CAGR (2024–30) as clients pay for reliability. R&S wins on quality and end‑to‑end delivery, securing a leading share in a growing tier‑A fit‑out niche. Heavy coordination keeps margins tight; invest in BIM/DFMA and site leadership to lock position.
- Premium segment focus
- End‑to‑end delivery advantage
- 10% CAGR (2024–30)
- BIM/DFMA + site leaders = moat
Medium‑voltage switchgear modernization
Medium‑voltage switchgear modernization sits as a Star in R&S Group’s BCG matrix: 2024 reliability mandates are accelerating fleet replacements, and R&S’s engineered replacements lead spec lists and approvals. Growth is strong while project cash needs remain elevated until customer acceptance; securing vendor slots and pre‑engineered variants speeds throughput and margin conversion.
- 2024 regulatory uptick
- Spec & approval leadership
- High project cash burn
- Secure vendor slots
- Pre‑engineered variants
Prioritize capacity, pre-eng kits, BIM/DFMA, commissioning to capture 2024 growth
Stars: utility switchgear, industrial automation, renewables, premium fit-outs and MV modernization all show high share and double‑digit/strong growth in 2024 (IEA electricity +2.4% in 2023; industrial automation ~250bn USD in 2024, ~7% CAGR; premium fit‑outs ~10% CAGR 2024–30). Projects consume cash during delivery; prioritize capacity, pre‑engineered kits, BIM/DFMA and commissioning skills to convert growth to margin.
| Segment | 2024 KPI | Growth | Cash burn | Priority |
|---|---|---|---|---|
| Utility switchgear | High share | Stable+ | High | Capacity |
| Industrial automation | 250bn USD | ~7% CAGR | Neutral | Talent |
| Renewables | Strong pipeline | High | High | Standard kits |
| Premium fit‑outs | Tier‑A lead | ~10% CAGR | Moderate | BIM/DFMA |
| MV modernization | Regulatory uptick 2024 | High | High | Pre‑engines |
What is included in the product
Detailed Word Document
In-depth review of R&S Group's products across BCG quadrants, with clear investment, hold, or divest guidance and trend context.
Customizable Excel Spreadsheet
One-page BCG Matrix that maps R&S units to prioritize resources—quick, printable, C‑suite ready.
Cash Cows
Residential & SME electrical installations
Residential & SME electrical installations sit in a mature market with stable demand and high local brand recall, driving over 70% of leads via referrals. Standard scopes and predictable crews deliver solid gross margins around 25–30% when scheduling and routing are optimized. Low promotional spend needed; service repeatability makes this a cash-milk segment. Prioritize routing and procurement efficiencies to maximize steady cash flow.
Standard low‑voltage switchboards
Standard low‑voltage switchboards are R&S Group’s core catalog panels with repeatable designs and short lead times (typically 2–3 weeks), delivering high utilization and an estimated gross margin near 28% on catalog SKUs. They occupy a high share in a slow‑growth segment (approx. 1–3% CAGR) and are efficient to produce with low engineering drag. Tight yields (target ≤2% scrap) and negotiated volume buys (discounts 5–12%) widen contribution.
Preventive maintenance contracts
Preventive maintenance contracts deliver recurring revenue across the installed base, typically accounting for over 70% of service income with churn under 5%. They are mature, low-growth but high gross-margin (around 60%) offerings with minimal selling cost once landed. Expanding coverage and using remote checklists can improve cash conversion by 10–20%.
Retrofit & compliance upgrades
Retrofit & compliance upgrades deliver steady, regulatory-driven replacement demand in 2024 as jurisdictions tighten building rules under the EPBD and local codes; scope is well-defined and competition narrows once specifications are set. Margins remain strong from technical expertise rather than market hype. Standardized surveys and kitted parts cut onsite time and cost.
- Regulatory demand: 2024-driven
- Known scopes, limited bidders
- Expertise-based margins
- Standardized surveys & kitted parts
Spares and panel refurbishment
Spares and panel refurbishment underpin legacy-asset support and deliver steady volumes; 2024 industry data shows aftermarket spares account for roughly 40% of total service revenue with low market growth (~1–3% CAGR), generating reliable cash and limited capex requirements. Customers pay premiums for speed and availability, and firms maintain 3–6 months of critical inventory to preserve uptime and command 15–25% premium pricing.
- Role: Essential support for legacy assets
- Revenue mix: ~40% of service revenue (2024)
- Growth: Low (~1–3% CAGR)
- Margin/cash: Reliable, limited capex, spare margins ~25%
- Inventory: 3–6 months held
- Pricing: 15–25% premium for uptime
Stable cash cows: high-margin services, low growth—optimize utilization & inventory
R&S Group cash cows are stable, high-utility services—residential/SME installs, catalog panels, PM contracts, retrofits and spares—that produce steady cash with low growth but strong margins (25–60%) and high referral lead share. Efficiency in routing, procurement, kitted parts and volume buys (5–12% discounts) maximizes free cash flow. Focus on utilization, churn <5% for PMs and 3–6 months critical inventory to preserve uptime.
| Metric | 2024 Value |
|---|---|
| Residential lead share | >70% |
| Gross margins | 25–60% |
| Catalog panel margin | ~28% |
| Service growth CAGR | 1–3% |
| PM churn | <5% |
| Spares revenue | ~40% |
| Inventory | 3–6 months |
What You’re Viewing Is Included
R&S Group BCG Matrix
The file you’re previewing here is the exact R&S Group BCG Matrix report you’ll receive after purchase — no watermarks, no demo notes, just the finished, professionally formatted document. It’s built for strategic clarity and ready to plug into your planning, decks, or client meetings. After checkout you’ll get the full file immediately, editable and print-ready. No surprises, just a market-tested tool you can use right away.











