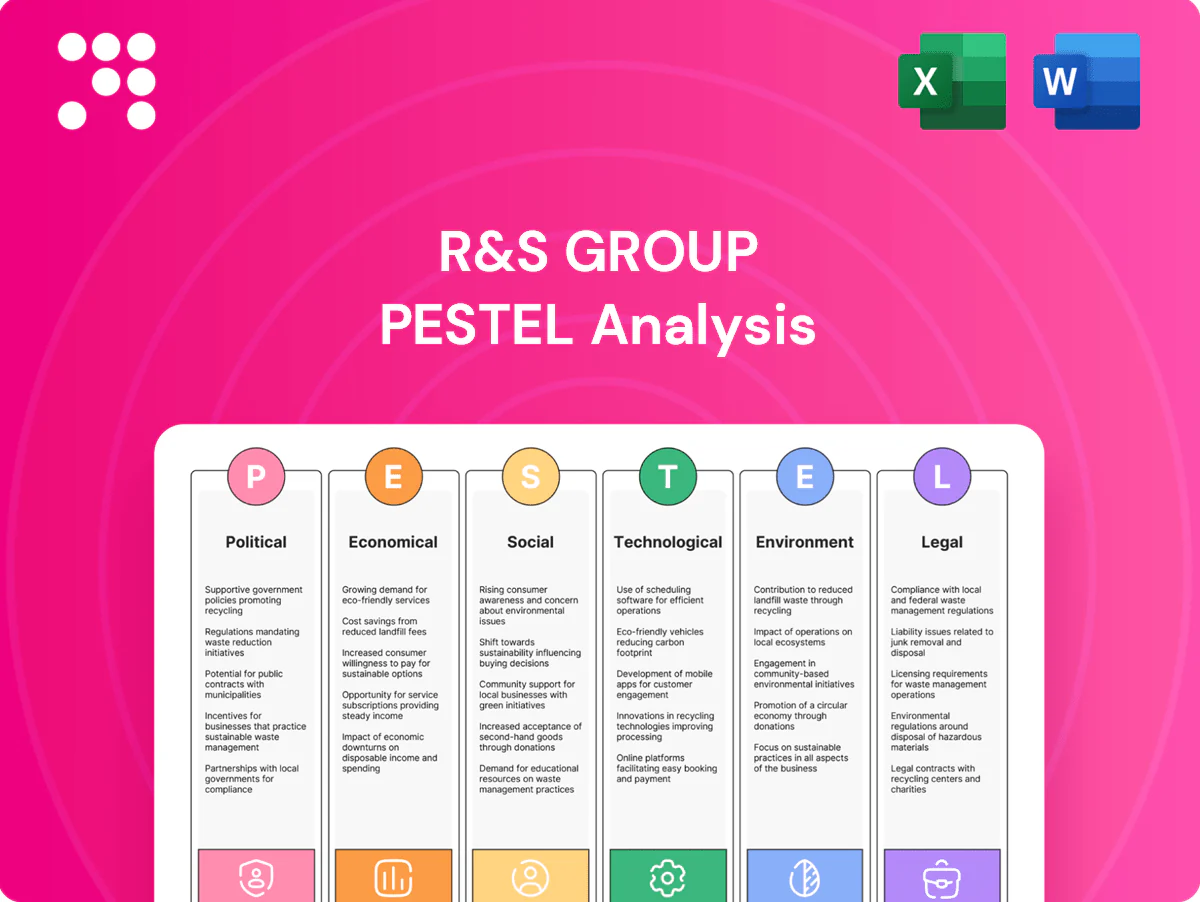
R&S Group PESTLE Analysis

Your Shortcut to Market Insight Starts Here
Uncover how political shifts, economic cycles, social trends, and technological change are shaping R&S Group’s strategic outlook in our concise PESTLE snapshot. This ready-made analysis helps investors and planners spot risks and growth levers. Purchase the full report to access the complete, editable breakdown and actionable recommendations instantly.
Political factors

Energy transition policies
EU Fit for 55 (55% GHG cut by 2030) and the US Inflation Reduction Act (about $369bn in clean-energy incentives) plus China’s carbon-neutrality by 2060 target are accelerating demand for switchgear, automation and grid modernization. Incentives for renewables, heat pumps and EV charging expand installation volumes across utilities and commercial sectors. Changes in subsidy timelines can rapidly shift project pipelines, so R&S should align product roadmaps to public programs to secure funded contracts.
Public infrastructure spending
National and municipal budgets drive tender volumes for transport, hospitals, schools and utilities; major programs such as the EU NextGenerationEU fund (€723.8bn) and the US Infrastructure Investment and Jobs Act ($1.2tr) underpin procurement pipelines. Multiyear capital plans (commonly 3–10 years) give visibility but remain vulnerable to election cycles and fiscal tightening; shifts from new builds to retrofits change product mix and margins, and strong prequalification plus local relationships materially boost tender win rates.

Trade and tariff dynamics
Tariffs such as US 25% on steel and 10% on aluminum and rising duties on electronic parts have pushed BOM costs for switchgear and panels, with firms reporting input-cost increases of roughly 8–15% since 2020.
Trade disputes and sanctions that contributed to the 2020–22 semiconductor shortage—estimated $210 billion in lost auto revenue—can similarly disrupt critical part supplies for automation panels.
Diversified sourcing and nearshoring, which can cut lead times ~30–50%, and transparent cost-pass-through clauses help mitigate tariff exposure and preserve margins.

Regulatory harmonization and standards
EU regulatory harmonization across 27 member states and 24,000+ ISO/IEC standards (2024) shape R&S design, testing and certification workflows; convergence unlocks cross-border scalability while divergence forces costly customization and recertification. Active participation in standards committees helps anticipate new requirements, and early compliance can be a decisive differentiator in competitive bids.
- Regulatory scope: 27 EU states
- Standards base: 24,000+ ISO/IEC (2024)
- Benefit: faster market entry with aligned standards
Geopolitical supply-chain risk
Conflicts and logistics bottlenecks have stretched lead times for transformers, relays and PLCs by an estimated 20–40% during 2022–24, raising project risk and working-capital needs. Energy-price shocks and export controls in 2022–24 pushed firms to lengthen lead-time buffers and increase inventory spending. R&S uses scenario planning and safety stocks for critical projects and dual-sources key SKUs to sustain service levels.
- lead-time rise 20–40%
- safety stocks for critical projects
- dual-source key SKUs
- inventory buffers after 2022–24 shocks
Net-zero policies and fiscal packages spur EV charging, switchgear and grid upgrades
Policy drivers—EU Fit for 55, US IRA ($369bn) and China 2060 net-zero—are accelerating demand for switchgear, EV charging and grid upgrades; subsidy timing shifts project pipelines. Fiscal programs (NextGenerationEU €723.8bn, US IIJA $1.2tr) and tariffs (US steel 25%) reshape tender volumes, costs and sourcing. Lead times rose ~20–40% (2022–24); nearshoring and dual-sourcing cut risks.
| Policy | Key figure |
|---|---|
| US IRA | $369bn |
| EU NextGenerationEU | €723.8bn |
| US IIJA | $1.2tr |
| Steel tariff | 25% |
| Lead-time rise | 20–40% |
| ISO/IEC standards | 24,000+ |
What is included in the product
 Detailed Word Document
Analyzes how Political, Economic, Social, Technological, Environmental and Legal forces uniquely impact R&S Group, combining data-driven trends and region-specific regulatory insights; designed for executives, investors and advisors with forward-looking scenarios and ready-to-use findings for plans, pitches and risk mitigation.

 Customizable Excel Spreadsheet
A concise, visually segmented PESTLE summary for R&S Group that’s easy to drop into presentations, share across teams, and annotate with region-specific notes, enabling rapid alignment on external risks and strategic positioning during planning sessions.
Economic factors

Construction and industrial cycles
Residential, commercial and industrial CAPEX cycles directly drive installation backlogs: slowdowns compress pricing and margins while upcycles push capacity and supply-chain constraints, raising lead times. Diversification across end-markets smooths revenue volatility, and long-term framework agreements lock in volumes to stabilize utilization and cashflow.
Interest rates and financing
Higher policy rates (US effective fed funds ~5.3% mid‑2025) defer customer projects and raise R&S Group’s WACC, compressing NPV on new investments. Payment terms shorten and working‑capital needs rise in restrictive cycles, with DSO/DSO-like pressure reported industrywide. Phased deliveries and embedded financing preserve deal flow; hedging interest exposure (caps/swaps) protects margins and cashflow.

Commodity and energy costs
Copper, aluminium and steel swings (metals moved roughly 10–25% y/y through 2023–24) materially shift switchgear and cabling costs, pressuring margins and capex estimates. Elevated energy costs raise plant operating expenses and lengthen customers’ payback on efficiency upgrades. Index-linked supply contracts have reduced margin erosion for R&S; value engineering and product standardization further blunt input-price volatility.

Labor availability and wage inflation
Skilled electricians, panel builders and automation engineers remain scarce, driving wage inflation of roughly 4.5% in 2024 and squeezing project margins and bid competitiveness. Apprenticeships and productivity tools have cut labour-hour growth by up to 10% on flagship projects, while selective outsourcing smooths demand peaks without losing core capability.
- Skill shortage: high
- Wage inflation: ~4.5% (2024)
- Productivity gains: ~10%
- Outsourcing: selective
Currency fluctuations
Currency fluctuations materially affect R&S Group through higher costs for imported components and volatile cross-border sales; global FX daily turnover reached $7.5 trillion in 2022 (BIS), reflecting market size and volatility. Misalignment between cost and revenue currencies squeezes margins, so natural hedging and forward contracts are used to reduce variance while multi-currency pricing and supplier agreements add resilience.
- FX market size: $7.5T/day (BIS 2022)
- Hedging: forwards + natural hedges lower P/L volatility
- Multi-currency pricing improves revenue matching
- Supplier FX clauses mitigate input-cost shocks
Net-zero policies and fiscal packages spur EV charging, switchgear and grid upgrades
Macro cycles, CAPEX timing and input-price swings (copper/steel ±10–25% 2023–24) drive R&S revenues, margins and lead times. Policy rates (~5.3% US mid‑2025) raise WACC, slow projects and heighten working‑capital needs. Labour shortages pushed wages ~4.5% in 2024; productivity gains ~10% on flagship projects. FX volatility and hedging shape margin resilience.
| Metric | Value |
|---|---|
| US policy rate (mid‑2025) | ~5.3% |
| Copper/steel move 2023–24 | ±10–25% |
| Wage inflation (2024) | ~4.5% |
| Productivity gains | ~10% |
| FX daily turnover (2022) | $7.5T |
Full Version Awaits
R&S Group PESTLE Analysis
The preview shown here is the exact R&S Group PESTLE Analysis you’ll receive after purchase—fully formatted and ready to use. It contains the complete political, economic, social, technological, legal and environmental assessment as displayed, with no placeholders or missing sections. After checkout you’ll download this same professional, final document instantly.

Your Shortcut to Market Insight Starts Here
Uncover how political shifts, economic cycles, social trends, and technological change are shaping R&S Group’s strategic outlook in our concise PESTLE snapshot. This ready-made analysis helps investors and planners spot risks and growth levers. Purchase the full report to access the complete, editable breakdown and actionable recommendations instantly.
Political factors
Energy transition policies
EU Fit for 55 (55% GHG cut by 2030) and the US Inflation Reduction Act (about $369bn in clean-energy incentives) plus China’s carbon-neutrality by 2060 target are accelerating demand for switchgear, automation and grid modernization. Incentives for renewables, heat pumps and EV charging expand installation volumes across utilities and commercial sectors. Changes in subsidy timelines can rapidly shift project pipelines, so R&S should align product roadmaps to public programs to secure funded contracts.
Public infrastructure spending
National and municipal budgets drive tender volumes for transport, hospitals, schools and utilities; major programs such as the EU NextGenerationEU fund (€723.8bn) and the US Infrastructure Investment and Jobs Act ($1.2tr) underpin procurement pipelines. Multiyear capital plans (commonly 3–10 years) give visibility but remain vulnerable to election cycles and fiscal tightening; shifts from new builds to retrofits change product mix and margins, and strong prequalification plus local relationships materially boost tender win rates.
Trade and tariff dynamics
Tariffs such as US 25% on steel and 10% on aluminum and rising duties on electronic parts have pushed BOM costs for switchgear and panels, with firms reporting input-cost increases of roughly 8–15% since 2020.
Trade disputes and sanctions that contributed to the 2020–22 semiconductor shortage—estimated $210 billion in lost auto revenue—can similarly disrupt critical part supplies for automation panels.
Diversified sourcing and nearshoring, which can cut lead times ~30–50%, and transparent cost-pass-through clauses help mitigate tariff exposure and preserve margins.
Regulatory harmonization and standards
EU regulatory harmonization across 27 member states and 24,000+ ISO/IEC standards (2024) shape R&S design, testing and certification workflows; convergence unlocks cross-border scalability while divergence forces costly customization and recertification. Active participation in standards committees helps anticipate new requirements, and early compliance can be a decisive differentiator in competitive bids.
- Regulatory scope: 27 EU states
- Standards base: 24,000+ ISO/IEC (2024)
- Benefit: faster market entry with aligned standards
Geopolitical supply-chain risk
Conflicts and logistics bottlenecks have stretched lead times for transformers, relays and PLCs by an estimated 20–40% during 2022–24, raising project risk and working-capital needs. Energy-price shocks and export controls in 2022–24 pushed firms to lengthen lead-time buffers and increase inventory spending. R&S uses scenario planning and safety stocks for critical projects and dual-sources key SKUs to sustain service levels.
- lead-time rise 20–40%
- safety stocks for critical projects
- dual-source key SKUs
- inventory buffers after 2022–24 shocks
Net-zero policies and fiscal packages spur EV charging, switchgear and grid upgrades
Policy drivers—EU Fit for 55, US IRA ($369bn) and China 2060 net-zero—are accelerating demand for switchgear, EV charging and grid upgrades; subsidy timing shifts project pipelines. Fiscal programs (NextGenerationEU €723.8bn, US IIJA $1.2tr) and tariffs (US steel 25%) reshape tender volumes, costs and sourcing. Lead times rose ~20–40% (2022–24); nearshoring and dual-sourcing cut risks.
| Policy | Key figure |
|---|---|
| US IRA | $369bn |
| EU NextGenerationEU | €723.8bn |
| US IIJA | $1.2tr |
| Steel tariff | 25% |
| Lead-time rise | 20–40% |
| ISO/IEC standards | 24,000+ |
What is included in the product
Detailed Word Document
Analyzes how Political, Economic, Social, Technological, Environmental and Legal forces uniquely impact R&S Group, combining data-driven trends and region-specific regulatory insights; designed for executives, investors and advisors with forward-looking scenarios and ready-to-use findings for plans, pitches and risk mitigation.
Customizable Excel Spreadsheet
A concise, visually segmented PESTLE summary for R&S Group that’s easy to drop into presentations, share across teams, and annotate with region-specific notes, enabling rapid alignment on external risks and strategic positioning during planning sessions.
Economic factors
Construction and industrial cycles
Residential, commercial and industrial CAPEX cycles directly drive installation backlogs: slowdowns compress pricing and margins while upcycles push capacity and supply-chain constraints, raising lead times. Diversification across end-markets smooths revenue volatility, and long-term framework agreements lock in volumes to stabilize utilization and cashflow.
Interest rates and financing
Higher policy rates (US effective fed funds ~5.3% mid‑2025) defer customer projects and raise R&S Group’s WACC, compressing NPV on new investments. Payment terms shorten and working‑capital needs rise in restrictive cycles, with DSO/DSO-like pressure reported industrywide. Phased deliveries and embedded financing preserve deal flow; hedging interest exposure (caps/swaps) protects margins and cashflow.
Commodity and energy costs
Copper, aluminium and steel swings (metals moved roughly 10–25% y/y through 2023–24) materially shift switchgear and cabling costs, pressuring margins and capex estimates. Elevated energy costs raise plant operating expenses and lengthen customers’ payback on efficiency upgrades. Index-linked supply contracts have reduced margin erosion for R&S; value engineering and product standardization further blunt input-price volatility.
Labor availability and wage inflation
Skilled electricians, panel builders and automation engineers remain scarce, driving wage inflation of roughly 4.5% in 2024 and squeezing project margins and bid competitiveness. Apprenticeships and productivity tools have cut labour-hour growth by up to 10% on flagship projects, while selective outsourcing smooths demand peaks without losing core capability.
- Skill shortage: high
- Wage inflation: ~4.5% (2024)
- Productivity gains: ~10%
- Outsourcing: selective
Currency fluctuations
Currency fluctuations materially affect R&S Group through higher costs for imported components and volatile cross-border sales; global FX daily turnover reached $7.5 trillion in 2022 (BIS), reflecting market size and volatility. Misalignment between cost and revenue currencies squeezes margins, so natural hedging and forward contracts are used to reduce variance while multi-currency pricing and supplier agreements add resilience.
- FX market size: $7.5T/day (BIS 2022)
- Hedging: forwards + natural hedges lower P/L volatility
- Multi-currency pricing improves revenue matching
- Supplier FX clauses mitigate input-cost shocks
Net-zero policies and fiscal packages spur EV charging, switchgear and grid upgrades
Macro cycles, CAPEX timing and input-price swings (copper/steel ±10–25% 2023–24) drive R&S revenues, margins and lead times. Policy rates (~5.3% US mid‑2025) raise WACC, slow projects and heighten working‑capital needs. Labour shortages pushed wages ~4.5% in 2024; productivity gains ~10% on flagship projects. FX volatility and hedging shape margin resilience.
| Metric | Value |
|---|---|
| US policy rate (mid‑2025) | ~5.3% |
| Copper/steel move 2023–24 | ±10–25% |
| Wage inflation (2024) | ~4.5% |
| Productivity gains | ~10% |
| FX daily turnover (2022) | $7.5T |
Full Version Awaits
R&S Group PESTLE Analysis
The preview shown here is the exact R&S Group PESTLE Analysis you’ll receive after purchase—fully formatted and ready to use. It contains the complete political, economic, social, technological, legal and environmental assessment as displayed, with no placeholders or missing sections. After checkout you’ll download this same professional, final document instantly.
Description
Your Shortcut to Market Insight Starts Here
Uncover how political shifts, economic cycles, social trends, and technological change are shaping R&S Group’s strategic outlook in our concise PESTLE snapshot. This ready-made analysis helps investors and planners spot risks and growth levers. Purchase the full report to access the complete, editable breakdown and actionable recommendations instantly.
Political factors
Energy transition policies
EU Fit for 55 (55% GHG cut by 2030) and the US Inflation Reduction Act (about $369bn in clean-energy incentives) plus China’s carbon-neutrality by 2060 target are accelerating demand for switchgear, automation and grid modernization. Incentives for renewables, heat pumps and EV charging expand installation volumes across utilities and commercial sectors. Changes in subsidy timelines can rapidly shift project pipelines, so R&S should align product roadmaps to public programs to secure funded contracts.
Public infrastructure spending
National and municipal budgets drive tender volumes for transport, hospitals, schools and utilities; major programs such as the EU NextGenerationEU fund (€723.8bn) and the US Infrastructure Investment and Jobs Act ($1.2tr) underpin procurement pipelines. Multiyear capital plans (commonly 3–10 years) give visibility but remain vulnerable to election cycles and fiscal tightening; shifts from new builds to retrofits change product mix and margins, and strong prequalification plus local relationships materially boost tender win rates.
Trade and tariff dynamics
Tariffs such as US 25% on steel and 10% on aluminum and rising duties on electronic parts have pushed BOM costs for switchgear and panels, with firms reporting input-cost increases of roughly 8–15% since 2020.
Trade disputes and sanctions that contributed to the 2020–22 semiconductor shortage—estimated $210 billion in lost auto revenue—can similarly disrupt critical part supplies for automation panels.
Diversified sourcing and nearshoring, which can cut lead times ~30–50%, and transparent cost-pass-through clauses help mitigate tariff exposure and preserve margins.
Regulatory harmonization and standards
EU regulatory harmonization across 27 member states and 24,000+ ISO/IEC standards (2024) shape R&S design, testing and certification workflows; convergence unlocks cross-border scalability while divergence forces costly customization and recertification. Active participation in standards committees helps anticipate new requirements, and early compliance can be a decisive differentiator in competitive bids.
- Regulatory scope: 27 EU states
- Standards base: 24,000+ ISO/IEC (2024)
- Benefit: faster market entry with aligned standards
Geopolitical supply-chain risk
Conflicts and logistics bottlenecks have stretched lead times for transformers, relays and PLCs by an estimated 20–40% during 2022–24, raising project risk and working-capital needs. Energy-price shocks and export controls in 2022–24 pushed firms to lengthen lead-time buffers and increase inventory spending. R&S uses scenario planning and safety stocks for critical projects and dual-sources key SKUs to sustain service levels.
- lead-time rise 20–40%
- safety stocks for critical projects
- dual-source key SKUs
- inventory buffers after 2022–24 shocks
Net-zero policies and fiscal packages spur EV charging, switchgear and grid upgrades
Policy drivers—EU Fit for 55, US IRA ($369bn) and China 2060 net-zero—are accelerating demand for switchgear, EV charging and grid upgrades; subsidy timing shifts project pipelines. Fiscal programs (NextGenerationEU €723.8bn, US IIJA $1.2tr) and tariffs (US steel 25%) reshape tender volumes, costs and sourcing. Lead times rose ~20–40% (2022–24); nearshoring and dual-sourcing cut risks.
| Policy | Key figure |
|---|---|
| US IRA | $369bn |
| EU NextGenerationEU | €723.8bn |
| US IIJA | $1.2tr |
| Steel tariff | 25% |
| Lead-time rise | 20–40% |
| ISO/IEC standards | 24,000+ |
What is included in the product
Detailed Word Document
Analyzes how Political, Economic, Social, Technological, Environmental and Legal forces uniquely impact R&S Group, combining data-driven trends and region-specific regulatory insights; designed for executives, investors and advisors with forward-looking scenarios and ready-to-use findings for plans, pitches and risk mitigation.
Customizable Excel Spreadsheet
A concise, visually segmented PESTLE summary for R&S Group that’s easy to drop into presentations, share across teams, and annotate with region-specific notes, enabling rapid alignment on external risks and strategic positioning during planning sessions.
Economic factors
Construction and industrial cycles
Residential, commercial and industrial CAPEX cycles directly drive installation backlogs: slowdowns compress pricing and margins while upcycles push capacity and supply-chain constraints, raising lead times. Diversification across end-markets smooths revenue volatility, and long-term framework agreements lock in volumes to stabilize utilization and cashflow.
Interest rates and financing
Higher policy rates (US effective fed funds ~5.3% mid‑2025) defer customer projects and raise R&S Group’s WACC, compressing NPV on new investments. Payment terms shorten and working‑capital needs rise in restrictive cycles, with DSO/DSO-like pressure reported industrywide. Phased deliveries and embedded financing preserve deal flow; hedging interest exposure (caps/swaps) protects margins and cashflow.
Commodity and energy costs
Copper, aluminium and steel swings (metals moved roughly 10–25% y/y through 2023–24) materially shift switchgear and cabling costs, pressuring margins and capex estimates. Elevated energy costs raise plant operating expenses and lengthen customers’ payback on efficiency upgrades. Index-linked supply contracts have reduced margin erosion for R&S; value engineering and product standardization further blunt input-price volatility.
Labor availability and wage inflation
Skilled electricians, panel builders and automation engineers remain scarce, driving wage inflation of roughly 4.5% in 2024 and squeezing project margins and bid competitiveness. Apprenticeships and productivity tools have cut labour-hour growth by up to 10% on flagship projects, while selective outsourcing smooths demand peaks without losing core capability.
- Skill shortage: high
- Wage inflation: ~4.5% (2024)
- Productivity gains: ~10%
- Outsourcing: selective
Currency fluctuations
Currency fluctuations materially affect R&S Group through higher costs for imported components and volatile cross-border sales; global FX daily turnover reached $7.5 trillion in 2022 (BIS), reflecting market size and volatility. Misalignment between cost and revenue currencies squeezes margins, so natural hedging and forward contracts are used to reduce variance while multi-currency pricing and supplier agreements add resilience.
- FX market size: $7.5T/day (BIS 2022)
- Hedging: forwards + natural hedges lower P/L volatility
- Multi-currency pricing improves revenue matching
- Supplier FX clauses mitigate input-cost shocks
Net-zero policies and fiscal packages spur EV charging, switchgear and grid upgrades
Macro cycles, CAPEX timing and input-price swings (copper/steel ±10–25% 2023–24) drive R&S revenues, margins and lead times. Policy rates (~5.3% US mid‑2025) raise WACC, slow projects and heighten working‑capital needs. Labour shortages pushed wages ~4.5% in 2024; productivity gains ~10% on flagship projects. FX volatility and hedging shape margin resilience.
| Metric | Value |
|---|---|
| US policy rate (mid‑2025) | ~5.3% |
| Copper/steel move 2023–24 | ±10–25% |
| Wage inflation (2024) | ~4.5% |
| Productivity gains | ~10% |
| FX daily turnover (2022) | $7.5T |
Full Version Awaits
R&S Group PESTLE Analysis
The preview shown here is the exact R&S Group PESTLE Analysis you’ll receive after purchase—fully formatted and ready to use. It contains the complete political, economic, social, technological, legal and environmental assessment as displayed, with no placeholders or missing sections. After checkout you’ll download this same professional, final document instantly.











