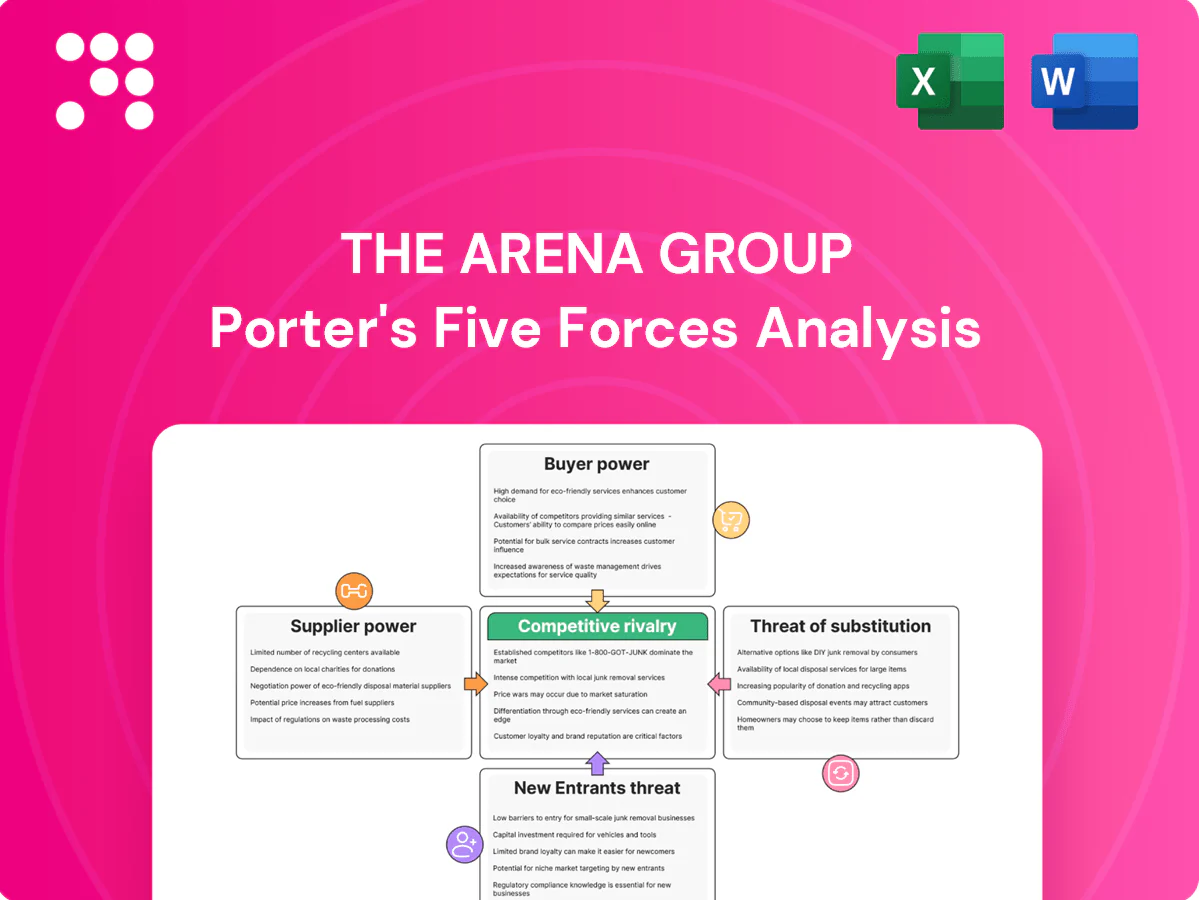
The Arena Group Porter's Five Forces Analysis

A Must-Have Tool for Decision-Makers
The Arena Group faces intense rivalry from diversified digital publishers and rising niche platforms, while buyer power and ad-platform dependence pressure margins; supplier and content-creation costs add variability to profit models. This brief snapshot only scratches the surface. Unlock the full Porter's Five Forces Analysis to explore The Arena Group’s competitive dynamics, market pressures, and strategic advantages in detail.
Suppliers Bargaining Power

Premium content licensors
Licensors of marquee brands, athlete IP and photo libraries—Getty Images alone catalogs over 415 million assets—increase content costs and compress margins for The Arena Group. The global sports media rights market was roughly $60 billion in 2023, and agencies restrict availability during peak events, driving up short-term fees. Dependence on exclusive or semi-exclusive assets raises switching costs and contract friction. Negotiation leverage spikes when content is time-sensitive or viral, enabling licensors to command premium rates.
Freelancers and creators
High-quality journalists, analysts, and on-air talent with strong followings can negotiate higher pay and exclusivity, raising supplier leverage for The Arena Group.
Competition for niche sports-analytics and entertainment scoops intensifies bargaining power as specialized contributors are scarce and command premium rates.
Platforms enabling the creator economy, valued at about $250 billion in 2024, provide alternatives and increase churn risk, though long-term contributor contracts can reduce pricing volatility.

Technology and ad-tech vendors
Cloud/CDN/CMS and ad-tech stacks are concentrated—AWS, Azure and GCP held about 67% of cloud market in 2024—creating clear supplier dependency for The Arena Group. Post-cookie, identity, measurement and brand-safety tools (eg LiveRamp-scale providers) become mission-critical, boosting vendor leverage. Integration complexity raises switching costs and operational risk, while volume commitments and multi-year contracts may secure discounts but limit flexibility.

Distribution gatekeepers
Search engines, social platforms and app stores function as quasi-suppliers of audience access: Google handles ~92% of global search queries (StatCounter 2024), Meta platforms dominate social referrals and app stores enforce standard revenue shares up to 30%, all of which can abruptly alter traffic and monetization through algorithm or policy shifts. Diversifying channels reduces single-gatekeeper exposure but cannot eliminate platform leverage.
Data and rights holders
Sports leagues, financial data providers and entertainment databases control essential feeds; timely, accurate data underpins TheStreet and sports coverage, making quality non-negotiable. Bloomberg terminal access cost roughly 27,000 USD/year in 2024, illustrating base data expense. Licensing often involves multi-year contracts and can spike around major seasons and earnings cycles.
- Data concentration: leagues and major vendors dominate feeds
- 2024 benchmark: Bloomberg terminal ~27,000 USD/year
- Cost dynamics: multi-year bundles lock spend
- Pricing pressure: spikes during seasons and earnings
Supplier concentration and expensive sports rights squeeze digital publisher margins
Licensors of brand/IP and time-sensitive sports rights (global market ~$60B in 2023) and scarce top talent raise content costs and switching barriers for The Arena Group. Concentrated cloud/CDN (67% AWS/Azure/GCP 2024), search (Google ~92% 2024) and app-store rules amplify supplier leverage. Data feeds and terminals (Bloomberg ~27,000 USD/year 2024) add recurring licensing pressure.
| Supplier | Metric |
|---|---|
| Getty | 415M assets |
| Sports rights | $60B (2023) |
| Cloud | 67% share (2024) |
| Search | Google 92% (2024) |
| Bloomberg | $27,000/yr (2024) |
What is included in the product
 Detailed Word Document
Concise Porter's Five Forces analysis of The Arena Group highlighting competitive rivalry, buyer and supplier power, threat of new entrants and substitutes, and the key disruptive forces shaping its digital media and publishing margins; actionable insights for strategy, investor materials, and internal planning.

 Customizable Excel Spreadsheet
One-sheet Porter's Five Forces for The Arena Group that translates competitive complexity into a clear, customizable spider chart—perfect for quick strategic decisions. Easy to edit, slide-ready and integrates with reports to relieve analyst workload and speed boardroom alignment.
Customers Bargaining Power

Advertisers and agencies
Advertisers and agencies wield strong leverage: programmatic purchasing now drives about 80% of display spend, enabling large buyers to use multi-publisher RFPs that compress CPMs. Brand buyers increasingly require viewability and attention metrics plus performance guarantees. Budget fluidity lets spend shift rapidly to social and CTV. Direct-sold, high-context placements still capture a 20–40% premium, partially defending pricing.
Programmatic intermediaries
DSPs and SSPs raise price transparency—programmatic accounted for about 86% of US digital display in 2024, boosting buyer leverage. Auction dynamics and header bidding, which can lift publisher yields roughly 10–20%, also compress sell-side margins by intensifying bid competition. Brand-safety filters and blocklists shrink eligible premium inventory, reducing high-value bid opportunities. Curated private marketplaces, representing roughly a quarter of programmatic spend, improve take rates via guaranteed packages.

Subscribers and members
Consumers face abundant free alternatives, increasing price sensitivity and elevating churn risk for The Arena Group unless content or product utility is exclusive; by 2024 global paid news subscriptions exceeded 500 million, intensifying competition for paid attention. Flexible monthly billing in most publishers empowers switching, while bundling and member-only experiences can reduce elasticity and improve retention.

Affiliates and commerce partners
- Commission range: 5–20% (2024)
- Attribution-linked renegotiation common
- Category cyclicality drives budget volatility
- Data transparency preserves premium CPMs
Enterprise and sponsorship buyers
Sponsors increasingly demand multi-property integrations and use scale to negotiate discounts; in 2024 buyers intensified demand for cross-property deals. Measurement expectations require custom reporting and guaranteed KPIs, raising implementation costs and bargaining leverage. Seasonality concentrates leverage around tentpole events, while tiered packages with category exclusivity help protect pricing and margins.
- Multi-property negotiation: scale discounts
- Custom reporting: KPI guarantees
- Seasonality: tentpole leverage
- Tiering: exclusivity to preserve price
Programmatic at 86% US display; direct premium secures 20–40% uplift
Buyers hold strong leverage: programmatic reached about 86% of US display in 2024, enabling multi-publisher RFPs and CPM compression. Direct-sold premium placements still command 20–40% uplift, partially insulating revenue. Affiliates negotiate 5–20% commission rates tied to attribution; private marketplaces ~25% of programmatic improve guaranteed take rates. Sponsors push cross-property deals and KPI guarantees, concentrating leverage around tentpole events.
| Metric | 2024 Value |
|---|---|
| Programmatic share | 86% US display |
| Direct-sold premium | 20–40% uplift |
| Paid news subs | 500M global |
| Affiliate commission | 5–20% |
| PMPs share | ~25% programmatic |
What You See Is What You Get
The Arena Group Porter's Five Forces Analysis
This preview shows the exact The Arena Group Porter's Five Forces Analysis you'll receive immediately after purchase—no surprises, no placeholders. The document displayed is fully formatted, professionally written, and ready for download and use the moment you buy. You're viewing the final deliverable; after payment you'll get instant access to this identical file.

A Must-Have Tool for Decision-Makers
The Arena Group faces intense rivalry from diversified digital publishers and rising niche platforms, while buyer power and ad-platform dependence pressure margins; supplier and content-creation costs add variability to profit models. This brief snapshot only scratches the surface. Unlock the full Porter's Five Forces Analysis to explore The Arena Group’s competitive dynamics, market pressures, and strategic advantages in detail.
Suppliers Bargaining Power
Premium content licensors
Licensors of marquee brands, athlete IP and photo libraries—Getty Images alone catalogs over 415 million assets—increase content costs and compress margins for The Arena Group. The global sports media rights market was roughly $60 billion in 2023, and agencies restrict availability during peak events, driving up short-term fees. Dependence on exclusive or semi-exclusive assets raises switching costs and contract friction. Negotiation leverage spikes when content is time-sensitive or viral, enabling licensors to command premium rates.
Freelancers and creators
High-quality journalists, analysts, and on-air talent with strong followings can negotiate higher pay and exclusivity, raising supplier leverage for The Arena Group.
Competition for niche sports-analytics and entertainment scoops intensifies bargaining power as specialized contributors are scarce and command premium rates.
Platforms enabling the creator economy, valued at about $250 billion in 2024, provide alternatives and increase churn risk, though long-term contributor contracts can reduce pricing volatility.
Technology and ad-tech vendors
Cloud/CDN/CMS and ad-tech stacks are concentrated—AWS, Azure and GCP held about 67% of cloud market in 2024—creating clear supplier dependency for The Arena Group. Post-cookie, identity, measurement and brand-safety tools (eg LiveRamp-scale providers) become mission-critical, boosting vendor leverage. Integration complexity raises switching costs and operational risk, while volume commitments and multi-year contracts may secure discounts but limit flexibility.
Distribution gatekeepers
Search engines, social platforms and app stores function as quasi-suppliers of audience access: Google handles ~92% of global search queries (StatCounter 2024), Meta platforms dominate social referrals and app stores enforce standard revenue shares up to 30%, all of which can abruptly alter traffic and monetization through algorithm or policy shifts. Diversifying channels reduces single-gatekeeper exposure but cannot eliminate platform leverage.
Data and rights holders
Sports leagues, financial data providers and entertainment databases control essential feeds; timely, accurate data underpins TheStreet and sports coverage, making quality non-negotiable. Bloomberg terminal access cost roughly 27,000 USD/year in 2024, illustrating base data expense. Licensing often involves multi-year contracts and can spike around major seasons and earnings cycles.
- Data concentration: leagues and major vendors dominate feeds
- 2024 benchmark: Bloomberg terminal ~27,000 USD/year
- Cost dynamics: multi-year bundles lock spend
- Pricing pressure: spikes during seasons and earnings
Supplier concentration and expensive sports rights squeeze digital publisher margins
Licensors of brand/IP and time-sensitive sports rights (global market ~$60B in 2023) and scarce top talent raise content costs and switching barriers for The Arena Group. Concentrated cloud/CDN (67% AWS/Azure/GCP 2024), search (Google ~92% 2024) and app-store rules amplify supplier leverage. Data feeds and terminals (Bloomberg ~27,000 USD/year 2024) add recurring licensing pressure.
| Supplier | Metric |
|---|---|
| Getty | 415M assets |
| Sports rights | $60B (2023) |
| Cloud | 67% share (2024) |
| Search | Google 92% (2024) |
| Bloomberg | $27,000/yr (2024) |
What is included in the product
Detailed Word Document
Concise Porter's Five Forces analysis of The Arena Group highlighting competitive rivalry, buyer and supplier power, threat of new entrants and substitutes, and the key disruptive forces shaping its digital media and publishing margins; actionable insights for strategy, investor materials, and internal planning.
Customizable Excel Spreadsheet
One-sheet Porter's Five Forces for The Arena Group that translates competitive complexity into a clear, customizable spider chart—perfect for quick strategic decisions. Easy to edit, slide-ready and integrates with reports to relieve analyst workload and speed boardroom alignment.
Customers Bargaining Power
Advertisers and agencies
Advertisers and agencies wield strong leverage: programmatic purchasing now drives about 80% of display spend, enabling large buyers to use multi-publisher RFPs that compress CPMs. Brand buyers increasingly require viewability and attention metrics plus performance guarantees. Budget fluidity lets spend shift rapidly to social and CTV. Direct-sold, high-context placements still capture a 20–40% premium, partially defending pricing.
Programmatic intermediaries
DSPs and SSPs raise price transparency—programmatic accounted for about 86% of US digital display in 2024, boosting buyer leverage. Auction dynamics and header bidding, which can lift publisher yields roughly 10–20%, also compress sell-side margins by intensifying bid competition. Brand-safety filters and blocklists shrink eligible premium inventory, reducing high-value bid opportunities. Curated private marketplaces, representing roughly a quarter of programmatic spend, improve take rates via guaranteed packages.
Subscribers and members
Consumers face abundant free alternatives, increasing price sensitivity and elevating churn risk for The Arena Group unless content or product utility is exclusive; by 2024 global paid news subscriptions exceeded 500 million, intensifying competition for paid attention. Flexible monthly billing in most publishers empowers switching, while bundling and member-only experiences can reduce elasticity and improve retention.
Affiliates and commerce partners
- Commission range: 5–20% (2024)
- Attribution-linked renegotiation common
- Category cyclicality drives budget volatility
- Data transparency preserves premium CPMs
Enterprise and sponsorship buyers
Sponsors increasingly demand multi-property integrations and use scale to negotiate discounts; in 2024 buyers intensified demand for cross-property deals. Measurement expectations require custom reporting and guaranteed KPIs, raising implementation costs and bargaining leverage. Seasonality concentrates leverage around tentpole events, while tiered packages with category exclusivity help protect pricing and margins.
- Multi-property negotiation: scale discounts
- Custom reporting: KPI guarantees
- Seasonality: tentpole leverage
- Tiering: exclusivity to preserve price
Programmatic at 86% US display; direct premium secures 20–40% uplift
Buyers hold strong leverage: programmatic reached about 86% of US display in 2024, enabling multi-publisher RFPs and CPM compression. Direct-sold premium placements still command 20–40% uplift, partially insulating revenue. Affiliates negotiate 5–20% commission rates tied to attribution; private marketplaces ~25% of programmatic improve guaranteed take rates. Sponsors push cross-property deals and KPI guarantees, concentrating leverage around tentpole events.
| Metric | 2024 Value |
|---|---|
| Programmatic share | 86% US display |
| Direct-sold premium | 20–40% uplift |
| Paid news subs | 500M global |
| Affiliate commission | 5–20% |
| PMPs share | ~25% programmatic |
What You See Is What You Get
The Arena Group Porter's Five Forces Analysis
This preview shows the exact The Arena Group Porter's Five Forces Analysis you'll receive immediately after purchase—no surprises, no placeholders. The document displayed is fully formatted, professionally written, and ready for download and use the moment you buy. You're viewing the final deliverable; after payment you'll get instant access to this identical file.
Description
A Must-Have Tool for Decision-Makers
The Arena Group faces intense rivalry from diversified digital publishers and rising niche platforms, while buyer power and ad-platform dependence pressure margins; supplier and content-creation costs add variability to profit models. This brief snapshot only scratches the surface. Unlock the full Porter's Five Forces Analysis to explore The Arena Group’s competitive dynamics, market pressures, and strategic advantages in detail.
Suppliers Bargaining Power
Premium content licensors
Licensors of marquee brands, athlete IP and photo libraries—Getty Images alone catalogs over 415 million assets—increase content costs and compress margins for The Arena Group. The global sports media rights market was roughly $60 billion in 2023, and agencies restrict availability during peak events, driving up short-term fees. Dependence on exclusive or semi-exclusive assets raises switching costs and contract friction. Negotiation leverage spikes when content is time-sensitive or viral, enabling licensors to command premium rates.
Freelancers and creators
High-quality journalists, analysts, and on-air talent with strong followings can negotiate higher pay and exclusivity, raising supplier leverage for The Arena Group.
Competition for niche sports-analytics and entertainment scoops intensifies bargaining power as specialized contributors are scarce and command premium rates.
Platforms enabling the creator economy, valued at about $250 billion in 2024, provide alternatives and increase churn risk, though long-term contributor contracts can reduce pricing volatility.
Technology and ad-tech vendors
Cloud/CDN/CMS and ad-tech stacks are concentrated—AWS, Azure and GCP held about 67% of cloud market in 2024—creating clear supplier dependency for The Arena Group. Post-cookie, identity, measurement and brand-safety tools (eg LiveRamp-scale providers) become mission-critical, boosting vendor leverage. Integration complexity raises switching costs and operational risk, while volume commitments and multi-year contracts may secure discounts but limit flexibility.
Distribution gatekeepers
Search engines, social platforms and app stores function as quasi-suppliers of audience access: Google handles ~92% of global search queries (StatCounter 2024), Meta platforms dominate social referrals and app stores enforce standard revenue shares up to 30%, all of which can abruptly alter traffic and monetization through algorithm or policy shifts. Diversifying channels reduces single-gatekeeper exposure but cannot eliminate platform leverage.
Data and rights holders
Sports leagues, financial data providers and entertainment databases control essential feeds; timely, accurate data underpins TheStreet and sports coverage, making quality non-negotiable. Bloomberg terminal access cost roughly 27,000 USD/year in 2024, illustrating base data expense. Licensing often involves multi-year contracts and can spike around major seasons and earnings cycles.
- Data concentration: leagues and major vendors dominate feeds
- 2024 benchmark: Bloomberg terminal ~27,000 USD/year
- Cost dynamics: multi-year bundles lock spend
- Pricing pressure: spikes during seasons and earnings
Supplier concentration and expensive sports rights squeeze digital publisher margins
Licensors of brand/IP and time-sensitive sports rights (global market ~$60B in 2023) and scarce top talent raise content costs and switching barriers for The Arena Group. Concentrated cloud/CDN (67% AWS/Azure/GCP 2024), search (Google ~92% 2024) and app-store rules amplify supplier leverage. Data feeds and terminals (Bloomberg ~27,000 USD/year 2024) add recurring licensing pressure.
| Supplier | Metric |
|---|---|
| Getty | 415M assets |
| Sports rights | $60B (2023) |
| Cloud | 67% share (2024) |
| Search | Google 92% (2024) |
| Bloomberg | $27,000/yr (2024) |
What is included in the product
Detailed Word Document
Concise Porter's Five Forces analysis of The Arena Group highlighting competitive rivalry, buyer and supplier power, threat of new entrants and substitutes, and the key disruptive forces shaping its digital media and publishing margins; actionable insights for strategy, investor materials, and internal planning.
Customizable Excel Spreadsheet
One-sheet Porter's Five Forces for The Arena Group that translates competitive complexity into a clear, customizable spider chart—perfect for quick strategic decisions. Easy to edit, slide-ready and integrates with reports to relieve analyst workload and speed boardroom alignment.
Customers Bargaining Power
Advertisers and agencies
Advertisers and agencies wield strong leverage: programmatic purchasing now drives about 80% of display spend, enabling large buyers to use multi-publisher RFPs that compress CPMs. Brand buyers increasingly require viewability and attention metrics plus performance guarantees. Budget fluidity lets spend shift rapidly to social and CTV. Direct-sold, high-context placements still capture a 20–40% premium, partially defending pricing.
Programmatic intermediaries
DSPs and SSPs raise price transparency—programmatic accounted for about 86% of US digital display in 2024, boosting buyer leverage. Auction dynamics and header bidding, which can lift publisher yields roughly 10–20%, also compress sell-side margins by intensifying bid competition. Brand-safety filters and blocklists shrink eligible premium inventory, reducing high-value bid opportunities. Curated private marketplaces, representing roughly a quarter of programmatic spend, improve take rates via guaranteed packages.
Subscribers and members
Consumers face abundant free alternatives, increasing price sensitivity and elevating churn risk for The Arena Group unless content or product utility is exclusive; by 2024 global paid news subscriptions exceeded 500 million, intensifying competition for paid attention. Flexible monthly billing in most publishers empowers switching, while bundling and member-only experiences can reduce elasticity and improve retention.
Affiliates and commerce partners
- Commission range: 5–20% (2024)
- Attribution-linked renegotiation common
- Category cyclicality drives budget volatility
- Data transparency preserves premium CPMs
Enterprise and sponsorship buyers
Sponsors increasingly demand multi-property integrations and use scale to negotiate discounts; in 2024 buyers intensified demand for cross-property deals. Measurement expectations require custom reporting and guaranteed KPIs, raising implementation costs and bargaining leverage. Seasonality concentrates leverage around tentpole events, while tiered packages with category exclusivity help protect pricing and margins.
- Multi-property negotiation: scale discounts
- Custom reporting: KPI guarantees
- Seasonality: tentpole leverage
- Tiering: exclusivity to preserve price
Programmatic at 86% US display; direct premium secures 20–40% uplift
Buyers hold strong leverage: programmatic reached about 86% of US display in 2024, enabling multi-publisher RFPs and CPM compression. Direct-sold premium placements still command 20–40% uplift, partially insulating revenue. Affiliates negotiate 5–20% commission rates tied to attribution; private marketplaces ~25% of programmatic improve guaranteed take rates. Sponsors push cross-property deals and KPI guarantees, concentrating leverage around tentpole events.
| Metric | 2024 Value |
|---|---|
| Programmatic share | 86% US display |
| Direct-sold premium | 20–40% uplift |
| Paid news subs | 500M global |
| Affiliate commission | 5–20% |
| PMPs share | ~25% programmatic |
What You See Is What You Get
The Arena Group Porter's Five Forces Analysis
This preview shows the exact The Arena Group Porter's Five Forces Analysis you'll receive immediately after purchase—no surprises, no placeholders. The document displayed is fully formatted, professionally written, and ready for download and use the moment you buy. You're viewing the final deliverable; after payment you'll get instant access to this identical file.











