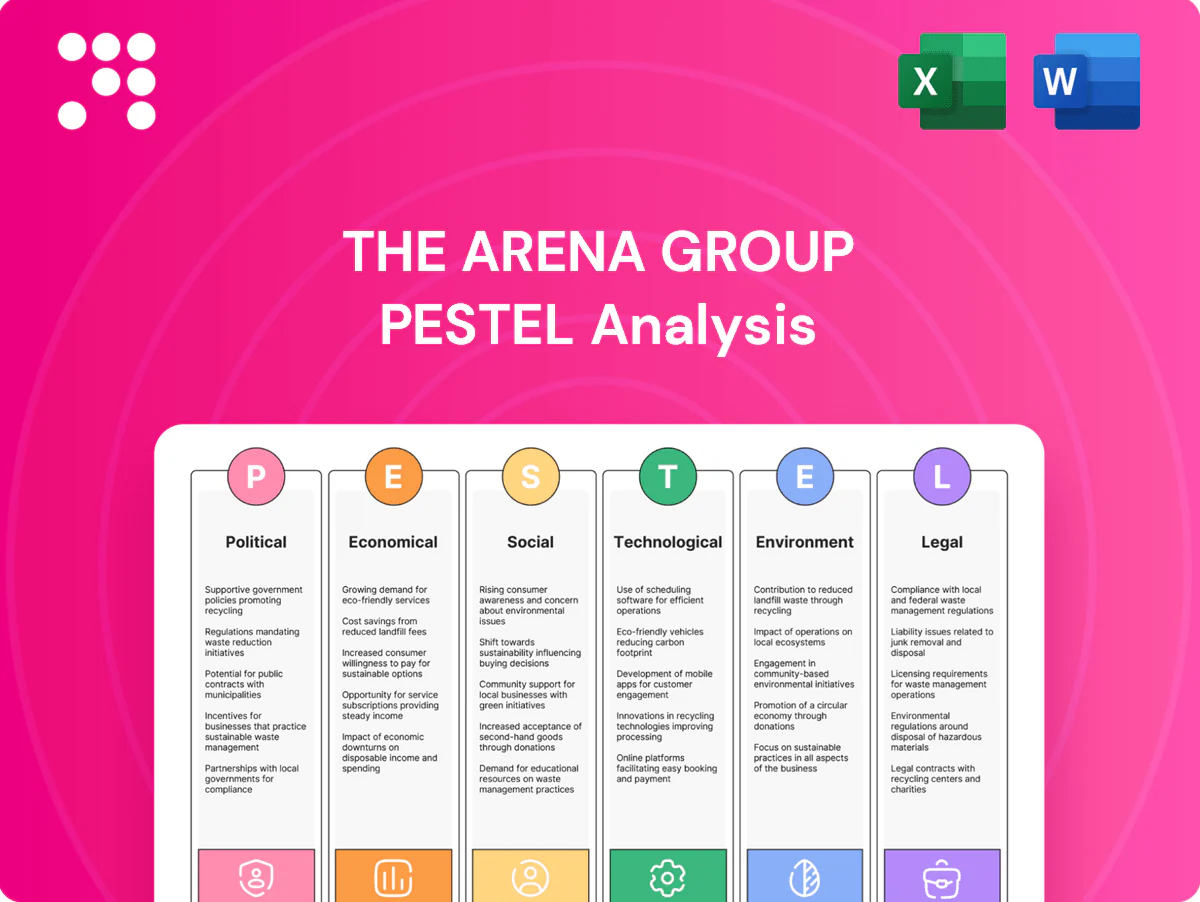
The Arena Group PESTLE Analysis

Skip the Research. Get the Strategy.
Unlock strategic clarity with our PESTLE Analysis of The Arena Group — concise, current, and focused on political, economic, social, technological, legal, and environmental drivers shaping its outlook. Ideal for investors and strategists, this ready-to-use report highlights risks and growth levers. Purchase the full analysis to get actionable insights and editable deliverables instantly.
Political factors

Platform regulation volatility
Shifts in policies at major platforms can abruptly cut referral traffic and ad monetization, exposing publishers to revenue volatility.
Political scrutiny of algorithmic transparency — reinforced by the EU Digital Markets Act (effective March 2024) and designation of 22 gatekeepers — may force major distribution changes.
The Arena Group should diversify traffic sources and maintain active policy monitoring to anticipate and mitigate sudden exposure swings.
Content moderation and misinformation
Heightened political focus on misinformation, reinforced by the EU Digital Services Act (enforced 2024) with fines up to 6% of global turnover, pushes The Arena Group toward stricter moderation expectations. News and sports commentary must balance speed with accuracy to avoid political backlash and advertiser flight; 71% of brands in 2024 surveys rated brand safety a top priority. Clear editorial standards, rigorous fact-checking protocols and consistent enforcement protect brand trust and advertiser safety.

Press freedom and journalism support
Variations in press freedom (US ranked 42 in RSF 2024) and uneven shield laws (49 states/DC offer some protections) shape Arena Group’s investigative coverage of sports governance and finance; Pew shows local newsroom employment fell 26% since 2008, creating gaps. Federal/local funding or tax incentives proposed could open revenue streams, while positioning as a trusted, nonpartisan brand amid polarization and advocacy via News Media Alliance may secure favorable outcomes.

International tensions and market access
Geopolitical frictions — from US/EU sanctions to export controls — can sharply limit The Arena Group’s content reach, licensing and ad sales in affected markets and supply chains. Cross-border data rules such as GDPR (2018) and China’s PIPL (2021) add compliance costs and slow audience expansion. Prioritize compliant, region-specific strategies and continuous risk mapping to decide where to invest or pull back; global digital ad spend was roughly $620B in 2024, underscoring lost-opportunity stakes.
- GDPR (2018) and PIPL (2021): core compliance frameworks
- Sanctions/export controls: restrict licensing & ad sales
- Risk mapping: essential for investment vs retreat decisions
Public policy on college sports and NIL
Policy shocks and ad volatility squeeze digital media; NIL boosts revenue, compliance costs rise
Platform policy shifts (DMA Mar 2024, DSA 2024) and ad volatility threaten referral revenue; global digital ad spend was ~$620B in 2024. Compliance (GDPR, PIPL) and sanctions raise expansion costs. NIL market ~$800M–$1B (2023) creates monetization plus legal complexity. Local newsroom cuts (-26% since 2008) heighten trust value.
| Factor | Key Stat |
|---|---|
| Ad market | $620B (2024) |
| NIL | $800M–$1B (2023) |
| Press freedom | US rank 42 (RSF 2024) |
What is included in the product
 Detailed Word Document
Explores how external macro-environmental factors uniquely affect The Arena Group across Political, Economic, Social, Technological, Environmental and Legal dimensions, with emphasis on media and digital publishing dynamics. Backed by current data and forward-looking trends, it helps executives and investors identify threats, opportunities and actionable scenarios.

 Customizable Excel Spreadsheet
A clean, summarized PESTLE of The Arena Group, visually segmented by factors, that can be dropped into presentations for quick alignment across teams and supports notes for region- or business-line-specific risks.
Economic factors

Ad spend cyclicality
Digital advertising closely tracks GDP, interest rates and business confidence; global digital ad spend topped $500B in 2023, so downturns commonly compress CPMs and fill rates—often reducing spot CPMs by double digits—which pressures revenue. A balanced mix of direct sales, programmatic and sponsorships reduces volatility. Counter-cyclical subscriptions, which many publishers target for 20–30% of revenue, help stabilize cash flow.
Subscription growth and ARPU
Consumer willingness to pay is constrained by household budgets—median US household income was $74,580 in 2023—and by inflation (US CPI ~3.4% in 2024), pressuring lower-priced subscriptions. Bundling, pricing tests and premium verticals have been shown to lift ARPU materially when executed; tight churn control is critical as content substitutes proliferate. Cohort analytics guide where retention investment delivers highest ROI.

Platform fees and ad-tech take rates
Intermediary ad-tech take rates consume an estimated 30–50% of programmatic spend, diluting publisher yield; supply-path optimization (SPO) has been shown to reclaim roughly 5–15% of that margin. Favoring direct-sold and sponsorship packages often delivers 2–4x the CPM of open-auction inventory, reducing auction dependence. Continuous vendor benchmarking and RFPs can trim platform fees another 10–20%, keeping economics competitive.

Sports calendar and event-driven demand
Major events like the 2024 Paris Olympics and NFL playoffs drive pronounced audience and advertiser activity, with industry reports showing traffic spikes of 40–150% and CPM uplifts of 25–70% around tentpoles; packaging inventory for these windows routinely boosts effective CPMs. Editorial calendars must sync with advertiser budgets and improved forecasting (±10–15% error) reduces staffing and infrastructure waste.
- Events: Paris 2024, NFL playoffs, drafts
- Traffic: +40–150%
- CPM lift: +25–70%
- Forecast error: ±10–15%
Capital access and cost of funds
Higher interest rates — Fed funds target roughly 5.25–5.50% in mid‑2025 — raise Arena Groups debt service and tighten strategic flexibility, making efficient working capital and disciplined tech capex essential to protect margins. Leveraging partnerships and revenue‑share deals can substitute heavy balance‑sheet investment while scenario planning prepares trigger points and actions for rate shifts.
- Focus: preserve cash, lower net leverage
- Capex: prioritize ROI, defer noncore projects
- Partnerships: lean M&A alternative
- Plan: predefined rate scenarios and response thresholds
Policy shocks and ad volatility squeeze digital media; NIL boosts revenue, compliance costs rise
Digital ad spend (~$550B in 2023) tracks GDP and rates, so downturns compress CPMs and fill rates, pressuring revenue; diversified direct, programmatic and sponsorship sales reduce volatility. Median US household income was $74,580 in 2023 and CPI ~3.4% (2024), constraining subscription willingness to pay. Programmatic take rates 30–50% (SPO can reclaim 5–15%); Fed funds ~5.25–5.50% mid‑2025 raise debt service and capex scrutiny.
| Metric | Value |
|---|---|
| Global digital ad spend 2023 | $550B |
| Median US household income 2023 | $74,580 |
| US CPI 2024 | 3.4% |
| Fed funds mid‑2025 | 5.25–5.50% |
| Programmatic take rates | 30–50% |
| SPO reclaim | 5–15% |
Full Version Awaits
The Arena Group PESTLE Analysis
The Arena Group PESTLE Analysis preview shown here is the exact document you’ll receive after purchase—fully formatted and ready to use. The layout, content, and structure visible are identical to the downloadable file you’ll get immediately after checkout. No placeholders or teasers; this is the final, professionally structured report.

Skip the Research. Get the Strategy.
Unlock strategic clarity with our PESTLE Analysis of The Arena Group — concise, current, and focused on political, economic, social, technological, legal, and environmental drivers shaping its outlook. Ideal for investors and strategists, this ready-to-use report highlights risks and growth levers. Purchase the full analysis to get actionable insights and editable deliverables instantly.
Political factors
Platform regulation volatility
Shifts in policies at major platforms can abruptly cut referral traffic and ad monetization, exposing publishers to revenue volatility.
Political scrutiny of algorithmic transparency — reinforced by the EU Digital Markets Act (effective March 2024) and designation of 22 gatekeepers — may force major distribution changes.
The Arena Group should diversify traffic sources and maintain active policy monitoring to anticipate and mitigate sudden exposure swings.
Content moderation and misinformation
Heightened political focus on misinformation, reinforced by the EU Digital Services Act (enforced 2024) with fines up to 6% of global turnover, pushes The Arena Group toward stricter moderation expectations. News and sports commentary must balance speed with accuracy to avoid political backlash and advertiser flight; 71% of brands in 2024 surveys rated brand safety a top priority. Clear editorial standards, rigorous fact-checking protocols and consistent enforcement protect brand trust and advertiser safety.
Press freedom and journalism support
Variations in press freedom (US ranked 42 in RSF 2024) and uneven shield laws (49 states/DC offer some protections) shape Arena Group’s investigative coverage of sports governance and finance; Pew shows local newsroom employment fell 26% since 2008, creating gaps. Federal/local funding or tax incentives proposed could open revenue streams, while positioning as a trusted, nonpartisan brand amid polarization and advocacy via News Media Alliance may secure favorable outcomes.
International tensions and market access
Geopolitical frictions — from US/EU sanctions to export controls — can sharply limit The Arena Group’s content reach, licensing and ad sales in affected markets and supply chains. Cross-border data rules such as GDPR (2018) and China’s PIPL (2021) add compliance costs and slow audience expansion. Prioritize compliant, region-specific strategies and continuous risk mapping to decide where to invest or pull back; global digital ad spend was roughly $620B in 2024, underscoring lost-opportunity stakes.
- GDPR (2018) and PIPL (2021): core compliance frameworks
- Sanctions/export controls: restrict licensing & ad sales
- Risk mapping: essential for investment vs retreat decisions
Public policy on college sports and NIL
Policy shocks and ad volatility squeeze digital media; NIL boosts revenue, compliance costs rise
Platform policy shifts (DMA Mar 2024, DSA 2024) and ad volatility threaten referral revenue; global digital ad spend was ~$620B in 2024. Compliance (GDPR, PIPL) and sanctions raise expansion costs. NIL market ~$800M–$1B (2023) creates monetization plus legal complexity. Local newsroom cuts (-26% since 2008) heighten trust value.
| Factor | Key Stat |
|---|---|
| Ad market | $620B (2024) |
| NIL | $800M–$1B (2023) |
| Press freedom | US rank 42 (RSF 2024) |
What is included in the product
Detailed Word Document
Explores how external macro-environmental factors uniquely affect The Arena Group across Political, Economic, Social, Technological, Environmental and Legal dimensions, with emphasis on media and digital publishing dynamics. Backed by current data and forward-looking trends, it helps executives and investors identify threats, opportunities and actionable scenarios.
Customizable Excel Spreadsheet
A clean, summarized PESTLE of The Arena Group, visually segmented by factors, that can be dropped into presentations for quick alignment across teams and supports notes for region- or business-line-specific risks.
Economic factors
Ad spend cyclicality
Digital advertising closely tracks GDP, interest rates and business confidence; global digital ad spend topped $500B in 2023, so downturns commonly compress CPMs and fill rates—often reducing spot CPMs by double digits—which pressures revenue. A balanced mix of direct sales, programmatic and sponsorships reduces volatility. Counter-cyclical subscriptions, which many publishers target for 20–30% of revenue, help stabilize cash flow.
Subscription growth and ARPU
Consumer willingness to pay is constrained by household budgets—median US household income was $74,580 in 2023—and by inflation (US CPI ~3.4% in 2024), pressuring lower-priced subscriptions. Bundling, pricing tests and premium verticals have been shown to lift ARPU materially when executed; tight churn control is critical as content substitutes proliferate. Cohort analytics guide where retention investment delivers highest ROI.
Platform fees and ad-tech take rates
Intermediary ad-tech take rates consume an estimated 30–50% of programmatic spend, diluting publisher yield; supply-path optimization (SPO) has been shown to reclaim roughly 5–15% of that margin. Favoring direct-sold and sponsorship packages often delivers 2–4x the CPM of open-auction inventory, reducing auction dependence. Continuous vendor benchmarking and RFPs can trim platform fees another 10–20%, keeping economics competitive.
Sports calendar and event-driven demand
Major events like the 2024 Paris Olympics and NFL playoffs drive pronounced audience and advertiser activity, with industry reports showing traffic spikes of 40–150% and CPM uplifts of 25–70% around tentpoles; packaging inventory for these windows routinely boosts effective CPMs. Editorial calendars must sync with advertiser budgets and improved forecasting (±10–15% error) reduces staffing and infrastructure waste.
- Events: Paris 2024, NFL playoffs, drafts
- Traffic: +40–150%
- CPM lift: +25–70%
- Forecast error: ±10–15%
Capital access and cost of funds
Higher interest rates — Fed funds target roughly 5.25–5.50% in mid‑2025 — raise Arena Groups debt service and tighten strategic flexibility, making efficient working capital and disciplined tech capex essential to protect margins. Leveraging partnerships and revenue‑share deals can substitute heavy balance‑sheet investment while scenario planning prepares trigger points and actions for rate shifts.
- Focus: preserve cash, lower net leverage
- Capex: prioritize ROI, defer noncore projects
- Partnerships: lean M&A alternative
- Plan: predefined rate scenarios and response thresholds
Policy shocks and ad volatility squeeze digital media; NIL boosts revenue, compliance costs rise
Digital ad spend (~$550B in 2023) tracks GDP and rates, so downturns compress CPMs and fill rates, pressuring revenue; diversified direct, programmatic and sponsorship sales reduce volatility. Median US household income was $74,580 in 2023 and CPI ~3.4% (2024), constraining subscription willingness to pay. Programmatic take rates 30–50% (SPO can reclaim 5–15%); Fed funds ~5.25–5.50% mid‑2025 raise debt service and capex scrutiny.
| Metric | Value |
|---|---|
| Global digital ad spend 2023 | $550B |
| Median US household income 2023 | $74,580 |
| US CPI 2024 | 3.4% |
| Fed funds mid‑2025 | 5.25–5.50% |
| Programmatic take rates | 30–50% |
| SPO reclaim | 5–15% |
Full Version Awaits
The Arena Group PESTLE Analysis
The Arena Group PESTLE Analysis preview shown here is the exact document you’ll receive after purchase—fully formatted and ready to use. The layout, content, and structure visible are identical to the downloadable file you’ll get immediately after checkout. No placeholders or teasers; this is the final, professionally structured report.
Description
Skip the Research. Get the Strategy.
Unlock strategic clarity with our PESTLE Analysis of The Arena Group — concise, current, and focused on political, economic, social, technological, legal, and environmental drivers shaping its outlook. Ideal for investors and strategists, this ready-to-use report highlights risks and growth levers. Purchase the full analysis to get actionable insights and editable deliverables instantly.
Political factors
Platform regulation volatility
Shifts in policies at major platforms can abruptly cut referral traffic and ad monetization, exposing publishers to revenue volatility.
Political scrutiny of algorithmic transparency — reinforced by the EU Digital Markets Act (effective March 2024) and designation of 22 gatekeepers — may force major distribution changes.
The Arena Group should diversify traffic sources and maintain active policy monitoring to anticipate and mitigate sudden exposure swings.
Content moderation and misinformation
Heightened political focus on misinformation, reinforced by the EU Digital Services Act (enforced 2024) with fines up to 6% of global turnover, pushes The Arena Group toward stricter moderation expectations. News and sports commentary must balance speed with accuracy to avoid political backlash and advertiser flight; 71% of brands in 2024 surveys rated brand safety a top priority. Clear editorial standards, rigorous fact-checking protocols and consistent enforcement protect brand trust and advertiser safety.
Press freedom and journalism support
Variations in press freedom (US ranked 42 in RSF 2024) and uneven shield laws (49 states/DC offer some protections) shape Arena Group’s investigative coverage of sports governance and finance; Pew shows local newsroom employment fell 26% since 2008, creating gaps. Federal/local funding or tax incentives proposed could open revenue streams, while positioning as a trusted, nonpartisan brand amid polarization and advocacy via News Media Alliance may secure favorable outcomes.
International tensions and market access
Geopolitical frictions — from US/EU sanctions to export controls — can sharply limit The Arena Group’s content reach, licensing and ad sales in affected markets and supply chains. Cross-border data rules such as GDPR (2018) and China’s PIPL (2021) add compliance costs and slow audience expansion. Prioritize compliant, region-specific strategies and continuous risk mapping to decide where to invest or pull back; global digital ad spend was roughly $620B in 2024, underscoring lost-opportunity stakes.
- GDPR (2018) and PIPL (2021): core compliance frameworks
- Sanctions/export controls: restrict licensing & ad sales
- Risk mapping: essential for investment vs retreat decisions
Public policy on college sports and NIL
Policy shocks and ad volatility squeeze digital media; NIL boosts revenue, compliance costs rise
Platform policy shifts (DMA Mar 2024, DSA 2024) and ad volatility threaten referral revenue; global digital ad spend was ~$620B in 2024. Compliance (GDPR, PIPL) and sanctions raise expansion costs. NIL market ~$800M–$1B (2023) creates monetization plus legal complexity. Local newsroom cuts (-26% since 2008) heighten trust value.
| Factor | Key Stat |
|---|---|
| Ad market | $620B (2024) |
| NIL | $800M–$1B (2023) |
| Press freedom | US rank 42 (RSF 2024) |
What is included in the product
Detailed Word Document
Explores how external macro-environmental factors uniquely affect The Arena Group across Political, Economic, Social, Technological, Environmental and Legal dimensions, with emphasis on media and digital publishing dynamics. Backed by current data and forward-looking trends, it helps executives and investors identify threats, opportunities and actionable scenarios.
Customizable Excel Spreadsheet
A clean, summarized PESTLE of The Arena Group, visually segmented by factors, that can be dropped into presentations for quick alignment across teams and supports notes for region- or business-line-specific risks.
Economic factors
Ad spend cyclicality
Digital advertising closely tracks GDP, interest rates and business confidence; global digital ad spend topped $500B in 2023, so downturns commonly compress CPMs and fill rates—often reducing spot CPMs by double digits—which pressures revenue. A balanced mix of direct sales, programmatic and sponsorships reduces volatility. Counter-cyclical subscriptions, which many publishers target for 20–30% of revenue, help stabilize cash flow.
Subscription growth and ARPU
Consumer willingness to pay is constrained by household budgets—median US household income was $74,580 in 2023—and by inflation (US CPI ~3.4% in 2024), pressuring lower-priced subscriptions. Bundling, pricing tests and premium verticals have been shown to lift ARPU materially when executed; tight churn control is critical as content substitutes proliferate. Cohort analytics guide where retention investment delivers highest ROI.
Platform fees and ad-tech take rates
Intermediary ad-tech take rates consume an estimated 30–50% of programmatic spend, diluting publisher yield; supply-path optimization (SPO) has been shown to reclaim roughly 5–15% of that margin. Favoring direct-sold and sponsorship packages often delivers 2–4x the CPM of open-auction inventory, reducing auction dependence. Continuous vendor benchmarking and RFPs can trim platform fees another 10–20%, keeping economics competitive.
Sports calendar and event-driven demand
Major events like the 2024 Paris Olympics and NFL playoffs drive pronounced audience and advertiser activity, with industry reports showing traffic spikes of 40–150% and CPM uplifts of 25–70% around tentpoles; packaging inventory for these windows routinely boosts effective CPMs. Editorial calendars must sync with advertiser budgets and improved forecasting (±10–15% error) reduces staffing and infrastructure waste.
- Events: Paris 2024, NFL playoffs, drafts
- Traffic: +40–150%
- CPM lift: +25–70%
- Forecast error: ±10–15%
Capital access and cost of funds
Higher interest rates — Fed funds target roughly 5.25–5.50% in mid‑2025 — raise Arena Groups debt service and tighten strategic flexibility, making efficient working capital and disciplined tech capex essential to protect margins. Leveraging partnerships and revenue‑share deals can substitute heavy balance‑sheet investment while scenario planning prepares trigger points and actions for rate shifts.
- Focus: preserve cash, lower net leverage
- Capex: prioritize ROI, defer noncore projects
- Partnerships: lean M&A alternative
- Plan: predefined rate scenarios and response thresholds
Policy shocks and ad volatility squeeze digital media; NIL boosts revenue, compliance costs rise
Digital ad spend (~$550B in 2023) tracks GDP and rates, so downturns compress CPMs and fill rates, pressuring revenue; diversified direct, programmatic and sponsorship sales reduce volatility. Median US household income was $74,580 in 2023 and CPI ~3.4% (2024), constraining subscription willingness to pay. Programmatic take rates 30–50% (SPO can reclaim 5–15%); Fed funds ~5.25–5.50% mid‑2025 raise debt service and capex scrutiny.
| Metric | Value |
|---|---|
| Global digital ad spend 2023 | $550B |
| Median US household income 2023 | $74,580 |
| US CPI 2024 | 3.4% |
| Fed funds mid‑2025 | 5.25–5.50% |
| Programmatic take rates | 30–50% |
| SPO reclaim | 5–15% |
Full Version Awaits
The Arena Group PESTLE Analysis
The Arena Group PESTLE Analysis preview shown here is the exact document you’ll receive after purchase—fully formatted and ready to use. The layout, content, and structure visible are identical to the downloadable file you’ll get immediately after checkout. No placeholders or teasers; this is the final, professionally structured report.











