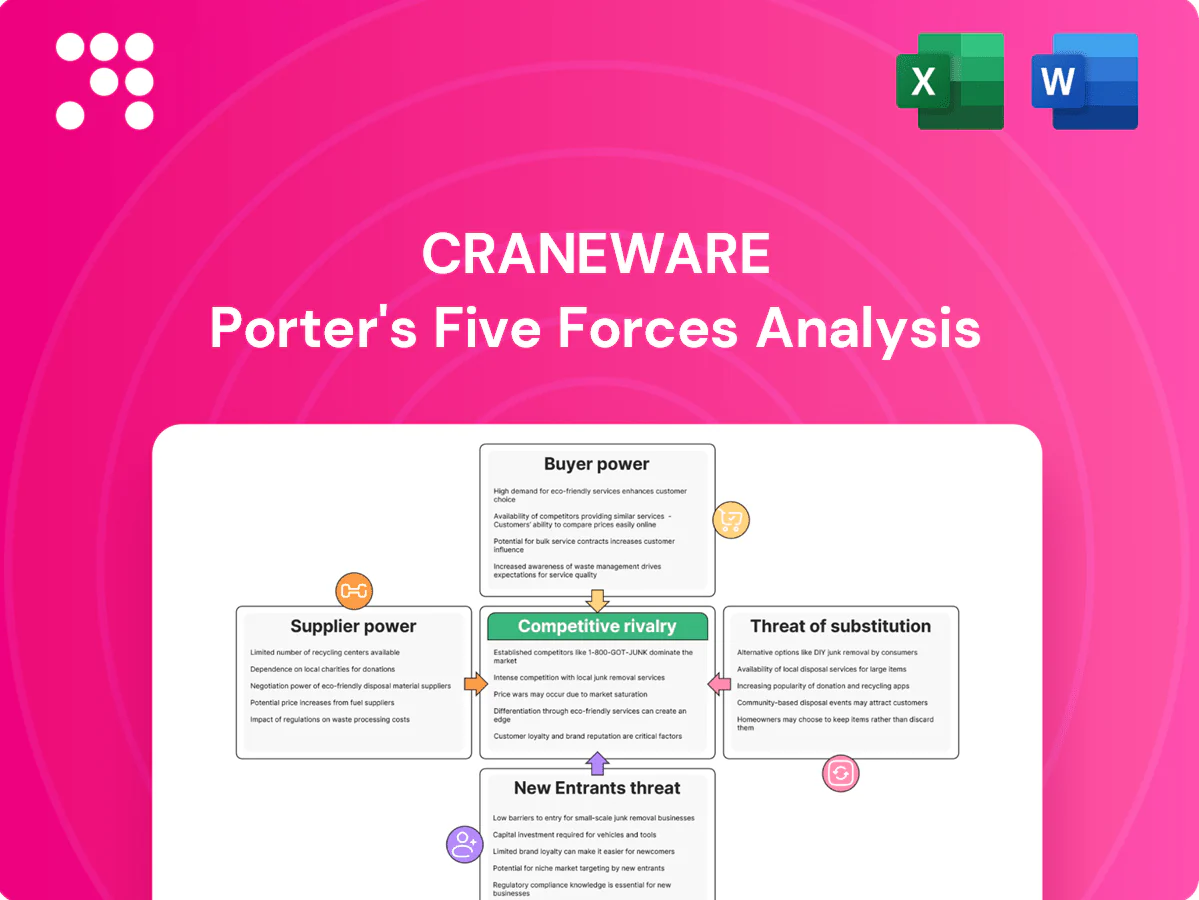
Craneware Porter's Five Forces Analysis

Go Beyond the Preview—Access the Full Strategic Report
Craneware’s Porter's Five Forces assessment highlights moderate supplier power, concentrated buyer influence, rising substitute threats from new tech, and intense rivalry within healthcare revenue-cycle software. Strategic implications touch pricing, innovation and M&A positioning. This preview is just the beginning. The full analysis provides a complete strategic snapshot with force-by-force ratings, visuals, and business implications tailored to Craneware.
Suppliers Bargaining Power

Cloud/IaaS dependence
Craneware depends on hyperscale clouds for hosting, uptime and security, with AWS, Azure and GCP holding roughly 32%, 23% and 11% global IaaS share in 2024, giving them pricing leverage. Multi-cloud architectures and reserved commitments (up to ~70% cost savings on RIs) can mitigate some pressure. Persistent outage risk and egress fees continue to strengthen supplier bargaining power.
EHR integration gatekeepers
Epic (~28% US acute hospitals), Oracle Health (Cerner, ~24%) and Meditech (~8%) control key interfaces and certification paths, concentrating supplier power; API access fees, rate limits and multi-year change cycles commonly push integration timelines to 6–12 months and can add $250k–$2M in implementation costs for vendors.

Regulatory content licensors
Regulatory content licensors for three primary code sets — CPT, HCPCS and ICD — supply essential inputs and are updated on an annual cadence, creating limited substitution. CMS rulemaking and reference data tie reimbursements to these codes, and Medicare covers over 65 million beneficiaries in 2024, amplifying dependence. Licensing terms and update fees force ongoing adaptation costs for Craneware, concentrating supplier influence.

Specialist talent supply
- High salaries: security ~$140k, informatics ~$95k (2024)
- Wage inflation ~5–6% YoY (2023–24)
- Replacement cost ~30% of salary
- Remote work expands pool but raises competition and knowledge-loss risk
Third‑party data and tools
Claims clearinghouses, payment networks and embedded analytics create vendor leverage for Craneware as niche datasets and algorithms command premium pricing; many vendors report 3–5 year contract terms and specialized validation cycles that make switching nontrivial.
- Embedded components: clearinghouses, payment networks, analytics
- Pricing power: premium for unique datasets/algorithms
- Switching friction: validation and compliance hurdles
- Contract length: commonly 3–5 years, stabilizing but locking costs
Supplier squeeze: AWS32%/Azure23%/GCP11% Epic28%/Oracle24% wages+5-6%
Suppliers exert strong leverage: hyperscale clouds (AWS 32%, Azure 23%, GCP 11% in 2024), EHRs (Epic 28%, Oracle/Cerner 24%, Meditech 8%), code licensors and niche data/clearing vendors drive pricing, fees and switching costs; specialist talent costs (security ~$140k, informatics ~$95k) and 5–6% wage inflation raise operating costs.
| Category | Metric (2024) |
|---|---|
| Cloud share | AWS32%/Azure23%/GCP11% |
| EHR share (US) | Epic28%/Oracle24%/Meditech8% |
| Salary medians | Security$140k/Inform$95k |
| Contracts | 3–5 yrs |
What is included in the product
 Detailed Word Document
Tailored exclusively for Craneware, this Porter's Five Forces overview uncovers key competitive drivers, evaluates supplier and buyer power, and identifies new entrant risks, substitutes, and emerging threats to its market share and profitability.

 Customizable Excel Spreadsheet
Clear one-sheet Porter's Five Forces for Craneware that instantly highlights competitive pressure, with customizable scores and a ready-to-copy radar chart — no macros, easy to edit and drop into decks for faster strategic decisions.
Customers Bargaining Power

Consolidated hospital buyers
Consolidated buyers like IDNs and roll-up health systems, which now include roughly 70% of US hospitals (AHA 2024), purchase at scale and press hard on pricing. GPOs and shared services—top three GPOs covering about 60% of contract spend in 2024—amplify discount pressure. Multi-facility deployments raise referenceability and SLA stakes, and volume often trades for price, lengthening sales cycles.
High switching costs
Deep EHR integration, bespoke workflows and staff training raise lock-in for Craneware, making switching operationally complex and risky.
Over 90% of US hospitals use certified EHRs per ONC, and data migration typically involves multi-month projects and multimillion-dollar effort, so buyers push for incentives and exit clauses to offset risk.
Proven ROI mutes but does not eliminate price demands, preserving significant customer bargaining power.

Outcome‑based expectations
CFOs demand measurable lifts in net revenue, denials, and compliance, with hospital denial rates averaging about 7% and revenue recovery opportunities often cited near 3–5% in 2024; value‑based or gainshare pricing shifts significant downside risk to Craneware. Transparent dashboards and immutable audit trails are now mandatory for CFO sign‑off. Weak results quickly elevate churn and renegotiation pressure.

Budget constraints
Thin operating margins and capital rationing in 2024 leave health systems highly price sensitive, with cybersecurity and staffing routinely competing for limited budgets and delaying discretionary IT spend. Mid-cycle regulatory changes can abruptly reprioritize capital, increasing buyer leverage. Flexible pricing and modular packaging improve win rates by matching constrained procurement cycles.
- Price sensitivity: high
- Competing priorities: cyber, staffing
- Regulatory risk: sudden reprioritization
- Sales tactic: modular pricing
Informed procurement
Buyers now benchmark Craneware against Optum, Waystar, FinThrive and native EHR modules, using standardized RFPs that prioritize total cost of ownership and measurable ROI. References and ROI case studies are vetted rigorously, creating information parity that strengthens buyer bargaining power. In 2024 procurement teams increasingly demanded outcome-linked pricing and clear payback timelines.
- Benchmarks: Optum, Waystar, FinThrive, EHR modules
- RFP focus: total cost of ownership
- Due diligence: references and ROI case studies
- 2024 trend: outcome-linked pricing demanded
Consolidation, EHR lock-in and outcome-linked pricing squeeze hospital vendors
Consolidated buyers (IDNs/roll-ups; ~70% of US hospitals in 2024) and top three GPOs (~60% of contract spend) exert strong price pressure, lengthening sales cycles. Deep EHR integration and multi-month, multimillion-dollar migrations (90%+ hospitals on certified EHRs) raise switching costs but buyers demand outcome‑linked pricing as denials (~7%) and recovery (3–5%) drive CFO scrutiny.
| Metric | 2024 |
|---|---|
| Hospitals in IDNs | ~70% |
| Top3 GPO contract spend | ~60% |
| Certified EHR adoption | >90% |
| Avg denial rate | ~7% |
| Recovery opportunity | 3–5% |
What You See Is What You Get
Craneware Porter's Five Forces Analysis
This preview shows the exact Craneware Porter's Five Forces Analysis you'll receive immediately after purchase—no surprises, no placeholders. The report provides a clear assessment of supplier power, buyer power, competitive rivalry, threat of substitutes and entry barriers specific to Craneware. It's the final, professionally formatted file ready for download and use the moment you buy.

Go Beyond the Preview—Access the Full Strategic Report
Craneware’s Porter's Five Forces assessment highlights moderate supplier power, concentrated buyer influence, rising substitute threats from new tech, and intense rivalry within healthcare revenue-cycle software. Strategic implications touch pricing, innovation and M&A positioning. This preview is just the beginning. The full analysis provides a complete strategic snapshot with force-by-force ratings, visuals, and business implications tailored to Craneware.
Suppliers Bargaining Power
Cloud/IaaS dependence
Craneware depends on hyperscale clouds for hosting, uptime and security, with AWS, Azure and GCP holding roughly 32%, 23% and 11% global IaaS share in 2024, giving them pricing leverage. Multi-cloud architectures and reserved commitments (up to ~70% cost savings on RIs) can mitigate some pressure. Persistent outage risk and egress fees continue to strengthen supplier bargaining power.
EHR integration gatekeepers
Epic (~28% US acute hospitals), Oracle Health (Cerner, ~24%) and Meditech (~8%) control key interfaces and certification paths, concentrating supplier power; API access fees, rate limits and multi-year change cycles commonly push integration timelines to 6–12 months and can add $250k–$2M in implementation costs for vendors.
Regulatory content licensors
Regulatory content licensors for three primary code sets — CPT, HCPCS and ICD — supply essential inputs and are updated on an annual cadence, creating limited substitution. CMS rulemaking and reference data tie reimbursements to these codes, and Medicare covers over 65 million beneficiaries in 2024, amplifying dependence. Licensing terms and update fees force ongoing adaptation costs for Craneware, concentrating supplier influence.
Specialist talent supply
- High salaries: security ~$140k, informatics ~$95k (2024)
- Wage inflation ~5–6% YoY (2023–24)
- Replacement cost ~30% of salary
- Remote work expands pool but raises competition and knowledge-loss risk
Third‑party data and tools
Claims clearinghouses, payment networks and embedded analytics create vendor leverage for Craneware as niche datasets and algorithms command premium pricing; many vendors report 3–5 year contract terms and specialized validation cycles that make switching nontrivial.
- Embedded components: clearinghouses, payment networks, analytics
- Pricing power: premium for unique datasets/algorithms
- Switching friction: validation and compliance hurdles
- Contract length: commonly 3–5 years, stabilizing but locking costs
Supplier squeeze: AWS32%/Azure23%/GCP11% Epic28%/Oracle24% wages+5-6%
Suppliers exert strong leverage: hyperscale clouds (AWS 32%, Azure 23%, GCP 11% in 2024), EHRs (Epic 28%, Oracle/Cerner 24%, Meditech 8%), code licensors and niche data/clearing vendors drive pricing, fees and switching costs; specialist talent costs (security ~$140k, informatics ~$95k) and 5–6% wage inflation raise operating costs.
| Category | Metric (2024) |
|---|---|
| Cloud share | AWS32%/Azure23%/GCP11% |
| EHR share (US) | Epic28%/Oracle24%/Meditech8% |
| Salary medians | Security$140k/Inform$95k |
| Contracts | 3–5 yrs |
What is included in the product
Detailed Word Document
Tailored exclusively for Craneware, this Porter's Five Forces overview uncovers key competitive drivers, evaluates supplier and buyer power, and identifies new entrant risks, substitutes, and emerging threats to its market share and profitability.
Customizable Excel Spreadsheet
Clear one-sheet Porter's Five Forces for Craneware that instantly highlights competitive pressure, with customizable scores and a ready-to-copy radar chart — no macros, easy to edit and drop into decks for faster strategic decisions.
Customers Bargaining Power
Consolidated hospital buyers
Consolidated buyers like IDNs and roll-up health systems, which now include roughly 70% of US hospitals (AHA 2024), purchase at scale and press hard on pricing. GPOs and shared services—top three GPOs covering about 60% of contract spend in 2024—amplify discount pressure. Multi-facility deployments raise referenceability and SLA stakes, and volume often trades for price, lengthening sales cycles.
High switching costs
Deep EHR integration, bespoke workflows and staff training raise lock-in for Craneware, making switching operationally complex and risky.
Over 90% of US hospitals use certified EHRs per ONC, and data migration typically involves multi-month projects and multimillion-dollar effort, so buyers push for incentives and exit clauses to offset risk.
Proven ROI mutes but does not eliminate price demands, preserving significant customer bargaining power.
Outcome‑based expectations
CFOs demand measurable lifts in net revenue, denials, and compliance, with hospital denial rates averaging about 7% and revenue recovery opportunities often cited near 3–5% in 2024; value‑based or gainshare pricing shifts significant downside risk to Craneware. Transparent dashboards and immutable audit trails are now mandatory for CFO sign‑off. Weak results quickly elevate churn and renegotiation pressure.
Budget constraints
Thin operating margins and capital rationing in 2024 leave health systems highly price sensitive, with cybersecurity and staffing routinely competing for limited budgets and delaying discretionary IT spend. Mid-cycle regulatory changes can abruptly reprioritize capital, increasing buyer leverage. Flexible pricing and modular packaging improve win rates by matching constrained procurement cycles.
- Price sensitivity: high
- Competing priorities: cyber, staffing
- Regulatory risk: sudden reprioritization
- Sales tactic: modular pricing
Informed procurement
Buyers now benchmark Craneware against Optum, Waystar, FinThrive and native EHR modules, using standardized RFPs that prioritize total cost of ownership and measurable ROI. References and ROI case studies are vetted rigorously, creating information parity that strengthens buyer bargaining power. In 2024 procurement teams increasingly demanded outcome-linked pricing and clear payback timelines.
- Benchmarks: Optum, Waystar, FinThrive, EHR modules
- RFP focus: total cost of ownership
- Due diligence: references and ROI case studies
- 2024 trend: outcome-linked pricing demanded
Consolidation, EHR lock-in and outcome-linked pricing squeeze hospital vendors
Consolidated buyers (IDNs/roll-ups; ~70% of US hospitals in 2024) and top three GPOs (~60% of contract spend) exert strong price pressure, lengthening sales cycles. Deep EHR integration and multi-month, multimillion-dollar migrations (90%+ hospitals on certified EHRs) raise switching costs but buyers demand outcome‑linked pricing as denials (~7%) and recovery (3–5%) drive CFO scrutiny.
| Metric | 2024 |
|---|---|
| Hospitals in IDNs | ~70% |
| Top3 GPO contract spend | ~60% |
| Certified EHR adoption | >90% |
| Avg denial rate | ~7% |
| Recovery opportunity | 3–5% |
What You See Is What You Get
Craneware Porter's Five Forces Analysis
This preview shows the exact Craneware Porter's Five Forces Analysis you'll receive immediately after purchase—no surprises, no placeholders. The report provides a clear assessment of supplier power, buyer power, competitive rivalry, threat of substitutes and entry barriers specific to Craneware. It's the final, professionally formatted file ready for download and use the moment you buy.
Original: $10.00
-65%$10.00
$3.50Description
Go Beyond the Preview—Access the Full Strategic Report
Craneware’s Porter's Five Forces assessment highlights moderate supplier power, concentrated buyer influence, rising substitute threats from new tech, and intense rivalry within healthcare revenue-cycle software. Strategic implications touch pricing, innovation and M&A positioning. This preview is just the beginning. The full analysis provides a complete strategic snapshot with force-by-force ratings, visuals, and business implications tailored to Craneware.
Suppliers Bargaining Power
Cloud/IaaS dependence
Craneware depends on hyperscale clouds for hosting, uptime and security, with AWS, Azure and GCP holding roughly 32%, 23% and 11% global IaaS share in 2024, giving them pricing leverage. Multi-cloud architectures and reserved commitments (up to ~70% cost savings on RIs) can mitigate some pressure. Persistent outage risk and egress fees continue to strengthen supplier bargaining power.
EHR integration gatekeepers
Epic (~28% US acute hospitals), Oracle Health (Cerner, ~24%) and Meditech (~8%) control key interfaces and certification paths, concentrating supplier power; API access fees, rate limits and multi-year change cycles commonly push integration timelines to 6–12 months and can add $250k–$2M in implementation costs for vendors.
Regulatory content licensors
Regulatory content licensors for three primary code sets — CPT, HCPCS and ICD — supply essential inputs and are updated on an annual cadence, creating limited substitution. CMS rulemaking and reference data tie reimbursements to these codes, and Medicare covers over 65 million beneficiaries in 2024, amplifying dependence. Licensing terms and update fees force ongoing adaptation costs for Craneware, concentrating supplier influence.
Specialist talent supply
- High salaries: security ~$140k, informatics ~$95k (2024)
- Wage inflation ~5–6% YoY (2023–24)
- Replacement cost ~30% of salary
- Remote work expands pool but raises competition and knowledge-loss risk
Third‑party data and tools
Claims clearinghouses, payment networks and embedded analytics create vendor leverage for Craneware as niche datasets and algorithms command premium pricing; many vendors report 3–5 year contract terms and specialized validation cycles that make switching nontrivial.
- Embedded components: clearinghouses, payment networks, analytics
- Pricing power: premium for unique datasets/algorithms
- Switching friction: validation and compliance hurdles
- Contract length: commonly 3–5 years, stabilizing but locking costs
Supplier squeeze: AWS32%/Azure23%/GCP11% Epic28%/Oracle24% wages+5-6%
Suppliers exert strong leverage: hyperscale clouds (AWS 32%, Azure 23%, GCP 11% in 2024), EHRs (Epic 28%, Oracle/Cerner 24%, Meditech 8%), code licensors and niche data/clearing vendors drive pricing, fees and switching costs; specialist talent costs (security ~$140k, informatics ~$95k) and 5–6% wage inflation raise operating costs.
| Category | Metric (2024) |
|---|---|
| Cloud share | AWS32%/Azure23%/GCP11% |
| EHR share (US) | Epic28%/Oracle24%/Meditech8% |
| Salary medians | Security$140k/Inform$95k |
| Contracts | 3–5 yrs |
What is included in the product
Detailed Word Document
Tailored exclusively for Craneware, this Porter's Five Forces overview uncovers key competitive drivers, evaluates supplier and buyer power, and identifies new entrant risks, substitutes, and emerging threats to its market share and profitability.
Customizable Excel Spreadsheet
Clear one-sheet Porter's Five Forces for Craneware that instantly highlights competitive pressure, with customizable scores and a ready-to-copy radar chart — no macros, easy to edit and drop into decks for faster strategic decisions.
Customers Bargaining Power
Consolidated hospital buyers
Consolidated buyers like IDNs and roll-up health systems, which now include roughly 70% of US hospitals (AHA 2024), purchase at scale and press hard on pricing. GPOs and shared services—top three GPOs covering about 60% of contract spend in 2024—amplify discount pressure. Multi-facility deployments raise referenceability and SLA stakes, and volume often trades for price, lengthening sales cycles.
High switching costs
Deep EHR integration, bespoke workflows and staff training raise lock-in for Craneware, making switching operationally complex and risky.
Over 90% of US hospitals use certified EHRs per ONC, and data migration typically involves multi-month projects and multimillion-dollar effort, so buyers push for incentives and exit clauses to offset risk.
Proven ROI mutes but does not eliminate price demands, preserving significant customer bargaining power.
Outcome‑based expectations
CFOs demand measurable lifts in net revenue, denials, and compliance, with hospital denial rates averaging about 7% and revenue recovery opportunities often cited near 3–5% in 2024; value‑based or gainshare pricing shifts significant downside risk to Craneware. Transparent dashboards and immutable audit trails are now mandatory for CFO sign‑off. Weak results quickly elevate churn and renegotiation pressure.
Budget constraints
Thin operating margins and capital rationing in 2024 leave health systems highly price sensitive, with cybersecurity and staffing routinely competing for limited budgets and delaying discretionary IT spend. Mid-cycle regulatory changes can abruptly reprioritize capital, increasing buyer leverage. Flexible pricing and modular packaging improve win rates by matching constrained procurement cycles.
- Price sensitivity: high
- Competing priorities: cyber, staffing
- Regulatory risk: sudden reprioritization
- Sales tactic: modular pricing
Informed procurement
Buyers now benchmark Craneware against Optum, Waystar, FinThrive and native EHR modules, using standardized RFPs that prioritize total cost of ownership and measurable ROI. References and ROI case studies are vetted rigorously, creating information parity that strengthens buyer bargaining power. In 2024 procurement teams increasingly demanded outcome-linked pricing and clear payback timelines.
- Benchmarks: Optum, Waystar, FinThrive, EHR modules
- RFP focus: total cost of ownership
- Due diligence: references and ROI case studies
- 2024 trend: outcome-linked pricing demanded
Consolidation, EHR lock-in and outcome-linked pricing squeeze hospital vendors
Consolidated buyers (IDNs/roll-ups; ~70% of US hospitals in 2024) and top three GPOs (~60% of contract spend) exert strong price pressure, lengthening sales cycles. Deep EHR integration and multi-month, multimillion-dollar migrations (90%+ hospitals on certified EHRs) raise switching costs but buyers demand outcome‑linked pricing as denials (~7%) and recovery (3–5%) drive CFO scrutiny.
| Metric | 2024 |
|---|---|
| Hospitals in IDNs | ~70% |
| Top3 GPO contract spend | ~60% |
| Certified EHR adoption | >90% |
| Avg denial rate | ~7% |
| Recovery opportunity | 3–5% |
What You See Is What You Get
Craneware Porter's Five Forces Analysis
This preview shows the exact Craneware Porter's Five Forces Analysis you'll receive immediately after purchase—no surprises, no placeholders. The report provides a clear assessment of supplier power, buyer power, competitive rivalry, threat of substitutes and entry barriers specific to Craneware. It's the final, professionally formatted file ready for download and use the moment you buy.











