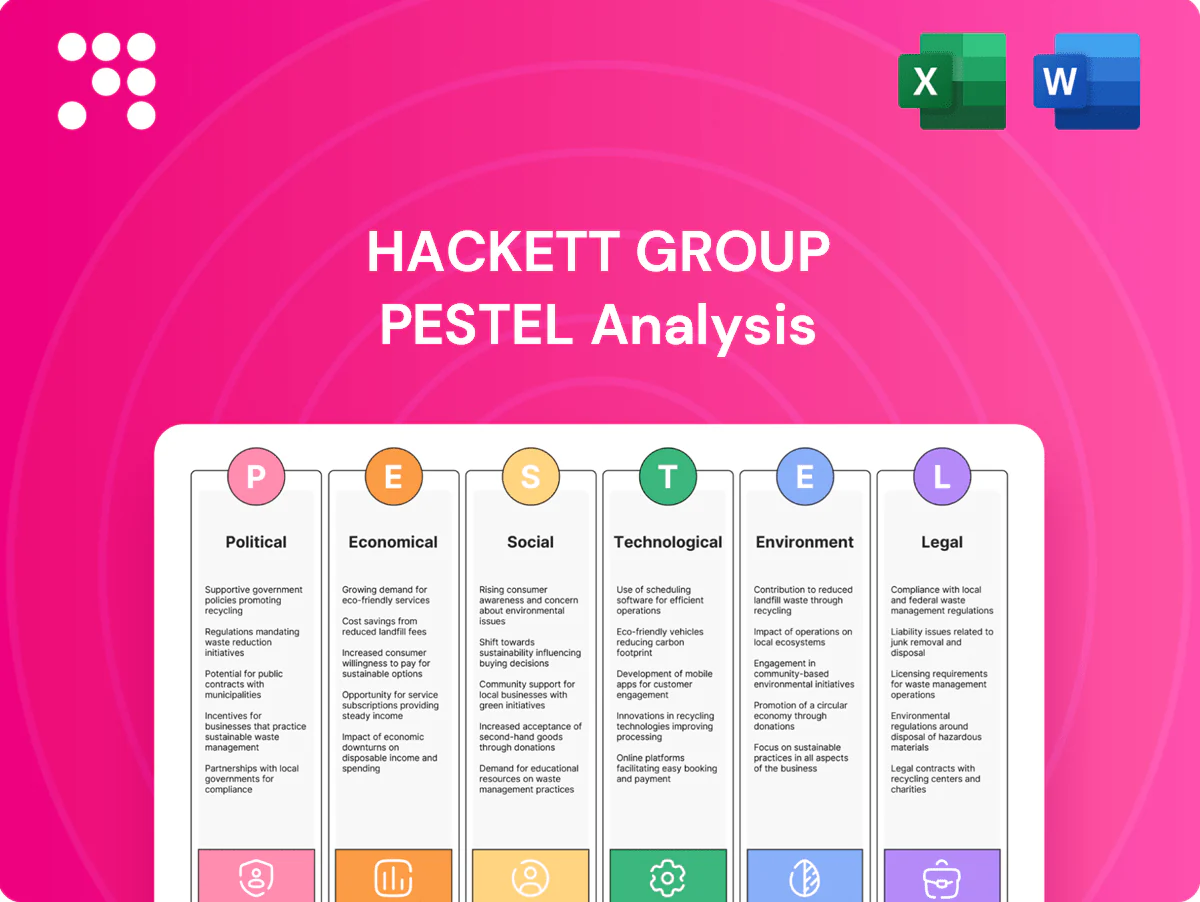
Hackett Group PESTLE Analysis

Your Shortcut to Market Insight Starts Here
Gain a strategic advantage with our PESTLE Analysis of Hackett Group—uncover how political shifts, economic trends, tech innovation, social change, legal risks, and environmental pressures shape its trajectory; buy the full, ready-to-use report for detailed insights and actionable recommendations you can deploy today.
Political factors

Government digital agendas
Public-sector modernization and national digital strategies are driving demand for benchmarking and transformation advisory as global government IT spending reached about $500B in 2024 (IDC), creating scalable opportunities for Hackett to sell benchmarking services. Alignment with e-government, shared services, and cybersecurity priorities is generating multi-year project pipelines in OECD markets. Hackett can license IP and best practices to help agencies meet policy targets and KPIs. Political shifts can rapidly reprioritize funding and timelines, affecting deal cadence and contract scope.
Public spending and procurement
Budget cycles and procurement rules shape access to government contracts and pipeline timing; US federal contracting obligations were about $787B in FY2023, highlighting scale and timing pressures. Framework agreements, local‑content rules and competitive tendering materially affect win rates and project margins. Mastering compliance and partnering with qualified local firms improves eligibility, while fiscal austerity can delay or shrink scopes.

Geopolitics and data sovereignty
Restrictions on data flows and localization mandates, reinforced by GDPR and the 2020 Schrems II ruling, reshape analytics and managed-services delivery models and push providers toward regional footprints. Cross-border tensions increase risk for multinationals that aggregate operational benchmarks. Regional delivery centers and sovereign-cloud offerings (for example AWS GovCloud, Azure Sovereign) mitigate exposure. Clear data-residency assurances become a competitive differentiator.

Talent mobility and visas
Consulting relies on international experts for complex transformations, but US H-1B caps (85,000 regular plus 20,000 master’s) and frequent work-permit delays alongside heightened political scrutiny constrain staffing and slow project ramp-ups; demand for specialty visas often exceeds the cap several-fold. Building local benches and nearshore hubs reduces dependency, while remote delivery models help sustain utilization and continuity of engagements.
- H-1B cap: 85,000 (+20,000 master’s)
- Visa backlogs and political scrutiny constrain staffing
- Local benches and nearshore hubs lower dependency
- Remote delivery sustains utilization and continuity
Trade policy and vendor ecosystems
- Tariffs impact: ~60% of US imports from China
- CFIUS: >300 filings (2022)
- Action: partner-agnostic benchmarking
- Necessity: continuous supplier monitoring
Public-sector IT: $500B pipelines, tariffs ~60%, H-1B caps limit talent
Public-sector digitalization (global gov IT spend ~$500B in 2024) and stable procurement create multi-year advisory pipelines, but political shifts and austerity can reallocate funding. Data localization/GDPR and trade/security actions (tariffs ~60% of China imports; CFIUS >300 filings in 2022) raise delivery and partner risks. Visa caps (H-1B 85,000+20,000 master’s) constrain staffing; nearshore and sovereign-cloud mitigate.
| Metric | Value |
|---|---|
| Global gov IT spend (2024) | $500B (IDC) |
| US federal contracting (FY2023) | $787B |
| H-1B cap | 85,000+20,000 |
| Tariff exposure | ~60% (US imports from China) |
| CFIUS filings (2022) | >300 |
What is included in the product
 Detailed Word Document
Explores how external macro-environmental factors uniquely affect The Hackett Group across Political, Economic, Social, Technological, Environmental, and Legal dimensions, with data-backed insights and forward-looking implications for scenario planning. Designed for executives, consultants, and investors, the analysis is industry- and region-specific and formatted for immediate use in plans, decks, or reports.

 Customizable Excel Spreadsheet
A clean, visually segmented Hackett Group PESTLE summary that’s easy to drop into presentations, editable for local context, and ideal for quick team alignment.
Economic factors

IT spending cycles
Enterprise tech budgets track GDP and corporate earnings, with worldwide IT spending forecast at about 5.4 trillion USD in 2024 and 5.7 trillion USD in 2025 (Gartner), so spend cadence often expands in expansion and tightens in downturns. Transformation, analytics and automation remain priority areas but are frequently re‑phased rather than cut. Counter‑cyclical demand for efficiency lifts benchmarking and advisory work during slowdowns; pipeline should balance cost‑takeout engagements with growth/transformation deals.
Inflation and wage pressures
Rising labor costs—US average hourly earnings up about 4.1% y/y in 2024 (BLS)—compress consulting margins and heighten price sensitivity on projects; rate cards and value-based pricing must reflect scarce digital/data talent and premium pay. Productivity through IP, accelerators and offshore leverage protects margins, while clients demand rapid payback and quantified benefits tied to ROI metrics.

Currency volatility
As a global benchmarking and advisory firm with cross-border revenues and delivery costs, Hackett faces FX exposure that can compress margins when billing currencies misalign with cost bases. BIS reports average daily FX turnover of about 7.5 trillion USD (2022), underscoring market volatility. Robust hedging policies and diversified delivery footprints mitigate risk, and contract clauses (indexation or FX pass-through) can share variability with clients.

M&A and consolidation
Clients’ mergers trigger heavy integration, synergy capture, and operating-model redesign, driving demand for benchmarking and transformation services during deal execution and 12–24 month post-close windows.
Vendor consolidation in tech platforms concentrates spend—AWS, Azure and GCP held roughly 67% of the cloud IaaS/PaaS market in 2024 (Gartner)—raising advisory and implementation needs.
Hackett can monetize pre/post-deal benchmarks to size benefits and cross-sell executive advisory and integration programs during sustained M&A waves.
- Integration-led revenue: benchmarking, transformation, advisory
- Vendor consolidation: top cloud trio ~67% share (Gartner 2024)
- Monetization: pre/post-deal benchmarks to quantify synergies
- Cross-sell: executive advisory during 12–24 month integration
Sectoral cyclicality
Exposure to cyclical industries such as manufacturing and retail alters Hackett project timing and scope as demand swings; global manufacturing PMI hovered near 50 in H1 2025, tightening project pipelines. Defensive sectors like healthcare (US healthcare ~18% of GDP) and utilities deliver steadier pipelines, enabling industry-tailored benchmarks that lift close rates and portfolio balancing stabilizes revenue.
- Sector exposure: cyclical vs defensive
- Benchmarks: industry-specific improve close rates
- Portfolio balance: reduces revenue volatility
Public-sector IT: $500B pipelines, tariffs ~60%, H-1B caps limit talent
Enterprise IT spend ~5.4T USD (2024) and 5.7T USD (2025) (Gartner); budgets track GDP so projects re‑phase in downturns. US average hourly earnings +4.1% y/y (2024), squeezing margins; cloud IaaS/PaaS top three ~67% (2024). Manufacturing PMI ~50 (H1 2025); US healthcare ~18% of GDP stabilizes demand.
| Metric | Value |
|---|---|
| Global IT spend | 5.4T (2024) / 5.7T (2025) |
| US wages | +4.1% y/y (2024) |
| Cloud share | ~67% (2024) |
| Manufacturing PMI | ~50 (H1 2025) |
Preview the Actual Deliverable
Hackett Group PESTLE Analysis
The Hackett Group PESTLE Analysis provides a concise evaluation of political, economic, social, technological, legal, and environmental factors affecting the firm, with actionable insights for strategy and risk management. The preview shown here is the exact document you’ll receive after purchase—fully formatted and ready to use. It is professionally structured and ready for immediate download and application.

Your Shortcut to Market Insight Starts Here
Gain a strategic advantage with our PESTLE Analysis of Hackett Group—uncover how political shifts, economic trends, tech innovation, social change, legal risks, and environmental pressures shape its trajectory; buy the full, ready-to-use report for detailed insights and actionable recommendations you can deploy today.
Political factors
Government digital agendas
Public-sector modernization and national digital strategies are driving demand for benchmarking and transformation advisory as global government IT spending reached about $500B in 2024 (IDC), creating scalable opportunities for Hackett to sell benchmarking services. Alignment with e-government, shared services, and cybersecurity priorities is generating multi-year project pipelines in OECD markets. Hackett can license IP and best practices to help agencies meet policy targets and KPIs. Political shifts can rapidly reprioritize funding and timelines, affecting deal cadence and contract scope.
Public spending and procurement
Budget cycles and procurement rules shape access to government contracts and pipeline timing; US federal contracting obligations were about $787B in FY2023, highlighting scale and timing pressures. Framework agreements, local‑content rules and competitive tendering materially affect win rates and project margins. Mastering compliance and partnering with qualified local firms improves eligibility, while fiscal austerity can delay or shrink scopes.
Geopolitics and data sovereignty
Restrictions on data flows and localization mandates, reinforced by GDPR and the 2020 Schrems II ruling, reshape analytics and managed-services delivery models and push providers toward regional footprints. Cross-border tensions increase risk for multinationals that aggregate operational benchmarks. Regional delivery centers and sovereign-cloud offerings (for example AWS GovCloud, Azure Sovereign) mitigate exposure. Clear data-residency assurances become a competitive differentiator.
Talent mobility and visas
Consulting relies on international experts for complex transformations, but US H-1B caps (85,000 regular plus 20,000 master’s) and frequent work-permit delays alongside heightened political scrutiny constrain staffing and slow project ramp-ups; demand for specialty visas often exceeds the cap several-fold. Building local benches and nearshore hubs reduces dependency, while remote delivery models help sustain utilization and continuity of engagements.
- H-1B cap: 85,000 (+20,000 master’s)
- Visa backlogs and political scrutiny constrain staffing
- Local benches and nearshore hubs lower dependency
- Remote delivery sustains utilization and continuity
Trade policy and vendor ecosystems
- Tariffs impact: ~60% of US imports from China
- CFIUS: >300 filings (2022)
- Action: partner-agnostic benchmarking
- Necessity: continuous supplier monitoring
Public-sector IT: $500B pipelines, tariffs ~60%, H-1B caps limit talent
Public-sector digitalization (global gov IT spend ~$500B in 2024) and stable procurement create multi-year advisory pipelines, but political shifts and austerity can reallocate funding. Data localization/GDPR and trade/security actions (tariffs ~60% of China imports; CFIUS >300 filings in 2022) raise delivery and partner risks. Visa caps (H-1B 85,000+20,000 master’s) constrain staffing; nearshore and sovereign-cloud mitigate.
| Metric | Value |
|---|---|
| Global gov IT spend (2024) | $500B (IDC) |
| US federal contracting (FY2023) | $787B |
| H-1B cap | 85,000+20,000 |
| Tariff exposure | ~60% (US imports from China) |
| CFIUS filings (2022) | >300 |
What is included in the product
Detailed Word Document
Explores how external macro-environmental factors uniquely affect The Hackett Group across Political, Economic, Social, Technological, Environmental, and Legal dimensions, with data-backed insights and forward-looking implications for scenario planning. Designed for executives, consultants, and investors, the analysis is industry- and region-specific and formatted for immediate use in plans, decks, or reports.
Customizable Excel Spreadsheet
A clean, visually segmented Hackett Group PESTLE summary that’s easy to drop into presentations, editable for local context, and ideal for quick team alignment.
Economic factors
IT spending cycles
Enterprise tech budgets track GDP and corporate earnings, with worldwide IT spending forecast at about 5.4 trillion USD in 2024 and 5.7 trillion USD in 2025 (Gartner), so spend cadence often expands in expansion and tightens in downturns. Transformation, analytics and automation remain priority areas but are frequently re‑phased rather than cut. Counter‑cyclical demand for efficiency lifts benchmarking and advisory work during slowdowns; pipeline should balance cost‑takeout engagements with growth/transformation deals.
Inflation and wage pressures
Rising labor costs—US average hourly earnings up about 4.1% y/y in 2024 (BLS)—compress consulting margins and heighten price sensitivity on projects; rate cards and value-based pricing must reflect scarce digital/data talent and premium pay. Productivity through IP, accelerators and offshore leverage protects margins, while clients demand rapid payback and quantified benefits tied to ROI metrics.
Currency volatility
As a global benchmarking and advisory firm with cross-border revenues and delivery costs, Hackett faces FX exposure that can compress margins when billing currencies misalign with cost bases. BIS reports average daily FX turnover of about 7.5 trillion USD (2022), underscoring market volatility. Robust hedging policies and diversified delivery footprints mitigate risk, and contract clauses (indexation or FX pass-through) can share variability with clients.
M&A and consolidation
Clients’ mergers trigger heavy integration, synergy capture, and operating-model redesign, driving demand for benchmarking and transformation services during deal execution and 12–24 month post-close windows.
Vendor consolidation in tech platforms concentrates spend—AWS, Azure and GCP held roughly 67% of the cloud IaaS/PaaS market in 2024 (Gartner)—raising advisory and implementation needs.
Hackett can monetize pre/post-deal benchmarks to size benefits and cross-sell executive advisory and integration programs during sustained M&A waves.
- Integration-led revenue: benchmarking, transformation, advisory
- Vendor consolidation: top cloud trio ~67% share (Gartner 2024)
- Monetization: pre/post-deal benchmarks to quantify synergies
- Cross-sell: executive advisory during 12–24 month integration
Sectoral cyclicality
Exposure to cyclical industries such as manufacturing and retail alters Hackett project timing and scope as demand swings; global manufacturing PMI hovered near 50 in H1 2025, tightening project pipelines. Defensive sectors like healthcare (US healthcare ~18% of GDP) and utilities deliver steadier pipelines, enabling industry-tailored benchmarks that lift close rates and portfolio balancing stabilizes revenue.
- Sector exposure: cyclical vs defensive
- Benchmarks: industry-specific improve close rates
- Portfolio balance: reduces revenue volatility
Public-sector IT: $500B pipelines, tariffs ~60%, H-1B caps limit talent
Enterprise IT spend ~5.4T USD (2024) and 5.7T USD (2025) (Gartner); budgets track GDP so projects re‑phase in downturns. US average hourly earnings +4.1% y/y (2024), squeezing margins; cloud IaaS/PaaS top three ~67% (2024). Manufacturing PMI ~50 (H1 2025); US healthcare ~18% of GDP stabilizes demand.
| Metric | Value |
|---|---|
| Global IT spend | 5.4T (2024) / 5.7T (2025) |
| US wages | +4.1% y/y (2024) |
| Cloud share | ~67% (2024) |
| Manufacturing PMI | ~50 (H1 2025) |
Preview the Actual Deliverable
Hackett Group PESTLE Analysis
The Hackett Group PESTLE Analysis provides a concise evaluation of political, economic, social, technological, legal, and environmental factors affecting the firm, with actionable insights for strategy and risk management. The preview shown here is the exact document you’ll receive after purchase—fully formatted and ready to use. It is professionally structured and ready for immediate download and application.
Original: $10.00
-65%$10.00
$3.50Description
Your Shortcut to Market Insight Starts Here
Gain a strategic advantage with our PESTLE Analysis of Hackett Group—uncover how political shifts, economic trends, tech innovation, social change, legal risks, and environmental pressures shape its trajectory; buy the full, ready-to-use report for detailed insights and actionable recommendations you can deploy today.
Political factors
Government digital agendas
Public-sector modernization and national digital strategies are driving demand for benchmarking and transformation advisory as global government IT spending reached about $500B in 2024 (IDC), creating scalable opportunities for Hackett to sell benchmarking services. Alignment with e-government, shared services, and cybersecurity priorities is generating multi-year project pipelines in OECD markets. Hackett can license IP and best practices to help agencies meet policy targets and KPIs. Political shifts can rapidly reprioritize funding and timelines, affecting deal cadence and contract scope.
Public spending and procurement
Budget cycles and procurement rules shape access to government contracts and pipeline timing; US federal contracting obligations were about $787B in FY2023, highlighting scale and timing pressures. Framework agreements, local‑content rules and competitive tendering materially affect win rates and project margins. Mastering compliance and partnering with qualified local firms improves eligibility, while fiscal austerity can delay or shrink scopes.
Geopolitics and data sovereignty
Restrictions on data flows and localization mandates, reinforced by GDPR and the 2020 Schrems II ruling, reshape analytics and managed-services delivery models and push providers toward regional footprints. Cross-border tensions increase risk for multinationals that aggregate operational benchmarks. Regional delivery centers and sovereign-cloud offerings (for example AWS GovCloud, Azure Sovereign) mitigate exposure. Clear data-residency assurances become a competitive differentiator.
Talent mobility and visas
Consulting relies on international experts for complex transformations, but US H-1B caps (85,000 regular plus 20,000 master’s) and frequent work-permit delays alongside heightened political scrutiny constrain staffing and slow project ramp-ups; demand for specialty visas often exceeds the cap several-fold. Building local benches and nearshore hubs reduces dependency, while remote delivery models help sustain utilization and continuity of engagements.
- H-1B cap: 85,000 (+20,000 master’s)
- Visa backlogs and political scrutiny constrain staffing
- Local benches and nearshore hubs lower dependency
- Remote delivery sustains utilization and continuity
Trade policy and vendor ecosystems
- Tariffs impact: ~60% of US imports from China
- CFIUS: >300 filings (2022)
- Action: partner-agnostic benchmarking
- Necessity: continuous supplier monitoring
Public-sector IT: $500B pipelines, tariffs ~60%, H-1B caps limit talent
Public-sector digitalization (global gov IT spend ~$500B in 2024) and stable procurement create multi-year advisory pipelines, but political shifts and austerity can reallocate funding. Data localization/GDPR and trade/security actions (tariffs ~60% of China imports; CFIUS >300 filings in 2022) raise delivery and partner risks. Visa caps (H-1B 85,000+20,000 master’s) constrain staffing; nearshore and sovereign-cloud mitigate.
| Metric | Value |
|---|---|
| Global gov IT spend (2024) | $500B (IDC) |
| US federal contracting (FY2023) | $787B |
| H-1B cap | 85,000+20,000 |
| Tariff exposure | ~60% (US imports from China) |
| CFIUS filings (2022) | >300 |
What is included in the product
Detailed Word Document
Explores how external macro-environmental factors uniquely affect The Hackett Group across Political, Economic, Social, Technological, Environmental, and Legal dimensions, with data-backed insights and forward-looking implications for scenario planning. Designed for executives, consultants, and investors, the analysis is industry- and region-specific and formatted for immediate use in plans, decks, or reports.
Customizable Excel Spreadsheet
A clean, visually segmented Hackett Group PESTLE summary that’s easy to drop into presentations, editable for local context, and ideal for quick team alignment.
Economic factors
IT spending cycles
Enterprise tech budgets track GDP and corporate earnings, with worldwide IT spending forecast at about 5.4 trillion USD in 2024 and 5.7 trillion USD in 2025 (Gartner), so spend cadence often expands in expansion and tightens in downturns. Transformation, analytics and automation remain priority areas but are frequently re‑phased rather than cut. Counter‑cyclical demand for efficiency lifts benchmarking and advisory work during slowdowns; pipeline should balance cost‑takeout engagements with growth/transformation deals.
Inflation and wage pressures
Rising labor costs—US average hourly earnings up about 4.1% y/y in 2024 (BLS)—compress consulting margins and heighten price sensitivity on projects; rate cards and value-based pricing must reflect scarce digital/data talent and premium pay. Productivity through IP, accelerators and offshore leverage protects margins, while clients demand rapid payback and quantified benefits tied to ROI metrics.
Currency volatility
As a global benchmarking and advisory firm with cross-border revenues and delivery costs, Hackett faces FX exposure that can compress margins when billing currencies misalign with cost bases. BIS reports average daily FX turnover of about 7.5 trillion USD (2022), underscoring market volatility. Robust hedging policies and diversified delivery footprints mitigate risk, and contract clauses (indexation or FX pass-through) can share variability with clients.
M&A and consolidation
Clients’ mergers trigger heavy integration, synergy capture, and operating-model redesign, driving demand for benchmarking and transformation services during deal execution and 12–24 month post-close windows.
Vendor consolidation in tech platforms concentrates spend—AWS, Azure and GCP held roughly 67% of the cloud IaaS/PaaS market in 2024 (Gartner)—raising advisory and implementation needs.
Hackett can monetize pre/post-deal benchmarks to size benefits and cross-sell executive advisory and integration programs during sustained M&A waves.
- Integration-led revenue: benchmarking, transformation, advisory
- Vendor consolidation: top cloud trio ~67% share (Gartner 2024)
- Monetization: pre/post-deal benchmarks to quantify synergies
- Cross-sell: executive advisory during 12–24 month integration
Sectoral cyclicality
Exposure to cyclical industries such as manufacturing and retail alters Hackett project timing and scope as demand swings; global manufacturing PMI hovered near 50 in H1 2025, tightening project pipelines. Defensive sectors like healthcare (US healthcare ~18% of GDP) and utilities deliver steadier pipelines, enabling industry-tailored benchmarks that lift close rates and portfolio balancing stabilizes revenue.
- Sector exposure: cyclical vs defensive
- Benchmarks: industry-specific improve close rates
- Portfolio balance: reduces revenue volatility
Public-sector IT: $500B pipelines, tariffs ~60%, H-1B caps limit talent
Enterprise IT spend ~5.4T USD (2024) and 5.7T USD (2025) (Gartner); budgets track GDP so projects re‑phase in downturns. US average hourly earnings +4.1% y/y (2024), squeezing margins; cloud IaaS/PaaS top three ~67% (2024). Manufacturing PMI ~50 (H1 2025); US healthcare ~18% of GDP stabilizes demand.
| Metric | Value |
|---|---|
| Global IT spend | 5.4T (2024) / 5.7T (2025) |
| US wages | +4.1% y/y (2024) |
| Cloud share | ~67% (2024) |
| Manufacturing PMI | ~50 (H1 2025) |
Preview the Actual Deliverable
Hackett Group PESTLE Analysis
The Hackett Group PESTLE Analysis provides a concise evaluation of political, economic, social, technological, legal, and environmental factors affecting the firm, with actionable insights for strategy and risk management. The preview shown here is the exact document you’ll receive after purchase—fully formatted and ready to use. It is professionally structured and ready for immediate download and application.











