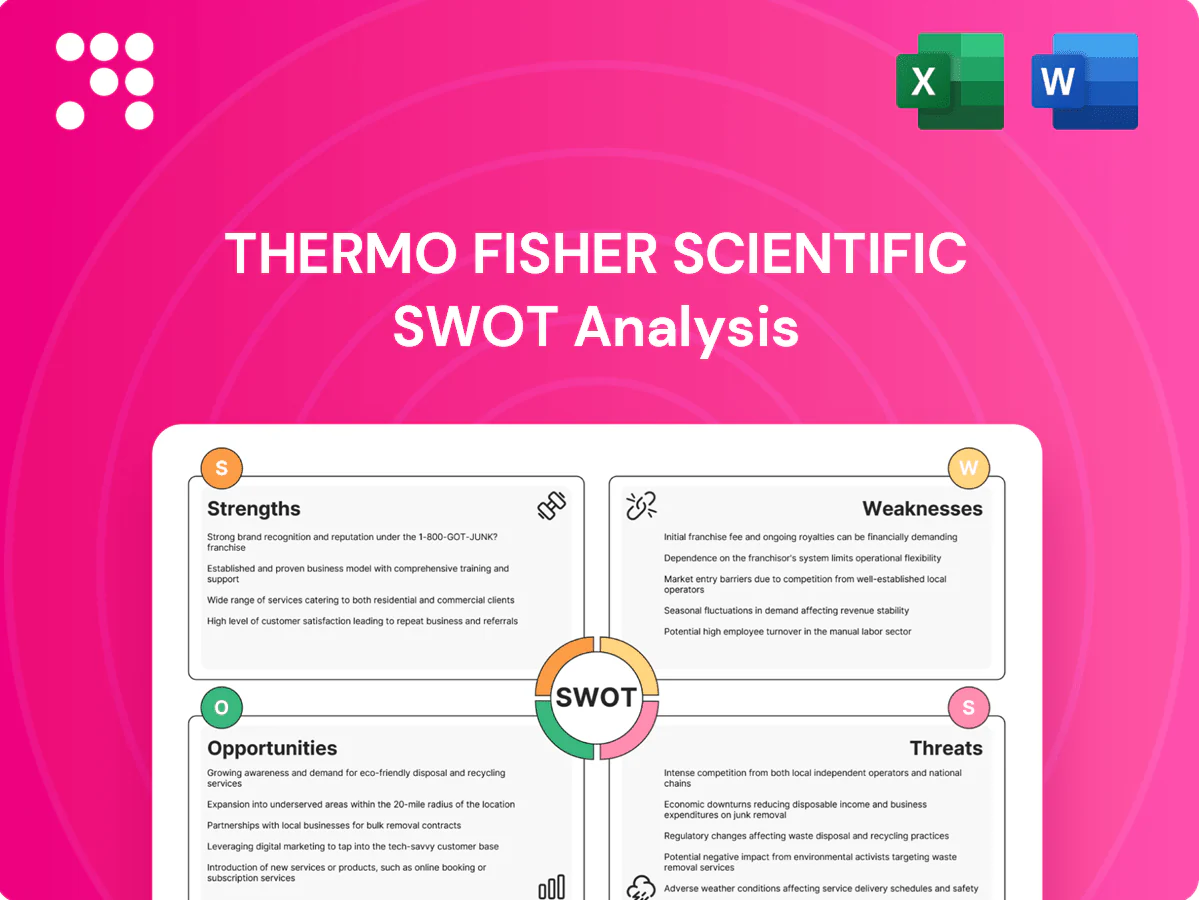
Thermo Fisher Scientific SWOT Analysis

Go Beyond the Preview—Access the Full Strategic Report
Thermo Fisher Scientific’s SWOT highlights unmatched scale in life sciences and strong R&D-driven growth, balanced by integration risks, regulatory exposure, and competitive pricing pressure; opportunites include diagnostics expansion and digital lab services. Want the full story behind the company’s strengths, risks, and growth drivers? Purchase the complete SWOT analysis to gain a professionally written, editable report for strategy and investment decisions.
Strengths

Global scale
Thermo Fisher operates across instruments, reagents, consumables, software and services with presence in 50+ countries and about 100,000 employees (2024), giving worldwide reach. Its broad geographic footprint cushions regional demand shocks and accelerates innovation diffusion across 150+ markets. Scale yields procurement advantages and faster time-to-market, while customers gain a one-stop partner across research, diagnostics and industrial applications.
Diversified portfolio
Thermo Fisher’s exposure across pharma, biotech, academia, government and industrial end-markets reduces cyclicality, smoothing demand through research and commercial cycles. Recurring consumables — roughly 60% of sales — plus balanced equipment revenue stabilize cash flows and margins. Integrated solutions from discovery to manufacturing boost wallet share, while cross-selling strengthens account stickiness and lifetime value.

Installed base & recurring
Thermo Fisher’s large installed base—serving more than 1.8 million customers worldwide—drives high‑margin consumables and service pull‑through. Service contracts and software subscriptions deepen customer relationships and stickiness. Recurring revenue enhances visibility for planning and cash flow. Regular instrument upgrades and replacements create predictable embedded growth.

Brand & trust
Thermo Fisher is a trusted provider for critical workflows in regulated clinical and pharma labs; its scale (2024 revenue > $40 billion) and Fortune 500 status underpin premium positioning. Strong quality systems and consistent compliance reduce audit risk and support higher margins. Deep application support and field service reduce switching risk for mission-critical labs.
- Trusted provider: regulated workflows
- 2024 revenue > $40B, Fortune 500
- Proven compliance, premium pricing
- Application support lowers switching risk
M&A and integration
Thermo Fisher has proven capability to identify, acquire, and integrate strategic assets, exemplified by the 2021 PPD acquisition for $17.4 billion; portfolio shaping has accelerated entry into high-margin niches such as clinical trial services and cell therapy supply chains.
Synergies from targeted M&A enhance margins and technology depth while a disciplined integration playbook—aimed at preserving customer experience—supports retention and cross-sell expansion.
- PPD acquisition: $17.4 billion
- Portfolio-driven entry into clinical trials and cell therapy niches
- Synergies boost margins and tech capabilities
- Disciplined integration playbook preserves customer experience
Global scale - >$40B revenue, ~100k employees, >1.8M customers
Global scale: 2024 revenue > $40B, ~100,000 employees, presence in 50+ countries and 150+ markets; one-stop portfolio across instruments, consumables, software and services. Recurring consumables ~60% of sales and >1.8M customers drive predictable cash flow and high-margin pull-through. Strong regulated-market positioning, proven M&A (PPD $17.4B) and disciplined integration boost margins and cross‑sell.
| Metric | Value (2024) |
|---|---|
| Revenue | > $40B |
| Employees | ~100,000 |
| Customers | >1.8M |
| Consumables % Sales | ~60% |
| Major M&A | PPD $17.4B |
What is included in the product
 Detailed Word Document
Delivers a strategic overview of Thermo Fisher Scientific’s internal strengths and weaknesses and maps external opportunities and threats shaping its competitive position, innovation pipeline, and regulatory exposure. Offers actionable insights into growth drivers, operational gaps, and market risks to inform strategic decisions.

 Customizable Excel Spreadsheet
Provides a concise SWOT matrix for Thermo Fisher Scientific to quickly identify strengths, weaknesses, opportunities and threats, easing strategic alignment and enabling fast stakeholder briefings and prioritization.
Weaknesses

Portfolio complexity
Thermo Fisher's vast portfolio—thousands of instruments, consumables and services—raises operational complexity and overhead, amplified by ~130,000 employees across 50+ countries. Managing diverse product lifecycles strains R&D prioritization and resource allocation, slowing decision-making and diluting strategic focus. Overlapping lines risk internal competition and margin erosion during integrations.
Premium pricing
Thermo Fisher’s strong value proposition often carries premium pricing, contributing to company revenue of about $48 billion in FY2024 but creating sales friction; procurement consolidation and tender-driven buying commonly force discounts of 5–15%, squeezing margins. Price sensitivity in academia and emerging markets limits penetration, while nimble competitors undercut prices to capture share.

M&A dependence
Growth partly relies on acquisitions to fill capability gaps, exemplified by the $17.4 billion PPD purchase in 2021, which accelerates breadth but raises dependence on deal flow.
Integration missteps can disrupt customers and culture, and elevated deal volume heightens execution and valuation risks for management.
Continued M&A has driven large goodwill and intangible balances, increasing impairment exposure if synergies underperform.

Exposure to funding cycles
Exposure to funding cycles constrains Thermo Fisher as academic and government R&D budgets swing—NIH funding stood at about 48.3 billion USD in FY2024—while biotech venture funding fell roughly 38% in 2023, delaying capex and project starts. Clinical labs may defer instrument purchases amid reimbursement uncertainty, and pharma pipeline pauses directly reduce demand for consumables and instruments.
- Academic/government: NIH ~48.3B USD (FY2024)
- Biotech VC: −~38% in 2023, slowing capex
- Clinical: deferred purchases from reimbursement risk
- Pipeline pauses: lower instrument/consumable demand
Supply chain intensity
Complex global supply chains for specialized components heighten risk for Thermo Fisher, stressing logistics and sourcing for its high-margin instruments; the company reported $44.82 billion in revenue in FY2023, amplifying exposure to supply disruptions. Cold-chain and strict quality requirements drive elevated operating costs and capital investments. Disruptions can extend lead times and backlog while multi-jurisdictional compliance adds friction and delays.
- Supply-chain complexity: specialized parts, global sourcing
- Cold-chain cost pressure: refrigerated logistics and validation
- Operational risk: longer lead times, potential backlog
- Regulatory friction: cross-border compliance burdens
Global complexity slows R&D, risks margins despite ~48B USD revenue
Operational complexity across ~130,000 staff and 50+ countries raises overhead and slows R&D prioritization; overlapping product lines risk margin erosion during integrations. Premium pricing limits penetration in academia/emerging markets despite ~48B USD revenue (FY2024), while heavy M&A (PPD $17.4B) increases goodwill and impairment exposure.
| Metric | Value |
|---|---|
| Revenue (FY2024) | ~48B USD |
| Employees | ~130,000 |
| PPD acquisition | 17.4B USD |
Same Document Delivered
Thermo Fisher Scientific SWOT Analysis
This is the actual SWOT analysis document you’ll receive upon purchase—no surprises, just professional quality. The preview below is taken directly from the full SWOT report you'll get; purchase unlocks the entire in-depth version. The file is editable and ready to use immediately after checkout.

Go Beyond the Preview—Access the Full Strategic Report
Thermo Fisher Scientific’s SWOT highlights unmatched scale in life sciences and strong R&D-driven growth, balanced by integration risks, regulatory exposure, and competitive pricing pressure; opportunites include diagnostics expansion and digital lab services. Want the full story behind the company’s strengths, risks, and growth drivers? Purchase the complete SWOT analysis to gain a professionally written, editable report for strategy and investment decisions.
Strengths
Global scale
Thermo Fisher operates across instruments, reagents, consumables, software and services with presence in 50+ countries and about 100,000 employees (2024), giving worldwide reach. Its broad geographic footprint cushions regional demand shocks and accelerates innovation diffusion across 150+ markets. Scale yields procurement advantages and faster time-to-market, while customers gain a one-stop partner across research, diagnostics and industrial applications.
Diversified portfolio
Thermo Fisher’s exposure across pharma, biotech, academia, government and industrial end-markets reduces cyclicality, smoothing demand through research and commercial cycles. Recurring consumables — roughly 60% of sales — plus balanced equipment revenue stabilize cash flows and margins. Integrated solutions from discovery to manufacturing boost wallet share, while cross-selling strengthens account stickiness and lifetime value.
Installed base & recurring
Thermo Fisher’s large installed base—serving more than 1.8 million customers worldwide—drives high‑margin consumables and service pull‑through. Service contracts and software subscriptions deepen customer relationships and stickiness. Recurring revenue enhances visibility for planning and cash flow. Regular instrument upgrades and replacements create predictable embedded growth.
Brand & trust
Thermo Fisher is a trusted provider for critical workflows in regulated clinical and pharma labs; its scale (2024 revenue > $40 billion) and Fortune 500 status underpin premium positioning. Strong quality systems and consistent compliance reduce audit risk and support higher margins. Deep application support and field service reduce switching risk for mission-critical labs.
- Trusted provider: regulated workflows
- 2024 revenue > $40B, Fortune 500
- Proven compliance, premium pricing
- Application support lowers switching risk
M&A and integration
Thermo Fisher has proven capability to identify, acquire, and integrate strategic assets, exemplified by the 2021 PPD acquisition for $17.4 billion; portfolio shaping has accelerated entry into high-margin niches such as clinical trial services and cell therapy supply chains.
Synergies from targeted M&A enhance margins and technology depth while a disciplined integration playbook—aimed at preserving customer experience—supports retention and cross-sell expansion.
- PPD acquisition: $17.4 billion
- Portfolio-driven entry into clinical trials and cell therapy niches
- Synergies boost margins and tech capabilities
- Disciplined integration playbook preserves customer experience
Global scale - >$40B revenue, ~100k employees, >1.8M customers
Global scale: 2024 revenue > $40B, ~100,000 employees, presence in 50+ countries and 150+ markets; one-stop portfolio across instruments, consumables, software and services. Recurring consumables ~60% of sales and >1.8M customers drive predictable cash flow and high-margin pull-through. Strong regulated-market positioning, proven M&A (PPD $17.4B) and disciplined integration boost margins and cross‑sell.
| Metric | Value (2024) |
|---|---|
| Revenue | > $40B |
| Employees | ~100,000 |
| Customers | >1.8M |
| Consumables % Sales | ~60% |
| Major M&A | PPD $17.4B |
What is included in the product
Detailed Word Document
Delivers a strategic overview of Thermo Fisher Scientific’s internal strengths and weaknesses and maps external opportunities and threats shaping its competitive position, innovation pipeline, and regulatory exposure. Offers actionable insights into growth drivers, operational gaps, and market risks to inform strategic decisions.
Customizable Excel Spreadsheet
Provides a concise SWOT matrix for Thermo Fisher Scientific to quickly identify strengths, weaknesses, opportunities and threats, easing strategic alignment and enabling fast stakeholder briefings and prioritization.
Weaknesses
Portfolio complexity
Thermo Fisher's vast portfolio—thousands of instruments, consumables and services—raises operational complexity and overhead, amplified by ~130,000 employees across 50+ countries. Managing diverse product lifecycles strains R&D prioritization and resource allocation, slowing decision-making and diluting strategic focus. Overlapping lines risk internal competition and margin erosion during integrations.
Premium pricing
Thermo Fisher’s strong value proposition often carries premium pricing, contributing to company revenue of about $48 billion in FY2024 but creating sales friction; procurement consolidation and tender-driven buying commonly force discounts of 5–15%, squeezing margins. Price sensitivity in academia and emerging markets limits penetration, while nimble competitors undercut prices to capture share.
M&A dependence
Growth partly relies on acquisitions to fill capability gaps, exemplified by the $17.4 billion PPD purchase in 2021, which accelerates breadth but raises dependence on deal flow.
Integration missteps can disrupt customers and culture, and elevated deal volume heightens execution and valuation risks for management.
Continued M&A has driven large goodwill and intangible balances, increasing impairment exposure if synergies underperform.
Exposure to funding cycles
Exposure to funding cycles constrains Thermo Fisher as academic and government R&D budgets swing—NIH funding stood at about 48.3 billion USD in FY2024—while biotech venture funding fell roughly 38% in 2023, delaying capex and project starts. Clinical labs may defer instrument purchases amid reimbursement uncertainty, and pharma pipeline pauses directly reduce demand for consumables and instruments.
- Academic/government: NIH ~48.3B USD (FY2024)
- Biotech VC: −~38% in 2023, slowing capex
- Clinical: deferred purchases from reimbursement risk
- Pipeline pauses: lower instrument/consumable demand
Supply chain intensity
Complex global supply chains for specialized components heighten risk for Thermo Fisher, stressing logistics and sourcing for its high-margin instruments; the company reported $44.82 billion in revenue in FY2023, amplifying exposure to supply disruptions. Cold-chain and strict quality requirements drive elevated operating costs and capital investments. Disruptions can extend lead times and backlog while multi-jurisdictional compliance adds friction and delays.
- Supply-chain complexity: specialized parts, global sourcing
- Cold-chain cost pressure: refrigerated logistics and validation
- Operational risk: longer lead times, potential backlog
- Regulatory friction: cross-border compliance burdens
Global complexity slows R&D, risks margins despite ~48B USD revenue
Operational complexity across ~130,000 staff and 50+ countries raises overhead and slows R&D prioritization; overlapping product lines risk margin erosion during integrations. Premium pricing limits penetration in academia/emerging markets despite ~48B USD revenue (FY2024), while heavy M&A (PPD $17.4B) increases goodwill and impairment exposure.
| Metric | Value |
|---|---|
| Revenue (FY2024) | ~48B USD |
| Employees | ~130,000 |
| PPD acquisition | 17.4B USD |
Same Document Delivered
Thermo Fisher Scientific SWOT Analysis
This is the actual SWOT analysis document you’ll receive upon purchase—no surprises, just professional quality. The preview below is taken directly from the full SWOT report you'll get; purchase unlocks the entire in-depth version. The file is editable and ready to use immediately after checkout.
Original: $10.00
-65%$10.00
$3.50Description
Go Beyond the Preview—Access the Full Strategic Report
Thermo Fisher Scientific’s SWOT highlights unmatched scale in life sciences and strong R&D-driven growth, balanced by integration risks, regulatory exposure, and competitive pricing pressure; opportunites include diagnostics expansion and digital lab services. Want the full story behind the company’s strengths, risks, and growth drivers? Purchase the complete SWOT analysis to gain a professionally written, editable report for strategy and investment decisions.
Strengths
Global scale
Thermo Fisher operates across instruments, reagents, consumables, software and services with presence in 50+ countries and about 100,000 employees (2024), giving worldwide reach. Its broad geographic footprint cushions regional demand shocks and accelerates innovation diffusion across 150+ markets. Scale yields procurement advantages and faster time-to-market, while customers gain a one-stop partner across research, diagnostics and industrial applications.
Diversified portfolio
Thermo Fisher’s exposure across pharma, biotech, academia, government and industrial end-markets reduces cyclicality, smoothing demand through research and commercial cycles. Recurring consumables — roughly 60% of sales — plus balanced equipment revenue stabilize cash flows and margins. Integrated solutions from discovery to manufacturing boost wallet share, while cross-selling strengthens account stickiness and lifetime value.
Installed base & recurring
Thermo Fisher’s large installed base—serving more than 1.8 million customers worldwide—drives high‑margin consumables and service pull‑through. Service contracts and software subscriptions deepen customer relationships and stickiness. Recurring revenue enhances visibility for planning and cash flow. Regular instrument upgrades and replacements create predictable embedded growth.
Brand & trust
Thermo Fisher is a trusted provider for critical workflows in regulated clinical and pharma labs; its scale (2024 revenue > $40 billion) and Fortune 500 status underpin premium positioning. Strong quality systems and consistent compliance reduce audit risk and support higher margins. Deep application support and field service reduce switching risk for mission-critical labs.
- Trusted provider: regulated workflows
- 2024 revenue > $40B, Fortune 500
- Proven compliance, premium pricing
- Application support lowers switching risk
M&A and integration
Thermo Fisher has proven capability to identify, acquire, and integrate strategic assets, exemplified by the 2021 PPD acquisition for $17.4 billion; portfolio shaping has accelerated entry into high-margin niches such as clinical trial services and cell therapy supply chains.
Synergies from targeted M&A enhance margins and technology depth while a disciplined integration playbook—aimed at preserving customer experience—supports retention and cross-sell expansion.
- PPD acquisition: $17.4 billion
- Portfolio-driven entry into clinical trials and cell therapy niches
- Synergies boost margins and tech capabilities
- Disciplined integration playbook preserves customer experience
Global scale - >$40B revenue, ~100k employees, >1.8M customers
Global scale: 2024 revenue > $40B, ~100,000 employees, presence in 50+ countries and 150+ markets; one-stop portfolio across instruments, consumables, software and services. Recurring consumables ~60% of sales and >1.8M customers drive predictable cash flow and high-margin pull-through. Strong regulated-market positioning, proven M&A (PPD $17.4B) and disciplined integration boost margins and cross‑sell.
| Metric | Value (2024) |
|---|---|
| Revenue | > $40B |
| Employees | ~100,000 |
| Customers | >1.8M |
| Consumables % Sales | ~60% |
| Major M&A | PPD $17.4B |
What is included in the product
Detailed Word Document
Delivers a strategic overview of Thermo Fisher Scientific’s internal strengths and weaknesses and maps external opportunities and threats shaping its competitive position, innovation pipeline, and regulatory exposure. Offers actionable insights into growth drivers, operational gaps, and market risks to inform strategic decisions.
Customizable Excel Spreadsheet
Provides a concise SWOT matrix for Thermo Fisher Scientific to quickly identify strengths, weaknesses, opportunities and threats, easing strategic alignment and enabling fast stakeholder briefings and prioritization.
Weaknesses
Portfolio complexity
Thermo Fisher's vast portfolio—thousands of instruments, consumables and services—raises operational complexity and overhead, amplified by ~130,000 employees across 50+ countries. Managing diverse product lifecycles strains R&D prioritization and resource allocation, slowing decision-making and diluting strategic focus. Overlapping lines risk internal competition and margin erosion during integrations.
Premium pricing
Thermo Fisher’s strong value proposition often carries premium pricing, contributing to company revenue of about $48 billion in FY2024 but creating sales friction; procurement consolidation and tender-driven buying commonly force discounts of 5–15%, squeezing margins. Price sensitivity in academia and emerging markets limits penetration, while nimble competitors undercut prices to capture share.
M&A dependence
Growth partly relies on acquisitions to fill capability gaps, exemplified by the $17.4 billion PPD purchase in 2021, which accelerates breadth but raises dependence on deal flow.
Integration missteps can disrupt customers and culture, and elevated deal volume heightens execution and valuation risks for management.
Continued M&A has driven large goodwill and intangible balances, increasing impairment exposure if synergies underperform.
Exposure to funding cycles
Exposure to funding cycles constrains Thermo Fisher as academic and government R&D budgets swing—NIH funding stood at about 48.3 billion USD in FY2024—while biotech venture funding fell roughly 38% in 2023, delaying capex and project starts. Clinical labs may defer instrument purchases amid reimbursement uncertainty, and pharma pipeline pauses directly reduce demand for consumables and instruments.
- Academic/government: NIH ~48.3B USD (FY2024)
- Biotech VC: −~38% in 2023, slowing capex
- Clinical: deferred purchases from reimbursement risk
- Pipeline pauses: lower instrument/consumable demand
Supply chain intensity
Complex global supply chains for specialized components heighten risk for Thermo Fisher, stressing logistics and sourcing for its high-margin instruments; the company reported $44.82 billion in revenue in FY2023, amplifying exposure to supply disruptions. Cold-chain and strict quality requirements drive elevated operating costs and capital investments. Disruptions can extend lead times and backlog while multi-jurisdictional compliance adds friction and delays.
- Supply-chain complexity: specialized parts, global sourcing
- Cold-chain cost pressure: refrigerated logistics and validation
- Operational risk: longer lead times, potential backlog
- Regulatory friction: cross-border compliance burdens
Global complexity slows R&D, risks margins despite ~48B USD revenue
Operational complexity across ~130,000 staff and 50+ countries raises overhead and slows R&D prioritization; overlapping product lines risk margin erosion during integrations. Premium pricing limits penetration in academia/emerging markets despite ~48B USD revenue (FY2024), while heavy M&A (PPD $17.4B) increases goodwill and impairment exposure.
| Metric | Value |
|---|---|
| Revenue (FY2024) | ~48B USD |
| Employees | ~130,000 |
| PPD acquisition | 17.4B USD |
Same Document Delivered
Thermo Fisher Scientific SWOT Analysis
This is the actual SWOT analysis document you’ll receive upon purchase—no surprises, just professional quality. The preview below is taken directly from the full SWOT report you'll get; purchase unlocks the entire in-depth version. The file is editable and ready to use immediately after checkout.











