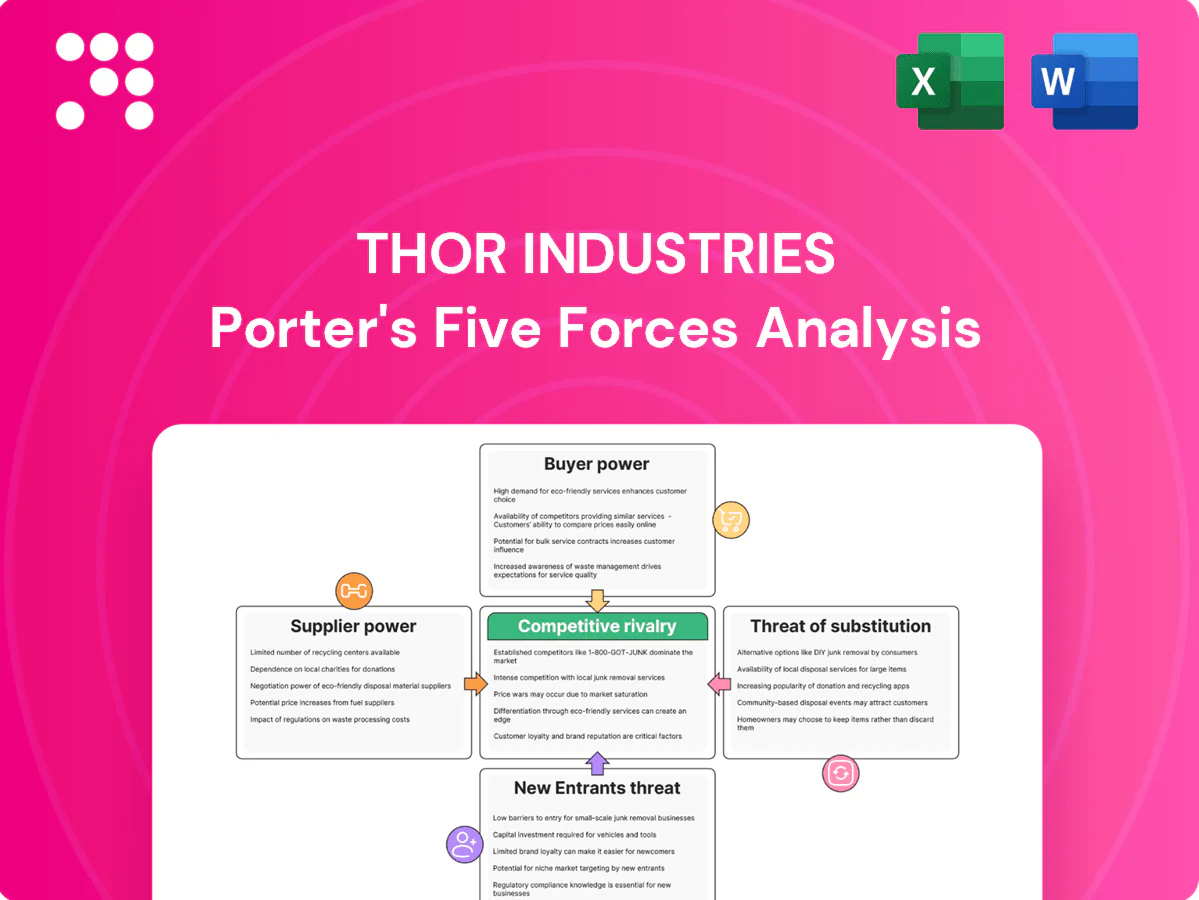
THOR Industries Porter's Five Forces Analysis

From Overview to Strategy Blueprint
THOR Industries faces intense buyer power and moderate supplier influence as scale and brand loyalty shape bargaining dynamics, while new entrants and substitutes present manageable threats due to capital intensity and product differentiation. Competitive rivalry remains high among established OEMs. Unlock the full Porter's Five Forces Analysis to explore THOR Industries’s competitive dynamics in detail.
Suppliers Bargaining Power

Concentrated key component vendors
THOR depends on a concentrated set of chassis and critical-component suppliers (Ford, Mercedes-Benz, Stellantis, Lippert, Dometic), exposing it to supplier leverage on pricing, lead times and allocations; THOR reported roughly $11.5 billion in 2024 revenue, amplifying the impact of supplier constraints. Switching costs are high due to engineering integration and certification, so THOR pursues multi-sourcing where feasible and uses scale-driven negotiations to mitigate risk and secure allocations.
Volatile input commodities
Steel, aluminum, lumber, resins and foam face pronounced price swings, with suppliers able to pass through increases and compress THOR Industries' margins during upcycles; THOR reported margin pressure from commodity inflation in 2022–24. Long-term contracts and hedging reduced but did not eliminate volatility. THOR's scale purchasing partially offsets supplier bargaining power, yet input cost pass-through remains a recurring margin risk.

Specialized components and compliance
RV systems (HVAC, electrical, safety, emissions) require certified parts and vendor expertise, and THOR faced this supplier specialization amid its reported roughly $12.3 billion 2024 revenue, limiting volume-driven leverage.
Regulatory and warranty requirements legally restrict substitution, so unique component suppliers command premium pricing and lead-time control, raising their bargaining power.
THOR’s engineering depth and in-house testing reduce but do not eliminate dependency on certified vendors for critical assemblies.

Logistics and capacity constraints
Capacity tightness and shipping bottlenecks during demand spikes shift pricing power to suppliers, with component lead times often stretching 8–12 weeks, forcing THOR to carry higher inventory or pay rush premiums to meet production.
Brand and technology influence
- Brand premiums raise component costs
- Telematics/software increase switching costs
- Co-development = mutual dependence
- Cross-platform design preserves optionality
Concentrated suppliers, commodity swings and 8-12 week lead times threaten margins of $12.3B OEM
THOR relies on concentrated chassis and critical-component suppliers (Ford, Mercedes-Benz, Stellantis, Lippert, Dometic), giving suppliers pricing and allocation leverage; with 2024 revenue $12.3B this exposure can materially affect margins. High switching costs, certification needs and branded components increase supplier power despite THOR's scale, hedging and long-term contracts. Commodity volatility (steel, aluminum, lumber) and 8–12 week lead times sustain supplier pressure and inventory/rush-cost risk.
| Metric | 2024 | Impact |
|---|---|---|
| Revenue | $12.3B | Amplifies supplier risk |
| Lead times | 8–12 weeks | Raises inventory/rush costs |
| Commodity pressure | 2022–24 margin impact | Pass-through limits |
What is included in the product
 Detailed Word Document
Uncovers key drivers of competition, customer influence, and market entry risks tailored exclusively to THOR Industries, analyzing its position within the RV and leisure-vehicle competitive landscape. Evaluates supplier and buyer power, substitutes, and disruptive threats that influence THOR’s pricing, margins, and strategic resilience.

 Customizable Excel Spreadsheet
A clear, one-sheet Porter's Five Forces summary for THOR Industries—perfect for quick decision-making, easily customize pressure levels for shifting RV market trends and copy into pitch decks or boardroom slides.
Customers Bargaining Power

Dealer-centric channel
Independent dealers aggregate local demand and materially influence THOR’s model mix and pricing, with large dealer groups capturing over 50% of retail RV sales in 2024 and using scale to negotiate better margins and floorplan support. Dealer inventory health (shortages or bloated lots) directly alters THOR’s production cadence and working capital needs. THOR mitigates concentration risk through broad dealer coverage across North America and Europe.
End-consumer price sensitivity
RV purchases are discretionary and cyclical, making demand highly price elastic; 2024 retail unit sales remained roughly 30% below the 2018–2021 peak, amplifying buyer sensitivity. Consumers extensively cross-shop brands and models online, raising pricing transparency, while promotions and financing (increasingly central to conversions) sway purchase timing. THOR mitigates this by offering tiered portfolios across price points to capture different segments.

Aftermarket and service expectations
Buyers demand ready parts availability and responsive warranties; service quality directly drives repeat purchases and dealer leverage. Strong aftermarket programs and certified service networks reduce switching power by increasing lock-in. THOR’s scale — supported by over 1,700 dealer locations in 2024 — underpins broad parts distribution and warranty support.

Information availability
Reviews, forums, and social media amplify consumer voice, and in 2024 about 88% of buyers consult online reviews, making specifications and pricing highly comparable; this transparency lowers switching costs and strengthens buyer power. THOR offsets this by investing in product differentiation and brand equity, maintaining premium positioning and dealer networks to retain margins.
- Reviews amplify voice (2024: 88% consult reviews)
- Specs/pricing comparable → lower switching costs
- Stronger buyer power
- THOR invests in differentiation & brand equity
Financing dependence
Financing dependence: retail and dealer floorplan financing conditions directly shape affordability and ordering for THOR; in 2024 dealer credit tightening contributed to softer retail demand and deferred purchases, increasing buyer leverage. THOR saw incentive spending rise to preserve volume, while lender partnerships helped sustain throughput and used-vehicle trade activity.
- 2024: elevated incentive spend
- Dealer floorplan tightness = higher buyer power
- Strategic lender partnerships maintained distribution
Independent dealers drive pricing as retail demand lags, reviews shape buyer choices
Independent dealers (large groups >50% of retail sales in 2024) heavily influence THOR’s pricing, model mix and production; dealer inventory swings and floorplan tightening in 2024 tightened orders. Retail demand remained ~30% below the 2018–21 peak in 2024, raising price sensitivity while 88% of buyers consult online reviews. THOR’s 1,700+ dealers and elevated incentive/finance support in 2024 mitigate buyer leverage.
| Metric | 2024 |
|---|---|
| Dealer concentration | >50% |
| Retail sales vs peak | -30% |
| Buyers consulting reviews | 88% |
| Dealer locations | 1,700+ |
Same Document Delivered
THOR Industries Porter's Five Forces Analysis
This preview displays the full THOR Industries Porter’s Five Forces analysis you’ll receive—no placeholders or excerpts. The document is professionally formatted, immediately downloadable upon purchase. It covers competitive rivalry, supplier and buyer power, threats of entry and substitutes. What you see is exactly what you’ll get.

From Overview to Strategy Blueprint
THOR Industries faces intense buyer power and moderate supplier influence as scale and brand loyalty shape bargaining dynamics, while new entrants and substitutes present manageable threats due to capital intensity and product differentiation. Competitive rivalry remains high among established OEMs. Unlock the full Porter's Five Forces Analysis to explore THOR Industries’s competitive dynamics in detail.
Suppliers Bargaining Power
Concentrated key component vendors
THOR depends on a concentrated set of chassis and critical-component suppliers (Ford, Mercedes-Benz, Stellantis, Lippert, Dometic), exposing it to supplier leverage on pricing, lead times and allocations; THOR reported roughly $11.5 billion in 2024 revenue, amplifying the impact of supplier constraints. Switching costs are high due to engineering integration and certification, so THOR pursues multi-sourcing where feasible and uses scale-driven negotiations to mitigate risk and secure allocations.
Volatile input commodities
Steel, aluminum, lumber, resins and foam face pronounced price swings, with suppliers able to pass through increases and compress THOR Industries' margins during upcycles; THOR reported margin pressure from commodity inflation in 2022–24. Long-term contracts and hedging reduced but did not eliminate volatility. THOR's scale purchasing partially offsets supplier bargaining power, yet input cost pass-through remains a recurring margin risk.
Specialized components and compliance
RV systems (HVAC, electrical, safety, emissions) require certified parts and vendor expertise, and THOR faced this supplier specialization amid its reported roughly $12.3 billion 2024 revenue, limiting volume-driven leverage.
Regulatory and warranty requirements legally restrict substitution, so unique component suppliers command premium pricing and lead-time control, raising their bargaining power.
THOR’s engineering depth and in-house testing reduce but do not eliminate dependency on certified vendors for critical assemblies.
Logistics and capacity constraints
Capacity tightness and shipping bottlenecks during demand spikes shift pricing power to suppliers, with component lead times often stretching 8–12 weeks, forcing THOR to carry higher inventory or pay rush premiums to meet production.
Brand and technology influence
- Brand premiums raise component costs
- Telematics/software increase switching costs
- Co-development = mutual dependence
- Cross-platform design preserves optionality
Concentrated suppliers, commodity swings and 8-12 week lead times threaten margins of $12.3B OEM
THOR relies on concentrated chassis and critical-component suppliers (Ford, Mercedes-Benz, Stellantis, Lippert, Dometic), giving suppliers pricing and allocation leverage; with 2024 revenue $12.3B this exposure can materially affect margins. High switching costs, certification needs and branded components increase supplier power despite THOR's scale, hedging and long-term contracts. Commodity volatility (steel, aluminum, lumber) and 8–12 week lead times sustain supplier pressure and inventory/rush-cost risk.
| Metric | 2024 | Impact |
|---|---|---|
| Revenue | $12.3B | Amplifies supplier risk |
| Lead times | 8–12 weeks | Raises inventory/rush costs |
| Commodity pressure | 2022–24 margin impact | Pass-through limits |
What is included in the product
Detailed Word Document
Uncovers key drivers of competition, customer influence, and market entry risks tailored exclusively to THOR Industries, analyzing its position within the RV and leisure-vehicle competitive landscape. Evaluates supplier and buyer power, substitutes, and disruptive threats that influence THOR’s pricing, margins, and strategic resilience.
Customizable Excel Spreadsheet
A clear, one-sheet Porter's Five Forces summary for THOR Industries—perfect for quick decision-making, easily customize pressure levels for shifting RV market trends and copy into pitch decks or boardroom slides.
Customers Bargaining Power
Dealer-centric channel
Independent dealers aggregate local demand and materially influence THOR’s model mix and pricing, with large dealer groups capturing over 50% of retail RV sales in 2024 and using scale to negotiate better margins and floorplan support. Dealer inventory health (shortages or bloated lots) directly alters THOR’s production cadence and working capital needs. THOR mitigates concentration risk through broad dealer coverage across North America and Europe.
End-consumer price sensitivity
RV purchases are discretionary and cyclical, making demand highly price elastic; 2024 retail unit sales remained roughly 30% below the 2018–2021 peak, amplifying buyer sensitivity. Consumers extensively cross-shop brands and models online, raising pricing transparency, while promotions and financing (increasingly central to conversions) sway purchase timing. THOR mitigates this by offering tiered portfolios across price points to capture different segments.
Aftermarket and service expectations
Buyers demand ready parts availability and responsive warranties; service quality directly drives repeat purchases and dealer leverage. Strong aftermarket programs and certified service networks reduce switching power by increasing lock-in. THOR’s scale — supported by over 1,700 dealer locations in 2024 — underpins broad parts distribution and warranty support.
Information availability
Reviews, forums, and social media amplify consumer voice, and in 2024 about 88% of buyers consult online reviews, making specifications and pricing highly comparable; this transparency lowers switching costs and strengthens buyer power. THOR offsets this by investing in product differentiation and brand equity, maintaining premium positioning and dealer networks to retain margins.
- Reviews amplify voice (2024: 88% consult reviews)
- Specs/pricing comparable → lower switching costs
- Stronger buyer power
- THOR invests in differentiation & brand equity
Financing dependence
Financing dependence: retail and dealer floorplan financing conditions directly shape affordability and ordering for THOR; in 2024 dealer credit tightening contributed to softer retail demand and deferred purchases, increasing buyer leverage. THOR saw incentive spending rise to preserve volume, while lender partnerships helped sustain throughput and used-vehicle trade activity.
- 2024: elevated incentive spend
- Dealer floorplan tightness = higher buyer power
- Strategic lender partnerships maintained distribution
Independent dealers drive pricing as retail demand lags, reviews shape buyer choices
Independent dealers (large groups >50% of retail sales in 2024) heavily influence THOR’s pricing, model mix and production; dealer inventory swings and floorplan tightening in 2024 tightened orders. Retail demand remained ~30% below the 2018–21 peak in 2024, raising price sensitivity while 88% of buyers consult online reviews. THOR’s 1,700+ dealers and elevated incentive/finance support in 2024 mitigate buyer leverage.
| Metric | 2024 |
|---|---|
| Dealer concentration | >50% |
| Retail sales vs peak | -30% |
| Buyers consulting reviews | 88% |
| Dealer locations | 1,700+ |
Same Document Delivered
THOR Industries Porter's Five Forces Analysis
This preview displays the full THOR Industries Porter’s Five Forces analysis you’ll receive—no placeholders or excerpts. The document is professionally formatted, immediately downloadable upon purchase. It covers competitive rivalry, supplier and buyer power, threats of entry and substitutes. What you see is exactly what you’ll get.
Description
From Overview to Strategy Blueprint
THOR Industries faces intense buyer power and moderate supplier influence as scale and brand loyalty shape bargaining dynamics, while new entrants and substitutes present manageable threats due to capital intensity and product differentiation. Competitive rivalry remains high among established OEMs. Unlock the full Porter's Five Forces Analysis to explore THOR Industries’s competitive dynamics in detail.
Suppliers Bargaining Power
Concentrated key component vendors
THOR depends on a concentrated set of chassis and critical-component suppliers (Ford, Mercedes-Benz, Stellantis, Lippert, Dometic), exposing it to supplier leverage on pricing, lead times and allocations; THOR reported roughly $11.5 billion in 2024 revenue, amplifying the impact of supplier constraints. Switching costs are high due to engineering integration and certification, so THOR pursues multi-sourcing where feasible and uses scale-driven negotiations to mitigate risk and secure allocations.
Volatile input commodities
Steel, aluminum, lumber, resins and foam face pronounced price swings, with suppliers able to pass through increases and compress THOR Industries' margins during upcycles; THOR reported margin pressure from commodity inflation in 2022–24. Long-term contracts and hedging reduced but did not eliminate volatility. THOR's scale purchasing partially offsets supplier bargaining power, yet input cost pass-through remains a recurring margin risk.
Specialized components and compliance
RV systems (HVAC, electrical, safety, emissions) require certified parts and vendor expertise, and THOR faced this supplier specialization amid its reported roughly $12.3 billion 2024 revenue, limiting volume-driven leverage.
Regulatory and warranty requirements legally restrict substitution, so unique component suppliers command premium pricing and lead-time control, raising their bargaining power.
THOR’s engineering depth and in-house testing reduce but do not eliminate dependency on certified vendors for critical assemblies.
Logistics and capacity constraints
Capacity tightness and shipping bottlenecks during demand spikes shift pricing power to suppliers, with component lead times often stretching 8–12 weeks, forcing THOR to carry higher inventory or pay rush premiums to meet production.
Brand and technology influence
- Brand premiums raise component costs
- Telematics/software increase switching costs
- Co-development = mutual dependence
- Cross-platform design preserves optionality
Concentrated suppliers, commodity swings and 8-12 week lead times threaten margins of $12.3B OEM
THOR relies on concentrated chassis and critical-component suppliers (Ford, Mercedes-Benz, Stellantis, Lippert, Dometic), giving suppliers pricing and allocation leverage; with 2024 revenue $12.3B this exposure can materially affect margins. High switching costs, certification needs and branded components increase supplier power despite THOR's scale, hedging and long-term contracts. Commodity volatility (steel, aluminum, lumber) and 8–12 week lead times sustain supplier pressure and inventory/rush-cost risk.
| Metric | 2024 | Impact |
|---|---|---|
| Revenue | $12.3B | Amplifies supplier risk |
| Lead times | 8–12 weeks | Raises inventory/rush costs |
| Commodity pressure | 2022–24 margin impact | Pass-through limits |
What is included in the product
Detailed Word Document
Uncovers key drivers of competition, customer influence, and market entry risks tailored exclusively to THOR Industries, analyzing its position within the RV and leisure-vehicle competitive landscape. Evaluates supplier and buyer power, substitutes, and disruptive threats that influence THOR’s pricing, margins, and strategic resilience.
Customizable Excel Spreadsheet
A clear, one-sheet Porter's Five Forces summary for THOR Industries—perfect for quick decision-making, easily customize pressure levels for shifting RV market trends and copy into pitch decks or boardroom slides.
Customers Bargaining Power
Dealer-centric channel
Independent dealers aggregate local demand and materially influence THOR’s model mix and pricing, with large dealer groups capturing over 50% of retail RV sales in 2024 and using scale to negotiate better margins and floorplan support. Dealer inventory health (shortages or bloated lots) directly alters THOR’s production cadence and working capital needs. THOR mitigates concentration risk through broad dealer coverage across North America and Europe.
End-consumer price sensitivity
RV purchases are discretionary and cyclical, making demand highly price elastic; 2024 retail unit sales remained roughly 30% below the 2018–2021 peak, amplifying buyer sensitivity. Consumers extensively cross-shop brands and models online, raising pricing transparency, while promotions and financing (increasingly central to conversions) sway purchase timing. THOR mitigates this by offering tiered portfolios across price points to capture different segments.
Aftermarket and service expectations
Buyers demand ready parts availability and responsive warranties; service quality directly drives repeat purchases and dealer leverage. Strong aftermarket programs and certified service networks reduce switching power by increasing lock-in. THOR’s scale — supported by over 1,700 dealer locations in 2024 — underpins broad parts distribution and warranty support.
Information availability
Reviews, forums, and social media amplify consumer voice, and in 2024 about 88% of buyers consult online reviews, making specifications and pricing highly comparable; this transparency lowers switching costs and strengthens buyer power. THOR offsets this by investing in product differentiation and brand equity, maintaining premium positioning and dealer networks to retain margins.
- Reviews amplify voice (2024: 88% consult reviews)
- Specs/pricing comparable → lower switching costs
- Stronger buyer power
- THOR invests in differentiation & brand equity
Financing dependence
Financing dependence: retail and dealer floorplan financing conditions directly shape affordability and ordering for THOR; in 2024 dealer credit tightening contributed to softer retail demand and deferred purchases, increasing buyer leverage. THOR saw incentive spending rise to preserve volume, while lender partnerships helped sustain throughput and used-vehicle trade activity.
- 2024: elevated incentive spend
- Dealer floorplan tightness = higher buyer power
- Strategic lender partnerships maintained distribution
Independent dealers drive pricing as retail demand lags, reviews shape buyer choices
Independent dealers (large groups >50% of retail sales in 2024) heavily influence THOR’s pricing, model mix and production; dealer inventory swings and floorplan tightening in 2024 tightened orders. Retail demand remained ~30% below the 2018–21 peak in 2024, raising price sensitivity while 88% of buyers consult online reviews. THOR’s 1,700+ dealers and elevated incentive/finance support in 2024 mitigate buyer leverage.
| Metric | 2024 |
|---|---|
| Dealer concentration | >50% |
| Retail sales vs peak | -30% |
| Buyers consulting reviews | 88% |
| Dealer locations | 1,700+ |
Same Document Delivered
THOR Industries Porter's Five Forces Analysis
This preview displays the full THOR Industries Porter’s Five Forces analysis you’ll receive—no placeholders or excerpts. The document is professionally formatted, immediately downloadable upon purchase. It covers competitive rivalry, supplier and buyer power, threats of entry and substitutes. What you see is exactly what you’ll get.











