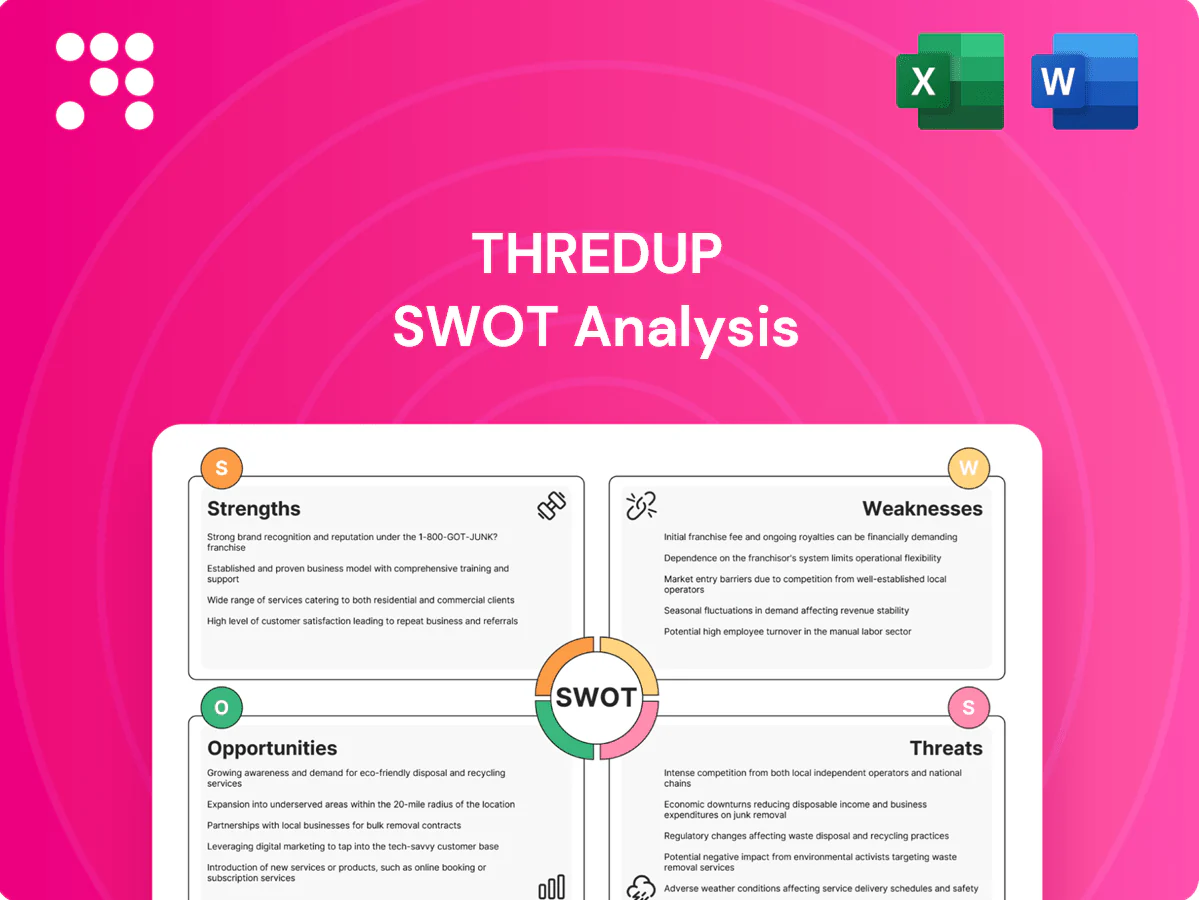
ThredUp SWOT Analysis

Go Beyond the Preview—Access the Full Strategic Report
ThredUp SWOT highlights resale market leadership, sustainability tailwinds, margin pressures and growth risks. Dive deeper to see competitive moats, operational gaps, and opportunity windows. Purchase the full SWOT for a research-backed, editable Word + Excel pack to plan, pitch, or invest with confidence.
Strengths

End-to-end resale platform
ThredUp’s end-to-end platform—managing intake, inspection, listing, fulfillment, and customer service—eliminates seller/buyer friction common in peer-to-peer marketplaces and streamlines transactions. Standardized processes boost trust and repeat usage, helping the company scale brand-consistent operations. ThredUp has processed over 100 million items since founding, underscoring the scalability of its full-stack model.
Strong sustainability appeal
Positioning around circular fashion lets ThredUp resonate with eco-conscious consumers and brands, tapping a resale market projected at $218B by 2026 (ThredUp Resale Report). The narrative supports lower-cost shopping with reduced environmental impact, boosting customer acquisition and loyalty at lower marketing cost. It also opens doors to ESG-aligned partnerships and corporate resale programs.

Resale-as-a-Service partnerships
ThredUp’s Resale-as-a-Service offers white-label programs that let brands and retailers expand inventory access and distribution by using ThredUp’s platform to manage take-back and resale logistics.
Partners leverage ThredUp infrastructure to integrate circular programs into their channels, creating recurring enterprise revenue streams and deeper B2B relationships.
This model differentiates ThredUp from pure consumer marketplaces by embedding resale into brand ecosystems and unlocking strategic, non-transactional value.

Data-driven pricing and merchandising
ThredUp has processed over 100 million items since inception, and that scale of catalog and transaction data enables dynamic pricing and curated assortments that boost personalization, conversion, and sell-through; these insights refine acceptance criteria and inventory mix, gradually improving unit economics as pricing algorithms learn across millions of SKUs.
- Data scale: >100M items processed
- Outcome: higher conversion and sell-through via personalization
- Operational: acceptance criteria and mix optimized
- Financial: improved unit economics over time
Scaled logistics and QA
Centralized processing centers deliver consistent quality control and standardized grading that reduces counterfeit and condition risk, supporting lower returns and higher buyer confidence; scale drives operational learning—ThredUp cites faster throughput per item as volume grows—while reliability underpins buyer trust and brand equity. The global resale market is projected at about 218 billion USD by 2026 (ThredUp Resale Report 2024).
- Centralized QC
- Standardized grading
- Scale = throughput gains
- Reliability → buyer trust
Circular resale platform standardizes grading, reduces friction, drives repeat buyers
ThredUp’s end-to-end platform and centralized processing reduce buyer/seller friction, standardize grading, and drive repeat usage. Processing of over 100 million items provides scale for pricing algorithms and improved unit economics. Positioning in circular fashion taps a resale market projected at $218B by 2026 and enables Resale-as-a-Service enterprise revenue.
| Metric | Value |
|---|---|
| Items processed | >100M |
| Resale market | $218B by 2026 |
| Model | End-to-end + Resale-as-a-Service |
What is included in the product
 Detailed Word Document
Provides a focused SWOT analysis of ThredUp, highlighting internal strengths and weaknesses and external opportunities and threats shaping its resale marketplace growth, operational challenges, and competitive positioning.

 Customizable Excel Spreadsheet
Provides a concise, visual SWOT summary of ThredUp to quickly surface resale-market strengths, weaknesses, opportunities, and threats—enabling fast stakeholder alignment and prioritized action on key pain points.
Weaknesses

Labor-intensive processing
Intake, authentication and photography remain costly and time-consuming for ThredUp, creating high-touch labor per item and pressuring unit economics. Wage and productivity constraints compress margins, especially given low average selling prices and limited operating leverage. Automation for soft goods continues to lag, complicating scale-up; the global resale market is forecast to reach 350 billion by 2027.
Low average selling price
Low average selling price on ThredUp's mass-market assortment compresses gross margins, and in 2024 shipping and handling frequently overwhelmed contribution on low-ASP items. Heavy discounting and promotional activity further eroded take rates, forcing reliance on higher-volume sales and improved mix. Profitability hinges on scaling units sold and shifting toward higher-value categories to offset thin per-item economics.

Supply quality variability
Inconsistent consigned inventory quality and styles produce uneven sell-through and elevated return risk, forcing ThredUp to absorb processing and screening costs on rejected items that generate no revenue. These supply variances complicate forecasting and merchandising versus first-party retail, reducing inventory velocity and margin predictability. The challenge persists even as the resale market is projected at about 218 billion USD by 2026 per ThredUp’s Resale Report.

Dependence on shipping networks
Dependence on carriers for inbound kits and outbound orders ties ThredUp to third-party pricing and service levels; parcel rate increases outpaced CPI in 2023–24, squeezing margins. Postage inflation can erode unit economics rapidly. Service disruptions (weather, capacity) directly harm customer satisfaction and repeat purchase rates. Limited control raises operational risk and forecasting volatility.
- postage-inflation
- service-disruptions
- margin-pressure
Brand awareness vs rivals
- Community-driven rivals outcompete on engagement
- Premium cachet attracts higher-margin buyers
- Casual shoppers see little differentiation
- Marketing spend likely to rise, squeezing efficiency
High intake costs and low ASPs squeeze margins; parcel inflation and consignment variability
High-touch intake, authentication and photography drive elevated per-item costs and suppress unit economics, while automation for soft goods lags. Low average selling prices and heavy discounting compress gross margins; parcel rate inflation and carrier dependency add volatility. Inconsistent consigned inventory reduces sell-through and forecasting accuracy, weakening margin predictability.
| Metric | Value |
|---|---|
| Resale market (2026) | $218B |
| Resale forecast (2027) | $350B |
| Per-item economics | High cost / Low ASP |
Same Document Delivered
ThredUp SWOT Analysis
This is the actual SWOT analysis document you’ll receive upon purchase—no surprises, just professional quality. The preview below is taken directly from the full report and reflects the same structure, insights, and editable content you’ll download after payment. Buy now to unlock the complete, detailed ThredUp SWOT analysis.

Go Beyond the Preview—Access the Full Strategic Report
ThredUp SWOT highlights resale market leadership, sustainability tailwinds, margin pressures and growth risks. Dive deeper to see competitive moats, operational gaps, and opportunity windows. Purchase the full SWOT for a research-backed, editable Word + Excel pack to plan, pitch, or invest with confidence.
Strengths
End-to-end resale platform
ThredUp’s end-to-end platform—managing intake, inspection, listing, fulfillment, and customer service—eliminates seller/buyer friction common in peer-to-peer marketplaces and streamlines transactions. Standardized processes boost trust and repeat usage, helping the company scale brand-consistent operations. ThredUp has processed over 100 million items since founding, underscoring the scalability of its full-stack model.
Strong sustainability appeal
Positioning around circular fashion lets ThredUp resonate with eco-conscious consumers and brands, tapping a resale market projected at $218B by 2026 (ThredUp Resale Report). The narrative supports lower-cost shopping with reduced environmental impact, boosting customer acquisition and loyalty at lower marketing cost. It also opens doors to ESG-aligned partnerships and corporate resale programs.
Resale-as-a-Service partnerships
ThredUp’s Resale-as-a-Service offers white-label programs that let brands and retailers expand inventory access and distribution by using ThredUp’s platform to manage take-back and resale logistics.
Partners leverage ThredUp infrastructure to integrate circular programs into their channels, creating recurring enterprise revenue streams and deeper B2B relationships.
This model differentiates ThredUp from pure consumer marketplaces by embedding resale into brand ecosystems and unlocking strategic, non-transactional value.
Data-driven pricing and merchandising
ThredUp has processed over 100 million items since inception, and that scale of catalog and transaction data enables dynamic pricing and curated assortments that boost personalization, conversion, and sell-through; these insights refine acceptance criteria and inventory mix, gradually improving unit economics as pricing algorithms learn across millions of SKUs.
- Data scale: >100M items processed
- Outcome: higher conversion and sell-through via personalization
- Operational: acceptance criteria and mix optimized
- Financial: improved unit economics over time
Scaled logistics and QA
Centralized processing centers deliver consistent quality control and standardized grading that reduces counterfeit and condition risk, supporting lower returns and higher buyer confidence; scale drives operational learning—ThredUp cites faster throughput per item as volume grows—while reliability underpins buyer trust and brand equity. The global resale market is projected at about 218 billion USD by 2026 (ThredUp Resale Report 2024).
- Centralized QC
- Standardized grading
- Scale = throughput gains
- Reliability → buyer trust
Circular resale platform standardizes grading, reduces friction, drives repeat buyers
ThredUp’s end-to-end platform and centralized processing reduce buyer/seller friction, standardize grading, and drive repeat usage. Processing of over 100 million items provides scale for pricing algorithms and improved unit economics. Positioning in circular fashion taps a resale market projected at $218B by 2026 and enables Resale-as-a-Service enterprise revenue.
| Metric | Value |
|---|---|
| Items processed | >100M |
| Resale market | $218B by 2026 |
| Model | End-to-end + Resale-as-a-Service |
What is included in the product
Detailed Word Document
Provides a focused SWOT analysis of ThredUp, highlighting internal strengths and weaknesses and external opportunities and threats shaping its resale marketplace growth, operational challenges, and competitive positioning.
Customizable Excel Spreadsheet
Provides a concise, visual SWOT summary of ThredUp to quickly surface resale-market strengths, weaknesses, opportunities, and threats—enabling fast stakeholder alignment and prioritized action on key pain points.
Weaknesses
Labor-intensive processing
Intake, authentication and photography remain costly and time-consuming for ThredUp, creating high-touch labor per item and pressuring unit economics. Wage and productivity constraints compress margins, especially given low average selling prices and limited operating leverage. Automation for soft goods continues to lag, complicating scale-up; the global resale market is forecast to reach 350 billion by 2027.
Low average selling price
Low average selling price on ThredUp's mass-market assortment compresses gross margins, and in 2024 shipping and handling frequently overwhelmed contribution on low-ASP items. Heavy discounting and promotional activity further eroded take rates, forcing reliance on higher-volume sales and improved mix. Profitability hinges on scaling units sold and shifting toward higher-value categories to offset thin per-item economics.
Supply quality variability
Inconsistent consigned inventory quality and styles produce uneven sell-through and elevated return risk, forcing ThredUp to absorb processing and screening costs on rejected items that generate no revenue. These supply variances complicate forecasting and merchandising versus first-party retail, reducing inventory velocity and margin predictability. The challenge persists even as the resale market is projected at about 218 billion USD by 2026 per ThredUp’s Resale Report.
Dependence on shipping networks
Dependence on carriers for inbound kits and outbound orders ties ThredUp to third-party pricing and service levels; parcel rate increases outpaced CPI in 2023–24, squeezing margins. Postage inflation can erode unit economics rapidly. Service disruptions (weather, capacity) directly harm customer satisfaction and repeat purchase rates. Limited control raises operational risk and forecasting volatility.
- postage-inflation
- service-disruptions
- margin-pressure
Brand awareness vs rivals
- Community-driven rivals outcompete on engagement
- Premium cachet attracts higher-margin buyers
- Casual shoppers see little differentiation
- Marketing spend likely to rise, squeezing efficiency
High intake costs and low ASPs squeeze margins; parcel inflation and consignment variability
High-touch intake, authentication and photography drive elevated per-item costs and suppress unit economics, while automation for soft goods lags. Low average selling prices and heavy discounting compress gross margins; parcel rate inflation and carrier dependency add volatility. Inconsistent consigned inventory reduces sell-through and forecasting accuracy, weakening margin predictability.
| Metric | Value |
|---|---|
| Resale market (2026) | $218B |
| Resale forecast (2027) | $350B |
| Per-item economics | High cost / Low ASP |
Same Document Delivered
ThredUp SWOT Analysis
This is the actual SWOT analysis document you’ll receive upon purchase—no surprises, just professional quality. The preview below is taken directly from the full report and reflects the same structure, insights, and editable content you’ll download after payment. Buy now to unlock the complete, detailed ThredUp SWOT analysis.
Description
Go Beyond the Preview—Access the Full Strategic Report
ThredUp SWOT highlights resale market leadership, sustainability tailwinds, margin pressures and growth risks. Dive deeper to see competitive moats, operational gaps, and opportunity windows. Purchase the full SWOT for a research-backed, editable Word + Excel pack to plan, pitch, or invest with confidence.
Strengths
End-to-end resale platform
ThredUp’s end-to-end platform—managing intake, inspection, listing, fulfillment, and customer service—eliminates seller/buyer friction common in peer-to-peer marketplaces and streamlines transactions. Standardized processes boost trust and repeat usage, helping the company scale brand-consistent operations. ThredUp has processed over 100 million items since founding, underscoring the scalability of its full-stack model.
Strong sustainability appeal
Positioning around circular fashion lets ThredUp resonate with eco-conscious consumers and brands, tapping a resale market projected at $218B by 2026 (ThredUp Resale Report). The narrative supports lower-cost shopping with reduced environmental impact, boosting customer acquisition and loyalty at lower marketing cost. It also opens doors to ESG-aligned partnerships and corporate resale programs.
Resale-as-a-Service partnerships
ThredUp’s Resale-as-a-Service offers white-label programs that let brands and retailers expand inventory access and distribution by using ThredUp’s platform to manage take-back and resale logistics.
Partners leverage ThredUp infrastructure to integrate circular programs into their channels, creating recurring enterprise revenue streams and deeper B2B relationships.
This model differentiates ThredUp from pure consumer marketplaces by embedding resale into brand ecosystems and unlocking strategic, non-transactional value.
Data-driven pricing and merchandising
ThredUp has processed over 100 million items since inception, and that scale of catalog and transaction data enables dynamic pricing and curated assortments that boost personalization, conversion, and sell-through; these insights refine acceptance criteria and inventory mix, gradually improving unit economics as pricing algorithms learn across millions of SKUs.
- Data scale: >100M items processed
- Outcome: higher conversion and sell-through via personalization
- Operational: acceptance criteria and mix optimized
- Financial: improved unit economics over time
Scaled logistics and QA
Centralized processing centers deliver consistent quality control and standardized grading that reduces counterfeit and condition risk, supporting lower returns and higher buyer confidence; scale drives operational learning—ThredUp cites faster throughput per item as volume grows—while reliability underpins buyer trust and brand equity. The global resale market is projected at about 218 billion USD by 2026 (ThredUp Resale Report 2024).
- Centralized QC
- Standardized grading
- Scale = throughput gains
- Reliability → buyer trust
Circular resale platform standardizes grading, reduces friction, drives repeat buyers
ThredUp’s end-to-end platform and centralized processing reduce buyer/seller friction, standardize grading, and drive repeat usage. Processing of over 100 million items provides scale for pricing algorithms and improved unit economics. Positioning in circular fashion taps a resale market projected at $218B by 2026 and enables Resale-as-a-Service enterprise revenue.
| Metric | Value |
|---|---|
| Items processed | >100M |
| Resale market | $218B by 2026 |
| Model | End-to-end + Resale-as-a-Service |
What is included in the product
Detailed Word Document
Provides a focused SWOT analysis of ThredUp, highlighting internal strengths and weaknesses and external opportunities and threats shaping its resale marketplace growth, operational challenges, and competitive positioning.
Customizable Excel Spreadsheet
Provides a concise, visual SWOT summary of ThredUp to quickly surface resale-market strengths, weaknesses, opportunities, and threats—enabling fast stakeholder alignment and prioritized action on key pain points.
Weaknesses
Labor-intensive processing
Intake, authentication and photography remain costly and time-consuming for ThredUp, creating high-touch labor per item and pressuring unit economics. Wage and productivity constraints compress margins, especially given low average selling prices and limited operating leverage. Automation for soft goods continues to lag, complicating scale-up; the global resale market is forecast to reach 350 billion by 2027.
Low average selling price
Low average selling price on ThredUp's mass-market assortment compresses gross margins, and in 2024 shipping and handling frequently overwhelmed contribution on low-ASP items. Heavy discounting and promotional activity further eroded take rates, forcing reliance on higher-volume sales and improved mix. Profitability hinges on scaling units sold and shifting toward higher-value categories to offset thin per-item economics.
Supply quality variability
Inconsistent consigned inventory quality and styles produce uneven sell-through and elevated return risk, forcing ThredUp to absorb processing and screening costs on rejected items that generate no revenue. These supply variances complicate forecasting and merchandising versus first-party retail, reducing inventory velocity and margin predictability. The challenge persists even as the resale market is projected at about 218 billion USD by 2026 per ThredUp’s Resale Report.
Dependence on shipping networks
Dependence on carriers for inbound kits and outbound orders ties ThredUp to third-party pricing and service levels; parcel rate increases outpaced CPI in 2023–24, squeezing margins. Postage inflation can erode unit economics rapidly. Service disruptions (weather, capacity) directly harm customer satisfaction and repeat purchase rates. Limited control raises operational risk and forecasting volatility.
- postage-inflation
- service-disruptions
- margin-pressure
Brand awareness vs rivals
- Community-driven rivals outcompete on engagement
- Premium cachet attracts higher-margin buyers
- Casual shoppers see little differentiation
- Marketing spend likely to rise, squeezing efficiency
High intake costs and low ASPs squeeze margins; parcel inflation and consignment variability
High-touch intake, authentication and photography drive elevated per-item costs and suppress unit economics, while automation for soft goods lags. Low average selling prices and heavy discounting compress gross margins; parcel rate inflation and carrier dependency add volatility. Inconsistent consigned inventory reduces sell-through and forecasting accuracy, weakening margin predictability.
| Metric | Value |
|---|---|
| Resale market (2026) | $218B |
| Resale forecast (2027) | $350B |
| Per-item economics | High cost / Low ASP |
Same Document Delivered
ThredUp SWOT Analysis
This is the actual SWOT analysis document you’ll receive upon purchase—no surprises, just professional quality. The preview below is taken directly from the full report and reflects the same structure, insights, and editable content you’ll download after payment. Buy now to unlock the complete, detailed ThredUp SWOT analysis.











