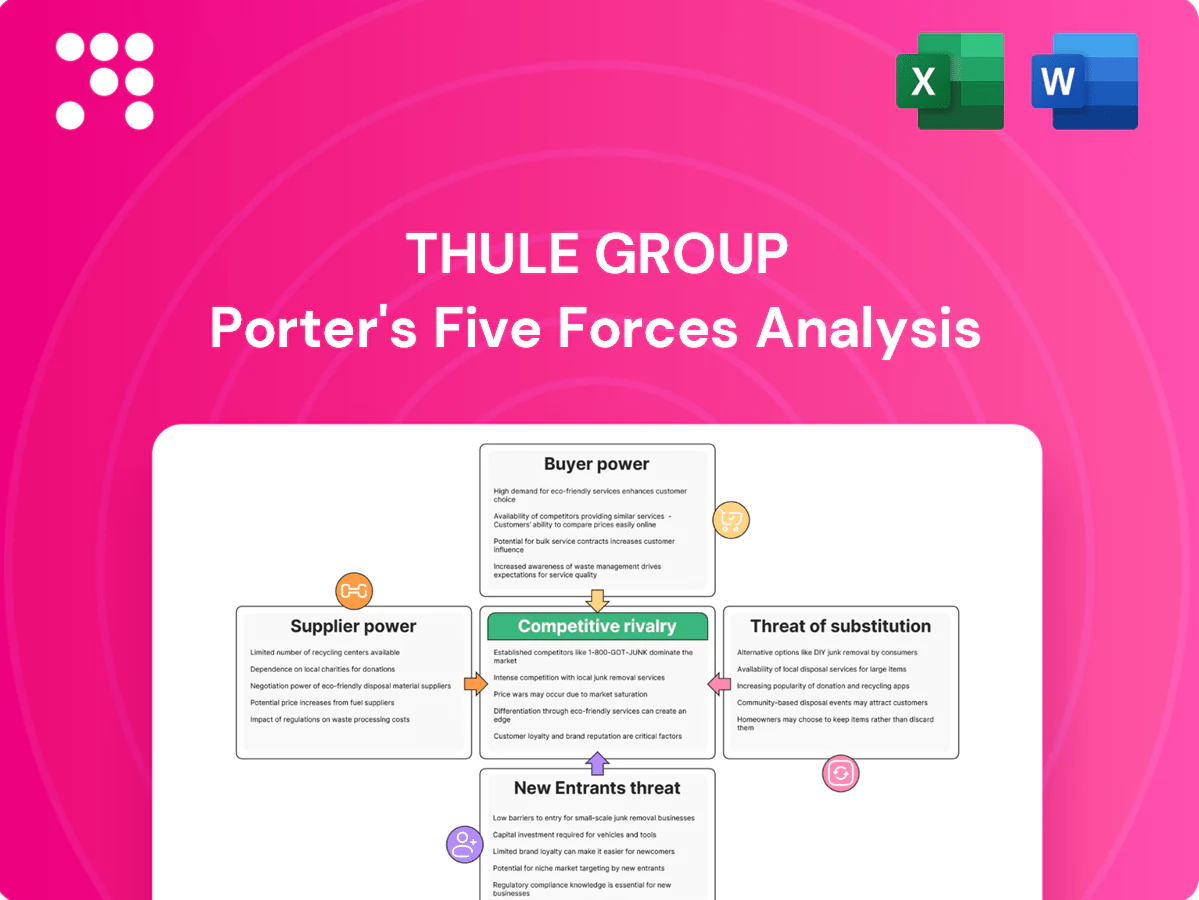
Thule Group Porter's Five Forces Analysis

Go Beyond the Preview—Access the Full Strategic Report
Thule Group’s competitive landscape mixes strong brand power and moderate supplier leverage with rising substitute and entrant threats as outdoor lifestyles shift; understanding these dynamics is vital for strategy and investment decisions. This brief snapshot only scratches the surface—unlock the full Porter’s Five Forces Analysis for force-by-force ratings, visuals, and actionable recommendations.
Suppliers Bargaining Power

Specialized materials reliance
Thule’s reliance on aluminum, engineered plastics, technical textiles and safety-grade components limits qualified suppliers, strengthening supplier leverage over lead times and specs. Limited alternatives increase risk of longer lead times and stricter spec control, though Thule’s multi-sourcing and global procurement networks reduce direct price power. Qualification of new suppliers remains lengthy, preserving incumbents’ influence.
Quality and certification demands
Strict crash, weather and child-safety standards increase Thule’s dependence on proven suppliers, since approval and crash-test cycles often exceed 12 months. Suppliers certified to UNECE and relevant ISO norms therefore gain measurable bargaining strength. Thule’s premium positioning limits willingness to trade down on quality. Long validation cycles (6–18 months) further entrench approved vendors.

Branded components leverage
Reputable zippers, buckles, wheels and fabrics (eg YKK, Duraflex) command price premiums and 2024 industry studies indicate branded trims can add roughly 5–12% to finished-goods cost, bolstering perceived quality but constraining Thule’s negotiating flexibility. Substituting away risks tangible quality perception loss and potential warranty exposure. Framework contracts and multi-year agreements smooth volatility but cannot fully remove suppliers’ pricing power.

Scale and volume offsets
Thule’s presence in 140+ markets and broad SKU range give it counter-leverage with suppliers, enabling consolidated orders and long-term agreements that secure volume-based pricing and preferential lead times. Regular forecast sharing improves supplier capacity planning, lowering inventory and risk premiums, while supplier development programs (quality and yield improvements) reduce unit costs over time.
- Scale: global presence in 140+ markets
- Negotiation: consolidated orders enable volume discounts
- Visibility: forecasts reduce supplier risk premiums
- Development: supplier programs lower long-term costs
Logistics and input volatility
Commodity and freight swings in 2024 shifted bargaining toward suppliers during tight pockets, as metals, resins and textile lead times widened and suppliers captured higher margins; Thule’s extended supplier base raised risk premiums and forced pass-throughs. Nearshoring and higher inventory buffers reduced disruption exposure but increased carrying costs, while 2024 currency moves (EUR/USD volatility) amplified effective supplier power.
- 2024: freight volatility increased supplier leverage
- Extended metal/resin/textile chains = higher risk premiums
- Nearshoring + inventory = lower disruption, higher carrying cost
- Currency swings in 2024 magnified supplier pricing power
Specialized supplier reliance and long qualification cycles tighten margins despite global scale
Thule’s dependence on specialized aluminum, technical textiles and safety-grade components limits supplier alternatives and raises lead-time/spec leverage; certification and 6–18 month qualification cycles further entrench incumbents. Branded trims add ~5–12% to finished-goods cost, constraining price flexibility. Scale (140+ markets) and long-term contracts partially offset supplier power but 2024 commodity/freight volatility tightened margins.
| Metric | 2024 value |
|---|---|
| Markets | 140+ |
| Supplier qualification | 6–18 months |
| Branded trims impact | 5–12% of COGS |
What is included in the product
 Detailed Word Document
Tailored exclusively for Thule Group, this Porter’s Five Forces overview uncovers key drivers of competition, supplier and buyer power, threats from substitutes and new entrants, and identifies disruptive forces and emerging threats that shape pricing, margins, and long-term market position.

 Customizable Excel Spreadsheet
A clear, one-sheet summary of Thule Group's five-force pressures—perfect for quick strategic decision-making and boardroom use.
Customers Bargaining Power

Concentrated retail channels
Large sporting-goods chains, auto retailers and marketplaces exert strong price and placement leverage over Thule, with slotting fees, promotional funding and generous returns terms compressing margins; losing a key account can cut volumes and visibility sharply. In 2024 Thule reported net sales of about SEK 23.2 billion, reflecting exposure to major retail partners. Thule mitigates risk by balancing accounts and regions to preserve negotiating power and shelf presence.
Brand loyalty and differentiation
Thule's performance, safety, and Scandinavian design differentiation reduce buyer price sensitivity by emphasizing durability and usability over lowest cost. Strong brand equity, backed by Thule's limited lifetime warranty on many products, creates perceived value that weakens direct price comparisons with generics. Customer reviews and industry awards such as Red Dot further anchor Thule's premium positioning and justify higher price points.

DTC and omnichannel mix
Thule Group's increasing DTC and omnichannel mix—with DTC channels accounting for roughly 20% of sales in 2024—dilutes traditional retailer bargaining power and shifts margin capture in Thule's favor. First-party data from online sales strengthens pricing, assortment and upsell control, improving conversion and AOV. Channel conflict must be managed to avoid retail retaliation, so click-and-collect and service partner integrations preserve reach without full retail dependence.

High price transparency
High price transparency — driven by online comparison and seasonal discounting — raises buyer leverage; global e-commerce penetration reached about 23% in 2024, making cross-retailer price checks routine. MAP policies reduce visible undercutting but are costly to police across markets, and consumers increasingly time purchases around promotions, pressuring average selling prices; bundles and limited editions partially protect margins.
Switching costs via ecosystems
Thule's ecosystem of cross-bars, mounts and accessories creates high switching costs by encouraging repeat purchases and ensuring compatibility through detailed fit guides, while after-sales service and spare parts availability deepen customer stickiness and reduce effective buyer power over time.
- tags: ecosystem
- tags: compatibility
- tags: after-sales
- tags: switching-costs
Retail chains squeeze pricing risk; SEK 23.2bn, DTC ≈20% and e‑commerce ≈23%
Retail chains and marketplaces exert strong placement and price leverage, risking volume if key accounts are lost; Thule reported net sales ~SEK 23.2bn in 2024. Brand, design and warranty reduce price sensitivity, while DTC (≈20% of sales) and 23% e-commerce share dilute retailer power and boost margin capture.
| Metric | 2024 |
|---|---|
| Net sales | SEK 23.2bn |
| DTC mix | ≈20% |
| E‑commerce | ≈23% |
What You See Is What You Get
Thule Group Porter's Five Forces Analysis
This preview shows the exact Porter's Five Forces analysis of Thule Group you'll receive after purchase—no placeholders or samples. The document is the final, professionally formatted report analyzing supplier power, buyer power, rivalry, substitutes, and entry threats. Once purchased, you’ll get immediate access to this identical file, ready for download and use.

Go Beyond the Preview—Access the Full Strategic Report
Thule Group’s competitive landscape mixes strong brand power and moderate supplier leverage with rising substitute and entrant threats as outdoor lifestyles shift; understanding these dynamics is vital for strategy and investment decisions. This brief snapshot only scratches the surface—unlock the full Porter’s Five Forces Analysis for force-by-force ratings, visuals, and actionable recommendations.
Suppliers Bargaining Power
Specialized materials reliance
Thule’s reliance on aluminum, engineered plastics, technical textiles and safety-grade components limits qualified suppliers, strengthening supplier leverage over lead times and specs. Limited alternatives increase risk of longer lead times and stricter spec control, though Thule’s multi-sourcing and global procurement networks reduce direct price power. Qualification of new suppliers remains lengthy, preserving incumbents’ influence.
Quality and certification demands
Strict crash, weather and child-safety standards increase Thule’s dependence on proven suppliers, since approval and crash-test cycles often exceed 12 months. Suppliers certified to UNECE and relevant ISO norms therefore gain measurable bargaining strength. Thule’s premium positioning limits willingness to trade down on quality. Long validation cycles (6–18 months) further entrench approved vendors.
Branded components leverage
Reputable zippers, buckles, wheels and fabrics (eg YKK, Duraflex) command price premiums and 2024 industry studies indicate branded trims can add roughly 5–12% to finished-goods cost, bolstering perceived quality but constraining Thule’s negotiating flexibility. Substituting away risks tangible quality perception loss and potential warranty exposure. Framework contracts and multi-year agreements smooth volatility but cannot fully remove suppliers’ pricing power.
Scale and volume offsets
Thule’s presence in 140+ markets and broad SKU range give it counter-leverage with suppliers, enabling consolidated orders and long-term agreements that secure volume-based pricing and preferential lead times. Regular forecast sharing improves supplier capacity planning, lowering inventory and risk premiums, while supplier development programs (quality and yield improvements) reduce unit costs over time.
- Scale: global presence in 140+ markets
- Negotiation: consolidated orders enable volume discounts
- Visibility: forecasts reduce supplier risk premiums
- Development: supplier programs lower long-term costs
Logistics and input volatility
Commodity and freight swings in 2024 shifted bargaining toward suppliers during tight pockets, as metals, resins and textile lead times widened and suppliers captured higher margins; Thule’s extended supplier base raised risk premiums and forced pass-throughs. Nearshoring and higher inventory buffers reduced disruption exposure but increased carrying costs, while 2024 currency moves (EUR/USD volatility) amplified effective supplier power.
- 2024: freight volatility increased supplier leverage
- Extended metal/resin/textile chains = higher risk premiums
- Nearshoring + inventory = lower disruption, higher carrying cost
- Currency swings in 2024 magnified supplier pricing power
Specialized supplier reliance and long qualification cycles tighten margins despite global scale
Thule’s dependence on specialized aluminum, technical textiles and safety-grade components limits supplier alternatives and raises lead-time/spec leverage; certification and 6–18 month qualification cycles further entrench incumbents. Branded trims add ~5–12% to finished-goods cost, constraining price flexibility. Scale (140+ markets) and long-term contracts partially offset supplier power but 2024 commodity/freight volatility tightened margins.
| Metric | 2024 value |
|---|---|
| Markets | 140+ |
| Supplier qualification | 6–18 months |
| Branded trims impact | 5–12% of COGS |
What is included in the product
Detailed Word Document
Tailored exclusively for Thule Group, this Porter’s Five Forces overview uncovers key drivers of competition, supplier and buyer power, threats from substitutes and new entrants, and identifies disruptive forces and emerging threats that shape pricing, margins, and long-term market position.
Customizable Excel Spreadsheet
A clear, one-sheet summary of Thule Group's five-force pressures—perfect for quick strategic decision-making and boardroom use.
Customers Bargaining Power
Concentrated retail channels
Large sporting-goods chains, auto retailers and marketplaces exert strong price and placement leverage over Thule, with slotting fees, promotional funding and generous returns terms compressing margins; losing a key account can cut volumes and visibility sharply. In 2024 Thule reported net sales of about SEK 23.2 billion, reflecting exposure to major retail partners. Thule mitigates risk by balancing accounts and regions to preserve negotiating power and shelf presence.
Brand loyalty and differentiation
Thule's performance, safety, and Scandinavian design differentiation reduce buyer price sensitivity by emphasizing durability and usability over lowest cost. Strong brand equity, backed by Thule's limited lifetime warranty on many products, creates perceived value that weakens direct price comparisons with generics. Customer reviews and industry awards such as Red Dot further anchor Thule's premium positioning and justify higher price points.
DTC and omnichannel mix
Thule Group's increasing DTC and omnichannel mix—with DTC channels accounting for roughly 20% of sales in 2024—dilutes traditional retailer bargaining power and shifts margin capture in Thule's favor. First-party data from online sales strengthens pricing, assortment and upsell control, improving conversion and AOV. Channel conflict must be managed to avoid retail retaliation, so click-and-collect and service partner integrations preserve reach without full retail dependence.
High price transparency
High price transparency — driven by online comparison and seasonal discounting — raises buyer leverage; global e-commerce penetration reached about 23% in 2024, making cross-retailer price checks routine. MAP policies reduce visible undercutting but are costly to police across markets, and consumers increasingly time purchases around promotions, pressuring average selling prices; bundles and limited editions partially protect margins.
Switching costs via ecosystems
Thule's ecosystem of cross-bars, mounts and accessories creates high switching costs by encouraging repeat purchases and ensuring compatibility through detailed fit guides, while after-sales service and spare parts availability deepen customer stickiness and reduce effective buyer power over time.
- tags: ecosystem
- tags: compatibility
- tags: after-sales
- tags: switching-costs
Retail chains squeeze pricing risk; SEK 23.2bn, DTC ≈20% and e‑commerce ≈23%
Retail chains and marketplaces exert strong placement and price leverage, risking volume if key accounts are lost; Thule reported net sales ~SEK 23.2bn in 2024. Brand, design and warranty reduce price sensitivity, while DTC (≈20% of sales) and 23% e-commerce share dilute retailer power and boost margin capture.
| Metric | 2024 |
|---|---|
| Net sales | SEK 23.2bn |
| DTC mix | ≈20% |
| E‑commerce | ≈23% |
What You See Is What You Get
Thule Group Porter's Five Forces Analysis
This preview shows the exact Porter's Five Forces analysis of Thule Group you'll receive after purchase—no placeholders or samples. The document is the final, professionally formatted report analyzing supplier power, buyer power, rivalry, substitutes, and entry threats. Once purchased, you’ll get immediate access to this identical file, ready for download and use.
Description
Go Beyond the Preview—Access the Full Strategic Report
Thule Group’s competitive landscape mixes strong brand power and moderate supplier leverage with rising substitute and entrant threats as outdoor lifestyles shift; understanding these dynamics is vital for strategy and investment decisions. This brief snapshot only scratches the surface—unlock the full Porter’s Five Forces Analysis for force-by-force ratings, visuals, and actionable recommendations.
Suppliers Bargaining Power
Specialized materials reliance
Thule’s reliance on aluminum, engineered plastics, technical textiles and safety-grade components limits qualified suppliers, strengthening supplier leverage over lead times and specs. Limited alternatives increase risk of longer lead times and stricter spec control, though Thule’s multi-sourcing and global procurement networks reduce direct price power. Qualification of new suppliers remains lengthy, preserving incumbents’ influence.
Quality and certification demands
Strict crash, weather and child-safety standards increase Thule’s dependence on proven suppliers, since approval and crash-test cycles often exceed 12 months. Suppliers certified to UNECE and relevant ISO norms therefore gain measurable bargaining strength. Thule’s premium positioning limits willingness to trade down on quality. Long validation cycles (6–18 months) further entrench approved vendors.
Branded components leverage
Reputable zippers, buckles, wheels and fabrics (eg YKK, Duraflex) command price premiums and 2024 industry studies indicate branded trims can add roughly 5–12% to finished-goods cost, bolstering perceived quality but constraining Thule’s negotiating flexibility. Substituting away risks tangible quality perception loss and potential warranty exposure. Framework contracts and multi-year agreements smooth volatility but cannot fully remove suppliers’ pricing power.
Scale and volume offsets
Thule’s presence in 140+ markets and broad SKU range give it counter-leverage with suppliers, enabling consolidated orders and long-term agreements that secure volume-based pricing and preferential lead times. Regular forecast sharing improves supplier capacity planning, lowering inventory and risk premiums, while supplier development programs (quality and yield improvements) reduce unit costs over time.
- Scale: global presence in 140+ markets
- Negotiation: consolidated orders enable volume discounts
- Visibility: forecasts reduce supplier risk premiums
- Development: supplier programs lower long-term costs
Logistics and input volatility
Commodity and freight swings in 2024 shifted bargaining toward suppliers during tight pockets, as metals, resins and textile lead times widened and suppliers captured higher margins; Thule’s extended supplier base raised risk premiums and forced pass-throughs. Nearshoring and higher inventory buffers reduced disruption exposure but increased carrying costs, while 2024 currency moves (EUR/USD volatility) amplified effective supplier power.
- 2024: freight volatility increased supplier leverage
- Extended metal/resin/textile chains = higher risk premiums
- Nearshoring + inventory = lower disruption, higher carrying cost
- Currency swings in 2024 magnified supplier pricing power
Specialized supplier reliance and long qualification cycles tighten margins despite global scale
Thule’s dependence on specialized aluminum, technical textiles and safety-grade components limits supplier alternatives and raises lead-time/spec leverage; certification and 6–18 month qualification cycles further entrench incumbents. Branded trims add ~5–12% to finished-goods cost, constraining price flexibility. Scale (140+ markets) and long-term contracts partially offset supplier power but 2024 commodity/freight volatility tightened margins.
| Metric | 2024 value |
|---|---|
| Markets | 140+ |
| Supplier qualification | 6–18 months |
| Branded trims impact | 5–12% of COGS |
What is included in the product
Detailed Word Document
Tailored exclusively for Thule Group, this Porter’s Five Forces overview uncovers key drivers of competition, supplier and buyer power, threats from substitutes and new entrants, and identifies disruptive forces and emerging threats that shape pricing, margins, and long-term market position.
Customizable Excel Spreadsheet
A clear, one-sheet summary of Thule Group's five-force pressures—perfect for quick strategic decision-making and boardroom use.
Customers Bargaining Power
Concentrated retail channels
Large sporting-goods chains, auto retailers and marketplaces exert strong price and placement leverage over Thule, with slotting fees, promotional funding and generous returns terms compressing margins; losing a key account can cut volumes and visibility sharply. In 2024 Thule reported net sales of about SEK 23.2 billion, reflecting exposure to major retail partners. Thule mitigates risk by balancing accounts and regions to preserve negotiating power and shelf presence.
Brand loyalty and differentiation
Thule's performance, safety, and Scandinavian design differentiation reduce buyer price sensitivity by emphasizing durability and usability over lowest cost. Strong brand equity, backed by Thule's limited lifetime warranty on many products, creates perceived value that weakens direct price comparisons with generics. Customer reviews and industry awards such as Red Dot further anchor Thule's premium positioning and justify higher price points.
DTC and omnichannel mix
Thule Group's increasing DTC and omnichannel mix—with DTC channels accounting for roughly 20% of sales in 2024—dilutes traditional retailer bargaining power and shifts margin capture in Thule's favor. First-party data from online sales strengthens pricing, assortment and upsell control, improving conversion and AOV. Channel conflict must be managed to avoid retail retaliation, so click-and-collect and service partner integrations preserve reach without full retail dependence.
High price transparency
High price transparency — driven by online comparison and seasonal discounting — raises buyer leverage; global e-commerce penetration reached about 23% in 2024, making cross-retailer price checks routine. MAP policies reduce visible undercutting but are costly to police across markets, and consumers increasingly time purchases around promotions, pressuring average selling prices; bundles and limited editions partially protect margins.
Switching costs via ecosystems
Thule's ecosystem of cross-bars, mounts and accessories creates high switching costs by encouraging repeat purchases and ensuring compatibility through detailed fit guides, while after-sales service and spare parts availability deepen customer stickiness and reduce effective buyer power over time.
- tags: ecosystem
- tags: compatibility
- tags: after-sales
- tags: switching-costs
Retail chains squeeze pricing risk; SEK 23.2bn, DTC ≈20% and e‑commerce ≈23%
Retail chains and marketplaces exert strong placement and price leverage, risking volume if key accounts are lost; Thule reported net sales ~SEK 23.2bn in 2024. Brand, design and warranty reduce price sensitivity, while DTC (≈20% of sales) and 23% e-commerce share dilute retailer power and boost margin capture.
| Metric | 2024 |
|---|---|
| Net sales | SEK 23.2bn |
| DTC mix | ≈20% |
| E‑commerce | ≈23% |
What You See Is What You Get
Thule Group Porter's Five Forces Analysis
This preview shows the exact Porter's Five Forces analysis of Thule Group you'll receive after purchase—no placeholders or samples. The document is the final, professionally formatted report analyzing supplier power, buyer power, rivalry, substitutes, and entry threats. Once purchased, you’ll get immediate access to this identical file, ready for download and use.











