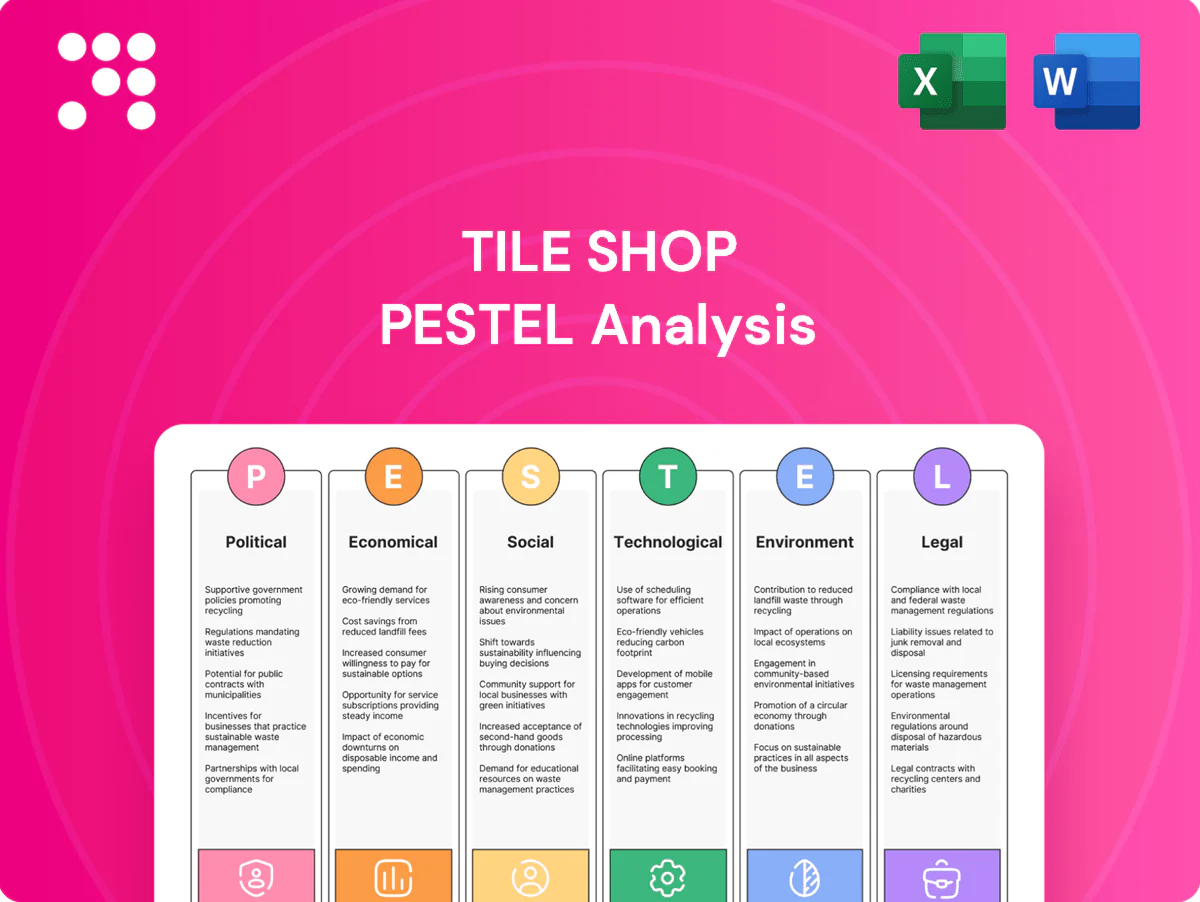
Tile Shop PESTLE Analysis

Make Smarter Strategic Decisions with a Complete PESTEL View
Unlock strategic clarity with our PESTLE Analysis of Tile Shop—three to five-minute read, lifetime value for decisions. Learn how political shifts, economic cycles, and environmental trends affect growth and risk. Purchase the full report for detailed, actionable insights ready for immediate use.
Political factors

Trade policy and import tariffs
Many tile and stone products are imported, exposing Tile Shop to tariffs and geopolitical frictions; U.S. Section 301 tariffs on Chinese goods remain as high as 25%, which can materially raise landed costs and squeeze margins. Shifts in U.S.–China or EU trade policy can alter assortment viability and price elasticity. The company must diversify sourcing, hedge currency/tariff risk, and pursue active vendor management and nearshoring to stabilize margins.
Infrastructure and housing incentives
Government construction and renovation programs boost tile demand; the US home improvement market was roughly $450 billion in 2024, supporting retail and wholesale tile sales. The Inflation Reduction Act’s roughly $369 billion in climate and energy provisions, including home retrofit incentives, can accelerate remodel timing. Federal/state public spending cycles drive commercial orders, and targeted advocacy and bid alignment help Tile Shop capture policy-driven volume.

Building standards and local permitting
Local government codes directly shape Tile Shop specification choices for tile, adhesives and waterproofing, driving SKU mixes across the companys ~100 stores (2024). Changes to safety or accessibility rules—such as updated slip resistance or ADA-related thresholds—force assortment shifts and staff retraining. Permitting delays commonly extend project timing and site traffic, increasing lead times and holding costs. Strong contractor education programs reduce compliance friction and rework.

Labor and immigration policies
Installer availability for Tile Shop hinges on immigration and vocational programs; US construction employment stood near 7.5 million in 2024 (BLS) while seasonal H-2B visas remain capped at 66,000, constraining labor supply. Tight immigration rules and limited training raise install costs and timelines; targeted workforce grants and apprenticeships can ease constraints and protect service quality and sales conversion.
- Installer supply: dependent on immigration and training
- H-2B cap: 66,000 (affects seasonal hires)
- Construction jobs ~7.5M (BLS 2024)
- Apprenticeships/grants boost conversion and quality
Political stability and logistics
Port operations, trucking regulations and fuel policies materially affect delivery reliability: West Coast ports handle ≈40% of US container imports (LA/LB throughput ~9M TEU in 2023–24), trucking driver shortage ≈80,000 (ATA, 2024) and diesel ≈$4.00/gal (2024) raise delay and cost risks; strikes or regulatory shifts can stall imports, while multi-port routing and regional DCs limit disruption and transparent lead-time communication preserves customer trust.
- Port concentration ≈40% West Coast
- LA/LB throughput ~9M TEU (2023–24)
- Driver shortfall ≈80,000 (2024)
- Diesel ≈$4.00/gal (2024)
- Mitigation: multi-port + regional DCs + clear lead-times
Tariffs, labor & logistics squeeze $450B retrofit market; nearshoring and vendor diversification key
Tariffs (Section 301 up to 25%) and geopolitical friction raise landed costs; nearshoring and vendor diversification are critical. US home improvement ~$450B (2024) and IRA ~$369B drive retrofit demand; local codes and permitting affect SKUs and lead times. Labor constraints (H-2B cap 66,000; construction jobs ~7.5M) plus logistics risks (LA/LB ~9M TEU; driver gap ~80,000; diesel ~$4/gal) pressure margins.
| Factor | Key 2024–25 Data |
|---|---|
| Tariffs | Section 301 up to 25% |
| Market | Home improvement ~$450B; IRA ~$369B |
| Labor | H-2B cap 66,000; construction ~7.5M |
| Logistics | LA/LB ~9M TEU; driver gap ~80,000; diesel ~$4/gal |
What is included in the product
 Detailed Word Document
Explores how external macro-environmental factors uniquely affect The Tile Shop across Political, Economic, Social, Technological, Environmental, and Legal dimensions; each section uses current industry and regional data, forward-looking insights, and sector-specific examples to help executives, consultants, and investors identify threats, opportunities, and strategic actions.

 Customizable Excel Spreadsheet
A concise, visually segmented PESTLE summary for Tile Shop that highlights regulatory, economic, and supply‑chain risks to ease meeting prep and strategic alignment; editable notes let teams adapt insights to regions or product lines for faster decision‑making.
Economic factors

Housing cycle sensitivity
Tile demand tracks new-builds and remodels; with 30-year mortgage rates near 7% in 2024 (Freddie Mac) and U.S. homeowner equity around $28 trillion in Q4 2024 (Federal Reserve), big-ticket projects are rate-sensitive. Rising rates push customers to trade down or delay projects. Tile Shop defends share with promotions and value-engineered product lines.
Consumer spending and inflation
Inflation elevated materials, freight and labor costs, compressing margins as U.S. CPI ran about 3.4% year-over-year in mid-2025 while container rates remain down more than 60% from 2022 peaks, only partially easing input pressures. Real wages have been roughly flat, limiting discretionary remodel spend and slowing ticket growth. Tile Shop can use price architecture and private-label assortments to preserve perceived value. Dynamic pricing and SKU mix management protect gross profit.

Commercial project pipeline
Commercial orders at Tile Shop track hospitality (US hotel occupancy ~63.5% in 2023, STR), retail and healthcare projects and a multifamily pipeline still delivering roughly 300k completions in 2024, driving demand. Longer bid-to-install timelines require deeper inventory and strict credit discipline to protect margins. Higher policy rates (FFR ~5.25–5.50% in 2024–25) and muted capex outlook reshape backlog quality. Targeted B2B outreach helps smooth retail seasonality and stabilize order flow.

Currency and sourcing costs
FX volatility raises imported tile costs, pressuring Tile Shop gross margins; proactive hedging and multi-currency purchasing reduce short-term cost swings. Strong vendor contracts and dual sourcing increase procurement flexibility and resilience. Cost-to-serve analytics drive SKU rationalization to cut logistics and holding costs.
- FX exposure: hedge/multi-currency
- Supplier strategy: contracts + dual sourcing
- Operations: cost-to-serve → SKU cuts
Labor market and wages
Tight U.S. retail labor markets lift wages and turnover risk; U.S. retail employment was about 15.6 million in 2024 (BLS), squeezing specialty retailers like Tile Shop to offer higher pay and retention bonuses.
Training and incentive programs measurably improve productivity and NPS; scheduling tech optimizes staffing around traffic peaks while installer partnerships buffer capacity constraints during seasonal spikes.
- retail employment: 15.6 million (BLS, 2024)
- higher wages → increased labor cost pressure
- training/incentives → better productivity & NPS
- scheduling tech → staffing efficiency
- installer partnerships → flexible installation capacity
Tariffs, labor & logistics squeeze $450B retrofit market; nearshoring and vendor diversification key
Higher 30-year mortgage rates near 7% (2024) and $28T homeowner equity (Q4 2024) make remodel demand rate-sensitive; Tile Shop leans on promotions and value SKUs. Inflation ~3.4% YoY (mid-2025) and tight retail labor (15.6M jobs, 2024) compress margins; pricing, SKU mix and installer partnerships defend gross profit. FX and supplier strategy mitigate imported cost swings.
| Metric | Value |
|---|---|
| 30-yr mortgage | ~7% (2024) |
| Homeowner equity | $28T (Q4 2024) |
| CPI | ~3.4% YoY (mid-2025) |
| Retail employment | 15.6M (2024) |
Same Document Delivered
Tile Shop PESTLE Analysis
The Tile Shop PESTLE Analysis preview shown here is the exact document you’ll receive after purchase—fully formatted and ready to use. The layout, content, and structure visible are identical to the downloadable file, with no placeholders or teasers. After checkout you’ll instantly get this final, professionally structured report.

Make Smarter Strategic Decisions with a Complete PESTEL View
Unlock strategic clarity with our PESTLE Analysis of Tile Shop—three to five-minute read, lifetime value for decisions. Learn how political shifts, economic cycles, and environmental trends affect growth and risk. Purchase the full report for detailed, actionable insights ready for immediate use.
Political factors
Trade policy and import tariffs
Many tile and stone products are imported, exposing Tile Shop to tariffs and geopolitical frictions; U.S. Section 301 tariffs on Chinese goods remain as high as 25%, which can materially raise landed costs and squeeze margins. Shifts in U.S.–China or EU trade policy can alter assortment viability and price elasticity. The company must diversify sourcing, hedge currency/tariff risk, and pursue active vendor management and nearshoring to stabilize margins.
Infrastructure and housing incentives
Government construction and renovation programs boost tile demand; the US home improvement market was roughly $450 billion in 2024, supporting retail and wholesale tile sales. The Inflation Reduction Act’s roughly $369 billion in climate and energy provisions, including home retrofit incentives, can accelerate remodel timing. Federal/state public spending cycles drive commercial orders, and targeted advocacy and bid alignment help Tile Shop capture policy-driven volume.
Building standards and local permitting
Local government codes directly shape Tile Shop specification choices for tile, adhesives and waterproofing, driving SKU mixes across the companys ~100 stores (2024). Changes to safety or accessibility rules—such as updated slip resistance or ADA-related thresholds—force assortment shifts and staff retraining. Permitting delays commonly extend project timing and site traffic, increasing lead times and holding costs. Strong contractor education programs reduce compliance friction and rework.
Labor and immigration policies
Installer availability for Tile Shop hinges on immigration and vocational programs; US construction employment stood near 7.5 million in 2024 (BLS) while seasonal H-2B visas remain capped at 66,000, constraining labor supply. Tight immigration rules and limited training raise install costs and timelines; targeted workforce grants and apprenticeships can ease constraints and protect service quality and sales conversion.
- Installer supply: dependent on immigration and training
- H-2B cap: 66,000 (affects seasonal hires)
- Construction jobs ~7.5M (BLS 2024)
- Apprenticeships/grants boost conversion and quality
Political stability and logistics
Port operations, trucking regulations and fuel policies materially affect delivery reliability: West Coast ports handle ≈40% of US container imports (LA/LB throughput ~9M TEU in 2023–24), trucking driver shortage ≈80,000 (ATA, 2024) and diesel ≈$4.00/gal (2024) raise delay and cost risks; strikes or regulatory shifts can stall imports, while multi-port routing and regional DCs limit disruption and transparent lead-time communication preserves customer trust.
- Port concentration ≈40% West Coast
- LA/LB throughput ~9M TEU (2023–24)
- Driver shortfall ≈80,000 (2024)
- Diesel ≈$4.00/gal (2024)
- Mitigation: multi-port + regional DCs + clear lead-times
Tariffs, labor & logistics squeeze $450B retrofit market; nearshoring and vendor diversification key
Tariffs (Section 301 up to 25%) and geopolitical friction raise landed costs; nearshoring and vendor diversification are critical. US home improvement ~$450B (2024) and IRA ~$369B drive retrofit demand; local codes and permitting affect SKUs and lead times. Labor constraints (H-2B cap 66,000; construction jobs ~7.5M) plus logistics risks (LA/LB ~9M TEU; driver gap ~80,000; diesel ~$4/gal) pressure margins.
| Factor | Key 2024–25 Data |
|---|---|
| Tariffs | Section 301 up to 25% |
| Market | Home improvement ~$450B; IRA ~$369B |
| Labor | H-2B cap 66,000; construction ~7.5M |
| Logistics | LA/LB ~9M TEU; driver gap ~80,000; diesel ~$4/gal |
What is included in the product
Detailed Word Document
Explores how external macro-environmental factors uniquely affect The Tile Shop across Political, Economic, Social, Technological, Environmental, and Legal dimensions; each section uses current industry and regional data, forward-looking insights, and sector-specific examples to help executives, consultants, and investors identify threats, opportunities, and strategic actions.
Customizable Excel Spreadsheet
A concise, visually segmented PESTLE summary for Tile Shop that highlights regulatory, economic, and supply‑chain risks to ease meeting prep and strategic alignment; editable notes let teams adapt insights to regions or product lines for faster decision‑making.
Economic factors
Housing cycle sensitivity
Tile demand tracks new-builds and remodels; with 30-year mortgage rates near 7% in 2024 (Freddie Mac) and U.S. homeowner equity around $28 trillion in Q4 2024 (Federal Reserve), big-ticket projects are rate-sensitive. Rising rates push customers to trade down or delay projects. Tile Shop defends share with promotions and value-engineered product lines.
Consumer spending and inflation
Inflation elevated materials, freight and labor costs, compressing margins as U.S. CPI ran about 3.4% year-over-year in mid-2025 while container rates remain down more than 60% from 2022 peaks, only partially easing input pressures. Real wages have been roughly flat, limiting discretionary remodel spend and slowing ticket growth. Tile Shop can use price architecture and private-label assortments to preserve perceived value. Dynamic pricing and SKU mix management protect gross profit.
Commercial project pipeline
Commercial orders at Tile Shop track hospitality (US hotel occupancy ~63.5% in 2023, STR), retail and healthcare projects and a multifamily pipeline still delivering roughly 300k completions in 2024, driving demand. Longer bid-to-install timelines require deeper inventory and strict credit discipline to protect margins. Higher policy rates (FFR ~5.25–5.50% in 2024–25) and muted capex outlook reshape backlog quality. Targeted B2B outreach helps smooth retail seasonality and stabilize order flow.
Currency and sourcing costs
FX volatility raises imported tile costs, pressuring Tile Shop gross margins; proactive hedging and multi-currency purchasing reduce short-term cost swings. Strong vendor contracts and dual sourcing increase procurement flexibility and resilience. Cost-to-serve analytics drive SKU rationalization to cut logistics and holding costs.
- FX exposure: hedge/multi-currency
- Supplier strategy: contracts + dual sourcing
- Operations: cost-to-serve → SKU cuts
Labor market and wages
Tight U.S. retail labor markets lift wages and turnover risk; U.S. retail employment was about 15.6 million in 2024 (BLS), squeezing specialty retailers like Tile Shop to offer higher pay and retention bonuses.
Training and incentive programs measurably improve productivity and NPS; scheduling tech optimizes staffing around traffic peaks while installer partnerships buffer capacity constraints during seasonal spikes.
- retail employment: 15.6 million (BLS, 2024)
- higher wages → increased labor cost pressure
- training/incentives → better productivity & NPS
- scheduling tech → staffing efficiency
- installer partnerships → flexible installation capacity
Tariffs, labor & logistics squeeze $450B retrofit market; nearshoring and vendor diversification key
Higher 30-year mortgage rates near 7% (2024) and $28T homeowner equity (Q4 2024) make remodel demand rate-sensitive; Tile Shop leans on promotions and value SKUs. Inflation ~3.4% YoY (mid-2025) and tight retail labor (15.6M jobs, 2024) compress margins; pricing, SKU mix and installer partnerships defend gross profit. FX and supplier strategy mitigate imported cost swings.
| Metric | Value |
|---|---|
| 30-yr mortgage | ~7% (2024) |
| Homeowner equity | $28T (Q4 2024) |
| CPI | ~3.4% YoY (mid-2025) |
| Retail employment | 15.6M (2024) |
Same Document Delivered
Tile Shop PESTLE Analysis
The Tile Shop PESTLE Analysis preview shown here is the exact document you’ll receive after purchase—fully formatted and ready to use. The layout, content, and structure visible are identical to the downloadable file, with no placeholders or teasers. After checkout you’ll instantly get this final, professionally structured report.
Original: $10.00
-65%$10.00
$3.50Description
Make Smarter Strategic Decisions with a Complete PESTEL View
Unlock strategic clarity with our PESTLE Analysis of Tile Shop—three to five-minute read, lifetime value for decisions. Learn how political shifts, economic cycles, and environmental trends affect growth and risk. Purchase the full report for detailed, actionable insights ready for immediate use.
Political factors
Trade policy and import tariffs
Many tile and stone products are imported, exposing Tile Shop to tariffs and geopolitical frictions; U.S. Section 301 tariffs on Chinese goods remain as high as 25%, which can materially raise landed costs and squeeze margins. Shifts in U.S.–China or EU trade policy can alter assortment viability and price elasticity. The company must diversify sourcing, hedge currency/tariff risk, and pursue active vendor management and nearshoring to stabilize margins.
Infrastructure and housing incentives
Government construction and renovation programs boost tile demand; the US home improvement market was roughly $450 billion in 2024, supporting retail and wholesale tile sales. The Inflation Reduction Act’s roughly $369 billion in climate and energy provisions, including home retrofit incentives, can accelerate remodel timing. Federal/state public spending cycles drive commercial orders, and targeted advocacy and bid alignment help Tile Shop capture policy-driven volume.
Building standards and local permitting
Local government codes directly shape Tile Shop specification choices for tile, adhesives and waterproofing, driving SKU mixes across the companys ~100 stores (2024). Changes to safety or accessibility rules—such as updated slip resistance or ADA-related thresholds—force assortment shifts and staff retraining. Permitting delays commonly extend project timing and site traffic, increasing lead times and holding costs. Strong contractor education programs reduce compliance friction and rework.
Labor and immigration policies
Installer availability for Tile Shop hinges on immigration and vocational programs; US construction employment stood near 7.5 million in 2024 (BLS) while seasonal H-2B visas remain capped at 66,000, constraining labor supply. Tight immigration rules and limited training raise install costs and timelines; targeted workforce grants and apprenticeships can ease constraints and protect service quality and sales conversion.
- Installer supply: dependent on immigration and training
- H-2B cap: 66,000 (affects seasonal hires)
- Construction jobs ~7.5M (BLS 2024)
- Apprenticeships/grants boost conversion and quality
Political stability and logistics
Port operations, trucking regulations and fuel policies materially affect delivery reliability: West Coast ports handle ≈40% of US container imports (LA/LB throughput ~9M TEU in 2023–24), trucking driver shortage ≈80,000 (ATA, 2024) and diesel ≈$4.00/gal (2024) raise delay and cost risks; strikes or regulatory shifts can stall imports, while multi-port routing and regional DCs limit disruption and transparent lead-time communication preserves customer trust.
- Port concentration ≈40% West Coast
- LA/LB throughput ~9M TEU (2023–24)
- Driver shortfall ≈80,000 (2024)
- Diesel ≈$4.00/gal (2024)
- Mitigation: multi-port + regional DCs + clear lead-times
Tariffs, labor & logistics squeeze $450B retrofit market; nearshoring and vendor diversification key
Tariffs (Section 301 up to 25%) and geopolitical friction raise landed costs; nearshoring and vendor diversification are critical. US home improvement ~$450B (2024) and IRA ~$369B drive retrofit demand; local codes and permitting affect SKUs and lead times. Labor constraints (H-2B cap 66,000; construction jobs ~7.5M) plus logistics risks (LA/LB ~9M TEU; driver gap ~80,000; diesel ~$4/gal) pressure margins.
| Factor | Key 2024–25 Data |
|---|---|
| Tariffs | Section 301 up to 25% |
| Market | Home improvement ~$450B; IRA ~$369B |
| Labor | H-2B cap 66,000; construction ~7.5M |
| Logistics | LA/LB ~9M TEU; driver gap ~80,000; diesel ~$4/gal |
What is included in the product
Detailed Word Document
Explores how external macro-environmental factors uniquely affect The Tile Shop across Political, Economic, Social, Technological, Environmental, and Legal dimensions; each section uses current industry and regional data, forward-looking insights, and sector-specific examples to help executives, consultants, and investors identify threats, opportunities, and strategic actions.
Customizable Excel Spreadsheet
A concise, visually segmented PESTLE summary for Tile Shop that highlights regulatory, economic, and supply‑chain risks to ease meeting prep and strategic alignment; editable notes let teams adapt insights to regions or product lines for faster decision‑making.
Economic factors
Housing cycle sensitivity
Tile demand tracks new-builds and remodels; with 30-year mortgage rates near 7% in 2024 (Freddie Mac) and U.S. homeowner equity around $28 trillion in Q4 2024 (Federal Reserve), big-ticket projects are rate-sensitive. Rising rates push customers to trade down or delay projects. Tile Shop defends share with promotions and value-engineered product lines.
Consumer spending and inflation
Inflation elevated materials, freight and labor costs, compressing margins as U.S. CPI ran about 3.4% year-over-year in mid-2025 while container rates remain down more than 60% from 2022 peaks, only partially easing input pressures. Real wages have been roughly flat, limiting discretionary remodel spend and slowing ticket growth. Tile Shop can use price architecture and private-label assortments to preserve perceived value. Dynamic pricing and SKU mix management protect gross profit.
Commercial project pipeline
Commercial orders at Tile Shop track hospitality (US hotel occupancy ~63.5% in 2023, STR), retail and healthcare projects and a multifamily pipeline still delivering roughly 300k completions in 2024, driving demand. Longer bid-to-install timelines require deeper inventory and strict credit discipline to protect margins. Higher policy rates (FFR ~5.25–5.50% in 2024–25) and muted capex outlook reshape backlog quality. Targeted B2B outreach helps smooth retail seasonality and stabilize order flow.
Currency and sourcing costs
FX volatility raises imported tile costs, pressuring Tile Shop gross margins; proactive hedging and multi-currency purchasing reduce short-term cost swings. Strong vendor contracts and dual sourcing increase procurement flexibility and resilience. Cost-to-serve analytics drive SKU rationalization to cut logistics and holding costs.
- FX exposure: hedge/multi-currency
- Supplier strategy: contracts + dual sourcing
- Operations: cost-to-serve → SKU cuts
Labor market and wages
Tight U.S. retail labor markets lift wages and turnover risk; U.S. retail employment was about 15.6 million in 2024 (BLS), squeezing specialty retailers like Tile Shop to offer higher pay and retention bonuses.
Training and incentive programs measurably improve productivity and NPS; scheduling tech optimizes staffing around traffic peaks while installer partnerships buffer capacity constraints during seasonal spikes.
- retail employment: 15.6 million (BLS, 2024)
- higher wages → increased labor cost pressure
- training/incentives → better productivity & NPS
- scheduling tech → staffing efficiency
- installer partnerships → flexible installation capacity
Tariffs, labor & logistics squeeze $450B retrofit market; nearshoring and vendor diversification key
Higher 30-year mortgage rates near 7% (2024) and $28T homeowner equity (Q4 2024) make remodel demand rate-sensitive; Tile Shop leans on promotions and value SKUs. Inflation ~3.4% YoY (mid-2025) and tight retail labor (15.6M jobs, 2024) compress margins; pricing, SKU mix and installer partnerships defend gross profit. FX and supplier strategy mitigate imported cost swings.
| Metric | Value |
|---|---|
| 30-yr mortgage | ~7% (2024) |
| Homeowner equity | $28T (Q4 2024) |
| CPI | ~3.4% YoY (mid-2025) |
| Retail employment | 15.6M (2024) |
Same Document Delivered
Tile Shop PESTLE Analysis
The Tile Shop PESTLE Analysis preview shown here is the exact document you’ll receive after purchase—fully formatted and ready to use. The layout, content, and structure visible are identical to the downloadable file, with no placeholders or teasers. After checkout you’ll instantly get this final, professionally structured report.











