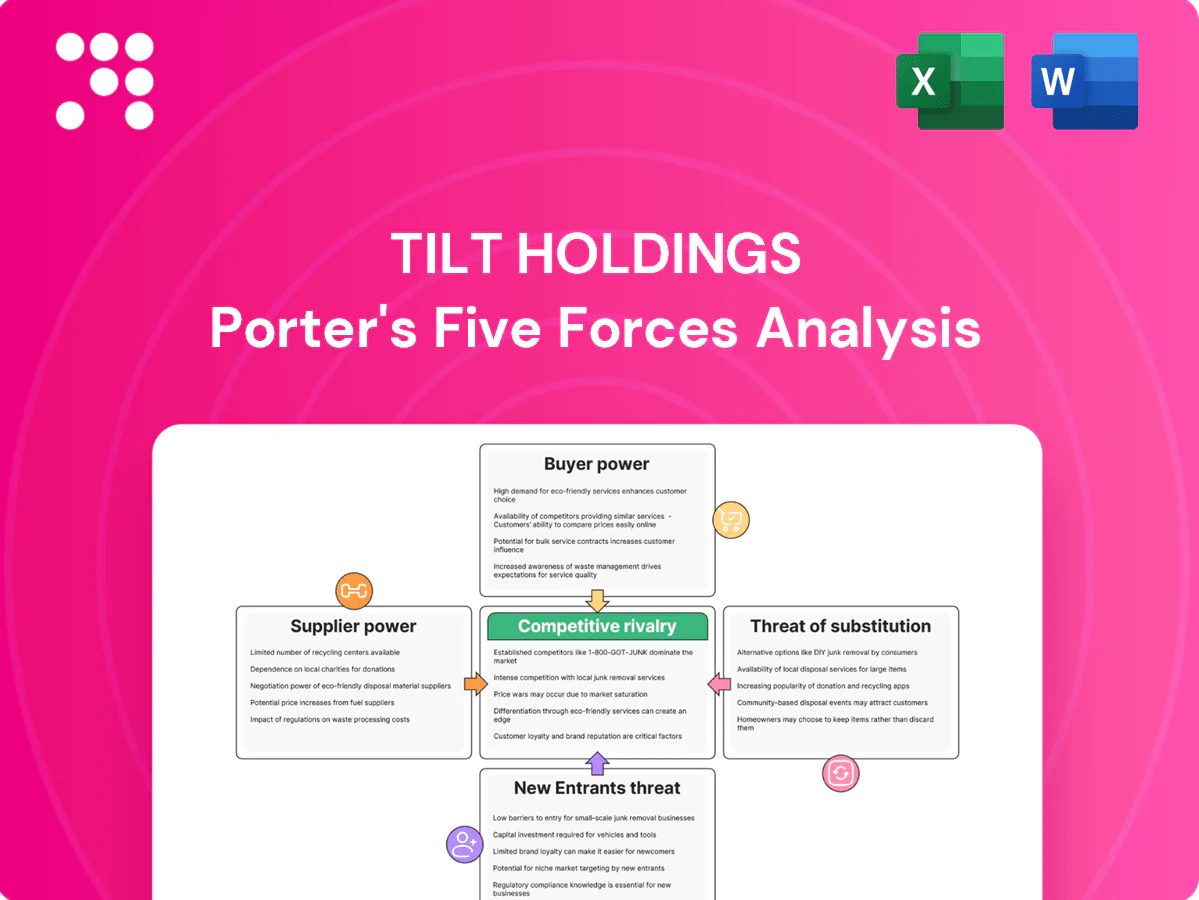
TILT Holdings Porter's Five Forces Analysis

Don't Miss the Bigger Picture
TILT Holdings faces moderate buyer power, concentrated suppliers, elevated competitive rivalry, low substitute threats, and regulatory-driven barriers to entry. This snapshot highlights strategic pressure points on margins and growth. The complete report reveals force-by-force ratings, visuals, and business implications. Unlock the full Porter's Five Forces Analysis to guide investment and strategy.
Suppliers Bargaining Power

Regulated input constraints
Compliance-approved hardware, packaging, and lab supplies narrow vendor choices for TILT, and state-by-state rules — 38 states with medical and 24 with adult-use programs in 2024 — limit interstate sourcing, reducing substitution options. Approved vendor lists and certifications create niche mini-monopolies, enabling suppliers to charge premiums. This supplier leverage can compress margins on equipment and compliant inputs, raising operating costs.
Specialized tech vendors
TILT’s tech and infrastructure stack depends on specialized software, IoT and extraction-equipment providers, with Flowhub alone serving over 1,000 dispensaries as of 2024, concentrating supplier influence. Proprietary components and tight integrations raise switching costs and extend migration timelines. Vendors holding unique IP can command stronger commercial terms, while multi-vendor strategies mitigate risk but interoperability remains a frequent bottleneck.

Upstream biomass and extracts
Upstream biomass availability and quality variability directly affect tolling and contract manufacturing margins; U.S. legal cannabis sales reached roughly 30 billion in 2024 (industry estimates), concentrating demand. Seasonal yield swings and state markets with often under 50 licensed cultivators tighten supply, creating episodic bargaining power for cultivators. Long-term offtake agreements reduce price and quality volatility and secure committed throughput.

Capital and real estate
Brand and component OEMs
Branded device OEMs and specialty component makers retain pricing leverage due to safety reputations and certification dependencies, and in 2024 many buyers still rely on certified suppliers for regulatory compliance. Warranties and liability exposure increase supplier bargaining power, while expanding global manufacturing and higher-capacity contract manufacturers in 2024 slowly dilute that control. Strategic sourcing, dual-sourcing and qualification of secondary suppliers reduce supply risk and price pressure for TILT.
- Supplier leverage: certification + warranty dependence
- Market trend 2024: growing global manufacturing options
- Mitigation: strategic sourcing and dual-supply
Elevated supplier power — 38/24 states, ~$30B market squeeze
Supplier power is elevated by regulatory-approved vendors, 38 states with medical and 24 with adult-use programs in 2024, and niche certifications that allow premium pricing, compressing margins. Tech and hardware concentration (Flowhub >1,000 dispensaries in 2024) raises switching costs, while biomass supply swings amid ~$30B legal U.S. sales in 2024 create episodic cultivator leverage.
| Metric | 2024 | Impact |
|---|---|---|
| States (medical/adult) | 38 / 24 | Limits sourcing |
| U.S. legal sales | ~$30B | Demand concentration |
| Flowhub reach | >1,000 dispensaries | Switching costs |
What is included in the product
 Detailed Word Document
Uncovers key competitive drivers, buyer/supplier power, threat of new entrants and substitutes, and disruptive risks facing TILT Holdings. Detailed, strategic commentary helps assess pricing pressure, market entry barriers and defensive positioning—editable for integration into investor decks or plans.

 Customizable Excel Spreadsheet
Clear one-sheet Porter's Five Forces for TILT Holdings—customize pressure levels, swap in your own data, and view impact instantly on a spider/radar chart for fast strategic decisions and slide-ready visuals; no macros required.
Customers Bargaining Power

Concentrated MSOs
In 2024 large multi-state operators (MSOs) aggregate purchasing across states to negotiate volume discounts and force vendor consolidation with tougher SLAs. Their scale means losing one MSO client can materially dent revenue for suppliers. TILT must defend value by offering deep customization, consistent reliability and contract protections to remain competitive with consolidated MSO buyers.
Price-sensitive retailers
Price-sensitive dispensaries operate on tight margins with frequent promotions, pressuring suppliers to cut costs and accept lower wholesale prices. They readily switch brands or service providers when quality parity exists, while rising private-label adoption increases retailer leverage. Differentiated services, loyalty-data analytics and category management support help suppliers retain accounts and protect margin erosion.

Switching costs via integration
Compliance, data, and process integrations create moderate switching costs for TILT; embedded SOPs and hardware-software ties reduce buyer willingness to change. Industry-standard SLAs (99.9% uptime) and documented regulatory-support services increase stickiness, while enterprise RFP cycles of 12–18 months can reset commercial terms and provide exit windows.

Dual-channel dynamics
B2B clients and end-consumers jointly shape demand and pricing for TILT, with U.S. legal cannabis sales topping over $30 billion in 2023–24, amplifying retailer bargaining leverage where brand pull is weak. Strong consumer brand pull can make SKUs must-carry, reducing retailer leverage and preserving pricing power. Absent that pull, large buyers dictate assortments and promotions, but a balanced dual-channel strategy—direct-to-consumer plus wholesale—tempers buyer leverage and stabilizes margins.
- Dual-channel: B2B and D2C influence pricing
- Brand pull: must-carry status reduces retailer power
- Buyer dictation: weak brands lose assortment control
- Strategy: balanced channels lower buyer leverage
Information transparency
Benchmarking on COGS, yields and device failure rates increases buyer sophistication; industry surveys in 2024 found roughly 80% of procurement teams use KPI comparisons to shortlist suppliers, making transparent metrics decisive.
Buyers quickly compare vendors on cost-per-unit, yield percentage and failure rates, and transparent performance data can either erode or justify pricing—vendors with <20% lower COGS or 5–10% better yields often retain price premiums.
Proactive reporting of uptime, failure rates and per-unit economics converts scrutiny into loyalty; suppliers publishing quarterly KPI dashboards in 2024 reported higher renewal rates and fewer price-driven RFP losses.
- COGS delta: up to 20% impact on pricing power
- Yield advantage: 5–10% translates to retention
- Failure rates: <10% critical threshold
- 82% buyers use KPI benchmarking (2024 survey)
MSO consolidation forces vendor scale; providers must offer customization, reliability, KPIs
MSO aggregation and scale force vendor consolidation; TILT must offer deep customization, high reliability and contract protections to remain competitive.
Price-sensitive dispensaries and rising private-labels compress margins; differentiated services and loyalty analytics protect accounts.
Benchmarking is decisive: 82% use KPIs (2024); COGS delta up to 20%, yield +5–10%, failure rates <10% critical.
| Metric | 2024 Value |
|---|---|
| US legal cannabis sales | $30B+ |
| KPI benchmarking | 82% |
| COGS delta | up to 20% |
| Yield advantage | 5–10% |
| Failure rate threshold | <10% |
Preview Before You Purchase
TILT Holdings Porter's Five Forces Analysis
This preview shows the exact Porter’s Five Forces analysis of TILT Holdings you'll receive immediately after purchase—no placeholders or samples. It’s the full, professionally formatted document ready for download and use upon payment. What you see is what you get.

Don't Miss the Bigger Picture
TILT Holdings faces moderate buyer power, concentrated suppliers, elevated competitive rivalry, low substitute threats, and regulatory-driven barriers to entry. This snapshot highlights strategic pressure points on margins and growth. The complete report reveals force-by-force ratings, visuals, and business implications. Unlock the full Porter's Five Forces Analysis to guide investment and strategy.
Suppliers Bargaining Power
Regulated input constraints
Compliance-approved hardware, packaging, and lab supplies narrow vendor choices for TILT, and state-by-state rules — 38 states with medical and 24 with adult-use programs in 2024 — limit interstate sourcing, reducing substitution options. Approved vendor lists and certifications create niche mini-monopolies, enabling suppliers to charge premiums. This supplier leverage can compress margins on equipment and compliant inputs, raising operating costs.
Specialized tech vendors
TILT’s tech and infrastructure stack depends on specialized software, IoT and extraction-equipment providers, with Flowhub alone serving over 1,000 dispensaries as of 2024, concentrating supplier influence. Proprietary components and tight integrations raise switching costs and extend migration timelines. Vendors holding unique IP can command stronger commercial terms, while multi-vendor strategies mitigate risk but interoperability remains a frequent bottleneck.
Upstream biomass and extracts
Upstream biomass availability and quality variability directly affect tolling and contract manufacturing margins; U.S. legal cannabis sales reached roughly 30 billion in 2024 (industry estimates), concentrating demand. Seasonal yield swings and state markets with often under 50 licensed cultivators tighten supply, creating episodic bargaining power for cultivators. Long-term offtake agreements reduce price and quality volatility and secure committed throughput.
Capital and real estate
Brand and component OEMs
Branded device OEMs and specialty component makers retain pricing leverage due to safety reputations and certification dependencies, and in 2024 many buyers still rely on certified suppliers for regulatory compliance. Warranties and liability exposure increase supplier bargaining power, while expanding global manufacturing and higher-capacity contract manufacturers in 2024 slowly dilute that control. Strategic sourcing, dual-sourcing and qualification of secondary suppliers reduce supply risk and price pressure for TILT.
- Supplier leverage: certification + warranty dependence
- Market trend 2024: growing global manufacturing options
- Mitigation: strategic sourcing and dual-supply
Elevated supplier power — 38/24 states, ~$30B market squeeze
Supplier power is elevated by regulatory-approved vendors, 38 states with medical and 24 with adult-use programs in 2024, and niche certifications that allow premium pricing, compressing margins. Tech and hardware concentration (Flowhub >1,000 dispensaries in 2024) raises switching costs, while biomass supply swings amid ~$30B legal U.S. sales in 2024 create episodic cultivator leverage.
| Metric | 2024 | Impact |
|---|---|---|
| States (medical/adult) | 38 / 24 | Limits sourcing |
| U.S. legal sales | ~$30B | Demand concentration |
| Flowhub reach | >1,000 dispensaries | Switching costs |
What is included in the product
Detailed Word Document
Uncovers key competitive drivers, buyer/supplier power, threat of new entrants and substitutes, and disruptive risks facing TILT Holdings. Detailed, strategic commentary helps assess pricing pressure, market entry barriers and defensive positioning—editable for integration into investor decks or plans.
Customizable Excel Spreadsheet
Clear one-sheet Porter's Five Forces for TILT Holdings—customize pressure levels, swap in your own data, and view impact instantly on a spider/radar chart for fast strategic decisions and slide-ready visuals; no macros required.
Customers Bargaining Power
Concentrated MSOs
In 2024 large multi-state operators (MSOs) aggregate purchasing across states to negotiate volume discounts and force vendor consolidation with tougher SLAs. Their scale means losing one MSO client can materially dent revenue for suppliers. TILT must defend value by offering deep customization, consistent reliability and contract protections to remain competitive with consolidated MSO buyers.
Price-sensitive retailers
Price-sensitive dispensaries operate on tight margins with frequent promotions, pressuring suppliers to cut costs and accept lower wholesale prices. They readily switch brands or service providers when quality parity exists, while rising private-label adoption increases retailer leverage. Differentiated services, loyalty-data analytics and category management support help suppliers retain accounts and protect margin erosion.
Switching costs via integration
Compliance, data, and process integrations create moderate switching costs for TILT; embedded SOPs and hardware-software ties reduce buyer willingness to change. Industry-standard SLAs (99.9% uptime) and documented regulatory-support services increase stickiness, while enterprise RFP cycles of 12–18 months can reset commercial terms and provide exit windows.
Dual-channel dynamics
B2B clients and end-consumers jointly shape demand and pricing for TILT, with U.S. legal cannabis sales topping over $30 billion in 2023–24, amplifying retailer bargaining leverage where brand pull is weak. Strong consumer brand pull can make SKUs must-carry, reducing retailer leverage and preserving pricing power. Absent that pull, large buyers dictate assortments and promotions, but a balanced dual-channel strategy—direct-to-consumer plus wholesale—tempers buyer leverage and stabilizes margins.
- Dual-channel: B2B and D2C influence pricing
- Brand pull: must-carry status reduces retailer power
- Buyer dictation: weak brands lose assortment control
- Strategy: balanced channels lower buyer leverage
Information transparency
Benchmarking on COGS, yields and device failure rates increases buyer sophistication; industry surveys in 2024 found roughly 80% of procurement teams use KPI comparisons to shortlist suppliers, making transparent metrics decisive.
Buyers quickly compare vendors on cost-per-unit, yield percentage and failure rates, and transparent performance data can either erode or justify pricing—vendors with <20% lower COGS or 5–10% better yields often retain price premiums.
Proactive reporting of uptime, failure rates and per-unit economics converts scrutiny into loyalty; suppliers publishing quarterly KPI dashboards in 2024 reported higher renewal rates and fewer price-driven RFP losses.
- COGS delta: up to 20% impact on pricing power
- Yield advantage: 5–10% translates to retention
- Failure rates: <10% critical threshold
- 82% buyers use KPI benchmarking (2024 survey)
MSO consolidation forces vendor scale; providers must offer customization, reliability, KPIs
MSO aggregation and scale force vendor consolidation; TILT must offer deep customization, high reliability and contract protections to remain competitive.
Price-sensitive dispensaries and rising private-labels compress margins; differentiated services and loyalty analytics protect accounts.
Benchmarking is decisive: 82% use KPIs (2024); COGS delta up to 20%, yield +5–10%, failure rates <10% critical.
| Metric | 2024 Value |
|---|---|
| US legal cannabis sales | $30B+ |
| KPI benchmarking | 82% |
| COGS delta | up to 20% |
| Yield advantage | 5–10% |
| Failure rate threshold | <10% |
Preview Before You Purchase
TILT Holdings Porter's Five Forces Analysis
This preview shows the exact Porter’s Five Forces analysis of TILT Holdings you'll receive immediately after purchase—no placeholders or samples. It’s the full, professionally formatted document ready for download and use upon payment. What you see is what you get.
Description
Don't Miss the Bigger Picture
TILT Holdings faces moderate buyer power, concentrated suppliers, elevated competitive rivalry, low substitute threats, and regulatory-driven barriers to entry. This snapshot highlights strategic pressure points on margins and growth. The complete report reveals force-by-force ratings, visuals, and business implications. Unlock the full Porter's Five Forces Analysis to guide investment and strategy.
Suppliers Bargaining Power
Regulated input constraints
Compliance-approved hardware, packaging, and lab supplies narrow vendor choices for TILT, and state-by-state rules — 38 states with medical and 24 with adult-use programs in 2024 — limit interstate sourcing, reducing substitution options. Approved vendor lists and certifications create niche mini-monopolies, enabling suppliers to charge premiums. This supplier leverage can compress margins on equipment and compliant inputs, raising operating costs.
Specialized tech vendors
TILT’s tech and infrastructure stack depends on specialized software, IoT and extraction-equipment providers, with Flowhub alone serving over 1,000 dispensaries as of 2024, concentrating supplier influence. Proprietary components and tight integrations raise switching costs and extend migration timelines. Vendors holding unique IP can command stronger commercial terms, while multi-vendor strategies mitigate risk but interoperability remains a frequent bottleneck.
Upstream biomass and extracts
Upstream biomass availability and quality variability directly affect tolling and contract manufacturing margins; U.S. legal cannabis sales reached roughly 30 billion in 2024 (industry estimates), concentrating demand. Seasonal yield swings and state markets with often under 50 licensed cultivators tighten supply, creating episodic bargaining power for cultivators. Long-term offtake agreements reduce price and quality volatility and secure committed throughput.
Capital and real estate
Brand and component OEMs
Branded device OEMs and specialty component makers retain pricing leverage due to safety reputations and certification dependencies, and in 2024 many buyers still rely on certified suppliers for regulatory compliance. Warranties and liability exposure increase supplier bargaining power, while expanding global manufacturing and higher-capacity contract manufacturers in 2024 slowly dilute that control. Strategic sourcing, dual-sourcing and qualification of secondary suppliers reduce supply risk and price pressure for TILT.
- Supplier leverage: certification + warranty dependence
- Market trend 2024: growing global manufacturing options
- Mitigation: strategic sourcing and dual-supply
Elevated supplier power — 38/24 states, ~$30B market squeeze
Supplier power is elevated by regulatory-approved vendors, 38 states with medical and 24 with adult-use programs in 2024, and niche certifications that allow premium pricing, compressing margins. Tech and hardware concentration (Flowhub >1,000 dispensaries in 2024) raises switching costs, while biomass supply swings amid ~$30B legal U.S. sales in 2024 create episodic cultivator leverage.
| Metric | 2024 | Impact |
|---|---|---|
| States (medical/adult) | 38 / 24 | Limits sourcing |
| U.S. legal sales | ~$30B | Demand concentration |
| Flowhub reach | >1,000 dispensaries | Switching costs |
What is included in the product
Detailed Word Document
Uncovers key competitive drivers, buyer/supplier power, threat of new entrants and substitutes, and disruptive risks facing TILT Holdings. Detailed, strategic commentary helps assess pricing pressure, market entry barriers and defensive positioning—editable for integration into investor decks or plans.
Customizable Excel Spreadsheet
Clear one-sheet Porter's Five Forces for TILT Holdings—customize pressure levels, swap in your own data, and view impact instantly on a spider/radar chart for fast strategic decisions and slide-ready visuals; no macros required.
Customers Bargaining Power
Concentrated MSOs
In 2024 large multi-state operators (MSOs) aggregate purchasing across states to negotiate volume discounts and force vendor consolidation with tougher SLAs. Their scale means losing one MSO client can materially dent revenue for suppliers. TILT must defend value by offering deep customization, consistent reliability and contract protections to remain competitive with consolidated MSO buyers.
Price-sensitive retailers
Price-sensitive dispensaries operate on tight margins with frequent promotions, pressuring suppliers to cut costs and accept lower wholesale prices. They readily switch brands or service providers when quality parity exists, while rising private-label adoption increases retailer leverage. Differentiated services, loyalty-data analytics and category management support help suppliers retain accounts and protect margin erosion.
Switching costs via integration
Compliance, data, and process integrations create moderate switching costs for TILT; embedded SOPs and hardware-software ties reduce buyer willingness to change. Industry-standard SLAs (99.9% uptime) and documented regulatory-support services increase stickiness, while enterprise RFP cycles of 12–18 months can reset commercial terms and provide exit windows.
Dual-channel dynamics
B2B clients and end-consumers jointly shape demand and pricing for TILT, with U.S. legal cannabis sales topping over $30 billion in 2023–24, amplifying retailer bargaining leverage where brand pull is weak. Strong consumer brand pull can make SKUs must-carry, reducing retailer leverage and preserving pricing power. Absent that pull, large buyers dictate assortments and promotions, but a balanced dual-channel strategy—direct-to-consumer plus wholesale—tempers buyer leverage and stabilizes margins.
- Dual-channel: B2B and D2C influence pricing
- Brand pull: must-carry status reduces retailer power
- Buyer dictation: weak brands lose assortment control
- Strategy: balanced channels lower buyer leverage
Information transparency
Benchmarking on COGS, yields and device failure rates increases buyer sophistication; industry surveys in 2024 found roughly 80% of procurement teams use KPI comparisons to shortlist suppliers, making transparent metrics decisive.
Buyers quickly compare vendors on cost-per-unit, yield percentage and failure rates, and transparent performance data can either erode or justify pricing—vendors with <20% lower COGS or 5–10% better yields often retain price premiums.
Proactive reporting of uptime, failure rates and per-unit economics converts scrutiny into loyalty; suppliers publishing quarterly KPI dashboards in 2024 reported higher renewal rates and fewer price-driven RFP losses.
- COGS delta: up to 20% impact on pricing power
- Yield advantage: 5–10% translates to retention
- Failure rates: <10% critical threshold
- 82% buyers use KPI benchmarking (2024 survey)
MSO consolidation forces vendor scale; providers must offer customization, reliability, KPIs
MSO aggregation and scale force vendor consolidation; TILT must offer deep customization, high reliability and contract protections to remain competitive.
Price-sensitive dispensaries and rising private-labels compress margins; differentiated services and loyalty analytics protect accounts.
Benchmarking is decisive: 82% use KPIs (2024); COGS delta up to 20%, yield +5–10%, failure rates <10% critical.
| Metric | 2024 Value |
|---|---|
| US legal cannabis sales | $30B+ |
| KPI benchmarking | 82% |
| COGS delta | up to 20% |
| Yield advantage | 5–10% |
| Failure rate threshold | <10% |
Preview Before You Purchase
TILT Holdings Porter's Five Forces Analysis
This preview shows the exact Porter’s Five Forces analysis of TILT Holdings you'll receive immediately after purchase—no placeholders or samples. It’s the full, professionally formatted document ready for download and use upon payment. What you see is what you get.











