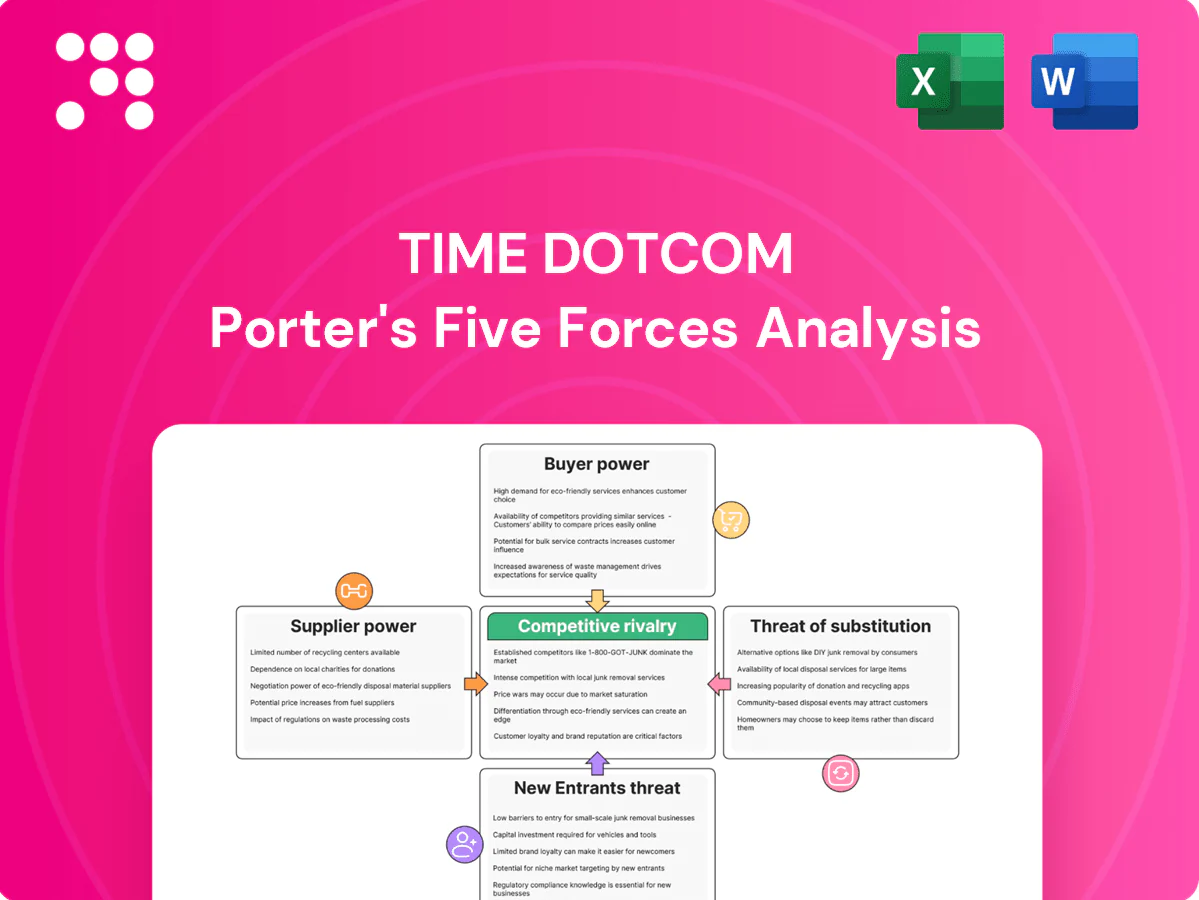
TIME dotCom Porter's Five Forces Analysis

Go Beyond the Preview—Access the Full Strategic Report
TIME dotCom faces moderate buyer power with large enterprise clients, supplier dependence for backbone infrastructure, intense rivalry from regional telcos and OTT players, and a measurable threat from mobile and cloud substitutes; this snapshot highlights key strategic pressures. Unlock the full Porter's Five Forces Analysis to access detailed force ratings, scenarios, and actionable recommendations for investment or strategy.
Suppliers Bargaining Power

Concentrated network equipment vendors
In 2024, core transport and access gear remains supplied by a few OEMs such as Huawei, Nokia and Cisco, raising TIME dotCom’s vendor dependence. Limited interoperability and vendor certification paths increase switching costs and deployment risk. OEMs can shape pricing, support SLAs and upgrade cycles, affecting Opex and CapEx timing. Dual-vendor strategies reduce but do not remove supplier leverage.
Rights-of-way and civil works providers
Local councils, utilities and contractors control permits, ducts and digs, allowing them to impose fees or delays that can squeeze margins and timelines for TIME dotCom. Scarce urban ducts in congested corridors increase supplier leverage, while permit lead times commonly range from weeks to several months. Long-term wayleave agreements, commonly 10–25 years, partially stabilize access terms and cashflow predictability.

Subsea cable consortia and landing parties
International capacity for TIME dotCom depends on subsea cable consortia such as AAG and SEA-ME-WE, with subsea systems carrying about 97% of global internet traffic (2024); capacity pricing and upgrade schedules are often set by wholesale owners and can be supplier-driven. Holding participation stakes limits cash exposure but does not eliminate dependency on consortium timelines or pricing. Achieving true route diversity requires multi-party negotiations across consortia and landing parties.

Power utilities and data center critical suppliers
Data centers require high-quality, redundant power at scale, with energy typically representing about 30–40% of operating costs for hyperscale and colocation facilities in 2024; tariffs, connection lead times and fuel prices directly compress unit economics.
Backup generators and precision cooling suppliers are specialized vendors with strong technical leverage; energy market volatility passes through to opex via fuel and grid price swings.
- Energy share: 30–40% of opex
- Specialized vendor leverage: high
- Tariffs/lead times: material impact on unit economics
Tower/duct owners and dark fiber lessors
Where leasing is needed, tower/duct owners and dark‑fiber lessors exercise strong leverage by imposing CPI or fixed escalators (commonly 3–5% p.a.) and limited route alternatives in key corridors raise switching costs; IRU commitments (typically 10–25 years) lock cash flows to suppliers, while building‑owning customers can negotiate cross‑tenant concessions to offset rents.
- IRU duration: 10–25 years
- Typical escalator: 3–5% p.a.
- Key corridors: limited alternative routes
- Building owners: extract cross‑tenant concessions
High OEM concentration, locked IRUs and rising energy costs squeeze network and DC margins
Supplier power is high: core OEMs (Huawei, Nokia, Cisco) concentrate equipment supply; switching costs and certification raise CapEx/Opex risk. Permits, ducts and IRUs (10–25y) plus limited corridor routes and 3–5% escalators constrain flexibility. Subsea consortia drive international capacity (97% of traffic, 2024) and energy (30–40% of DC opex) passes through to margins.
| Item | Metric (2024) | Impact |
|---|---|---|
| OEM concentration | Huawei/Nokia/Cisco | High |
| Subsea share | 97% global traffic | Supplier pricing risk |
| Energy | 30–40% opex | Margin sensitivity |
| IRU/escalator | 10–25y / 3–5% p.a. | Locked costs |
What is included in the product
 Detailed Word Document
Uncovers key drivers of competition, customer influence, and market entry risks tailored to TIME dotCom, evaluating supplier and buyer power, substitutes, rivalry intensity, and barriers to entry. Identifies disruptive threats and strategic levers to protect market share and enhance long‑term profitability.

 Customizable Excel Spreadsheet
A concise, one-sheet Porter's Five Forces for TIME dotCom—instantly visualizes competitive pressure with a spider chart and clean layout for pitch decks or boardroom slides. Swap in your own data, duplicate scenarios (pre/post regulation) and integrate into Excel dashboards without macros for fast, non-technical decision-making.
Customers Bargaining Power

Large wholesale carriers and hyperscalers
Large wholesale carriers and hyperscalers buy at scale and negotiate aggressively, often multi-homing to benchmark prices. AWS, Microsoft and Google held roughly 64% of global cloud market share in 2024, strengthening their leverage over suppliers. Contract renewals hinge on performance and cost; volume discounts and custom SLAs compress TIME dotCom margins.
Enterprise customers with multi-sourcing
By 2024 many enterprise IT buyers deploy dual-carrier strategies alongside SD-WAN to boost resilience, reducing single-vendor dependence. Switching barriers are moderate because standardized interfaces and interoperable CPE lower technical lock-in. RFP-driven procurement keeps pricing and contract terms competitive, though tailored value-added services (managed SD-WAN, security) can shift negotiations from pure price to total-cost-of-ownership.

Retail fiber users sensitive to price
Consumers compare speed-price bundles across ISPs, with TIME marketing up to 1 Gbps retail plans in 2024 and frequent 12-month promotional tariffs; churn typically spikes when promotions expire or rivals upgrade speeds. Porting processes and CPE lock-ins create minor frictions that dampen switching, while TIME’s brand and measured service quality help curb buyer power.

Colocation clients demanding uptime
Colocation clients insisting on high availability force TIME dotCom into strict SLAs often targeting 99.99%–99.999% uptime (≈52.6 to 5.26 minutes annual downtime), with service credits and penalties in contracts; buyers resist full pass-through of higher pricing for resilience upgrades. Expansion rights and cross-connect fees are tightly negotiated, and outage-driven reputation risk amplifies buyer leverage in renewals and RFPs.
- SLAs: 99.99%–99.999% uptime
- Downtime equiv.: ~52.6 to ~5.26 min/year
- Credits/penalties: standard negotiation lever
- Cross-connect/expansion: heavily negotiated
International carriers seeking regional reach
International carriers seeking regional reach can bypass TIME dotCom by routing traffic via alternative hubs and competing cables, keeping negotiation leverage high; transparent wholesale pricing across Asia-Pacific limits TIME dotCom’s ability to extract premium rates. Commit charges tied to usage volumes are frequently contested in contracts, and while unique routes (e.g., certain landing stations) reduce but do not eliminate carrier bargaining power.
- alternative-routing leverage
- wholesale-pricing transparency
- contested commit charges
- route uniqueness moderates leverage
Hyperscalers (~64%) squeeze pricing; SD‑WAN and dual‑carrier shift value
Wholesale buyers and hyperscalers (AWS/Microsoft/Google = ~64% cloud share in 2024) exert strong price leverage on TIME dotCom.
Enterprises use dual‑carrier and SD‑WAN strategies lowering switching costs; RFPs keep margins pressured while value‑added services shift negotiations.
Retail competition (TIME retail up to 1 Gbps in 2024) and minor CPE lock‑ins moderate consumer bargaining power.
| Metric | 2024 value |
|---|---|
| Global hyperscaler share | ~64% |
| Max retail speed | 1 Gbps |
| SLA uptime | 99.99%–99.999% (~52.6–5.26 min/yr) |
Preview the Actual Deliverable
TIME dotCom Porter's Five Forces Analysis
This preview shows the exact Porter’s Five Forces analysis for TIME dotCom that you’ll receive—fully written, professionally formatted, and ready for immediate use. The file displayed is the same complete document available for instant download after purchase, with no placeholders or samples. Buy now and gain immediate access to this final, actionable analysis.

Go Beyond the Preview—Access the Full Strategic Report
TIME dotCom faces moderate buyer power with large enterprise clients, supplier dependence for backbone infrastructure, intense rivalry from regional telcos and OTT players, and a measurable threat from mobile and cloud substitutes; this snapshot highlights key strategic pressures. Unlock the full Porter's Five Forces Analysis to access detailed force ratings, scenarios, and actionable recommendations for investment or strategy.
Suppliers Bargaining Power
Concentrated network equipment vendors
In 2024, core transport and access gear remains supplied by a few OEMs such as Huawei, Nokia and Cisco, raising TIME dotCom’s vendor dependence. Limited interoperability and vendor certification paths increase switching costs and deployment risk. OEMs can shape pricing, support SLAs and upgrade cycles, affecting Opex and CapEx timing. Dual-vendor strategies reduce but do not remove supplier leverage.
Rights-of-way and civil works providers
Local councils, utilities and contractors control permits, ducts and digs, allowing them to impose fees or delays that can squeeze margins and timelines for TIME dotCom. Scarce urban ducts in congested corridors increase supplier leverage, while permit lead times commonly range from weeks to several months. Long-term wayleave agreements, commonly 10–25 years, partially stabilize access terms and cashflow predictability.
Subsea cable consortia and landing parties
International capacity for TIME dotCom depends on subsea cable consortia such as AAG and SEA-ME-WE, with subsea systems carrying about 97% of global internet traffic (2024); capacity pricing and upgrade schedules are often set by wholesale owners and can be supplier-driven. Holding participation stakes limits cash exposure but does not eliminate dependency on consortium timelines or pricing. Achieving true route diversity requires multi-party negotiations across consortia and landing parties.
Power utilities and data center critical suppliers
Data centers require high-quality, redundant power at scale, with energy typically representing about 30–40% of operating costs for hyperscale and colocation facilities in 2024; tariffs, connection lead times and fuel prices directly compress unit economics.
Backup generators and precision cooling suppliers are specialized vendors with strong technical leverage; energy market volatility passes through to opex via fuel and grid price swings.
- Energy share: 30–40% of opex
- Specialized vendor leverage: high
- Tariffs/lead times: material impact on unit economics
Tower/duct owners and dark fiber lessors
Where leasing is needed, tower/duct owners and dark‑fiber lessors exercise strong leverage by imposing CPI or fixed escalators (commonly 3–5% p.a.) and limited route alternatives in key corridors raise switching costs; IRU commitments (typically 10–25 years) lock cash flows to suppliers, while building‑owning customers can negotiate cross‑tenant concessions to offset rents.
- IRU duration: 10–25 years
- Typical escalator: 3–5% p.a.
- Key corridors: limited alternative routes
- Building owners: extract cross‑tenant concessions
High OEM concentration, locked IRUs and rising energy costs squeeze network and DC margins
Supplier power is high: core OEMs (Huawei, Nokia, Cisco) concentrate equipment supply; switching costs and certification raise CapEx/Opex risk. Permits, ducts and IRUs (10–25y) plus limited corridor routes and 3–5% escalators constrain flexibility. Subsea consortia drive international capacity (97% of traffic, 2024) and energy (30–40% of DC opex) passes through to margins.
| Item | Metric (2024) | Impact |
|---|---|---|
| OEM concentration | Huawei/Nokia/Cisco | High |
| Subsea share | 97% global traffic | Supplier pricing risk |
| Energy | 30–40% opex | Margin sensitivity |
| IRU/escalator | 10–25y / 3–5% p.a. | Locked costs |
What is included in the product
Detailed Word Document
Uncovers key drivers of competition, customer influence, and market entry risks tailored to TIME dotCom, evaluating supplier and buyer power, substitutes, rivalry intensity, and barriers to entry. Identifies disruptive threats and strategic levers to protect market share and enhance long‑term profitability.
Customizable Excel Spreadsheet
A concise, one-sheet Porter's Five Forces for TIME dotCom—instantly visualizes competitive pressure with a spider chart and clean layout for pitch decks or boardroom slides. Swap in your own data, duplicate scenarios (pre/post regulation) and integrate into Excel dashboards without macros for fast, non-technical decision-making.
Customers Bargaining Power
Large wholesale carriers and hyperscalers
Large wholesale carriers and hyperscalers buy at scale and negotiate aggressively, often multi-homing to benchmark prices. AWS, Microsoft and Google held roughly 64% of global cloud market share in 2024, strengthening their leverage over suppliers. Contract renewals hinge on performance and cost; volume discounts and custom SLAs compress TIME dotCom margins.
Enterprise customers with multi-sourcing
By 2024 many enterprise IT buyers deploy dual-carrier strategies alongside SD-WAN to boost resilience, reducing single-vendor dependence. Switching barriers are moderate because standardized interfaces and interoperable CPE lower technical lock-in. RFP-driven procurement keeps pricing and contract terms competitive, though tailored value-added services (managed SD-WAN, security) can shift negotiations from pure price to total-cost-of-ownership.
Retail fiber users sensitive to price
Consumers compare speed-price bundles across ISPs, with TIME marketing up to 1 Gbps retail plans in 2024 and frequent 12-month promotional tariffs; churn typically spikes when promotions expire or rivals upgrade speeds. Porting processes and CPE lock-ins create minor frictions that dampen switching, while TIME’s brand and measured service quality help curb buyer power.
Colocation clients demanding uptime
Colocation clients insisting on high availability force TIME dotCom into strict SLAs often targeting 99.99%–99.999% uptime (≈52.6 to 5.26 minutes annual downtime), with service credits and penalties in contracts; buyers resist full pass-through of higher pricing for resilience upgrades. Expansion rights and cross-connect fees are tightly negotiated, and outage-driven reputation risk amplifies buyer leverage in renewals and RFPs.
- SLAs: 99.99%–99.999% uptime
- Downtime equiv.: ~52.6 to ~5.26 min/year
- Credits/penalties: standard negotiation lever
- Cross-connect/expansion: heavily negotiated
International carriers seeking regional reach
International carriers seeking regional reach can bypass TIME dotCom by routing traffic via alternative hubs and competing cables, keeping negotiation leverage high; transparent wholesale pricing across Asia-Pacific limits TIME dotCom’s ability to extract premium rates. Commit charges tied to usage volumes are frequently contested in contracts, and while unique routes (e.g., certain landing stations) reduce but do not eliminate carrier bargaining power.
- alternative-routing leverage
- wholesale-pricing transparency
- contested commit charges
- route uniqueness moderates leverage
Hyperscalers (~64%) squeeze pricing; SD‑WAN and dual‑carrier shift value
Wholesale buyers and hyperscalers (AWS/Microsoft/Google = ~64% cloud share in 2024) exert strong price leverage on TIME dotCom.
Enterprises use dual‑carrier and SD‑WAN strategies lowering switching costs; RFPs keep margins pressured while value‑added services shift negotiations.
Retail competition (TIME retail up to 1 Gbps in 2024) and minor CPE lock‑ins moderate consumer bargaining power.
| Metric | 2024 value |
|---|---|
| Global hyperscaler share | ~64% |
| Max retail speed | 1 Gbps |
| SLA uptime | 99.99%–99.999% (~52.6–5.26 min/yr) |
Preview the Actual Deliverable
TIME dotCom Porter's Five Forces Analysis
This preview shows the exact Porter’s Five Forces analysis for TIME dotCom that you’ll receive—fully written, professionally formatted, and ready for immediate use. The file displayed is the same complete document available for instant download after purchase, with no placeholders or samples. Buy now and gain immediate access to this final, actionable analysis.
Original: $10.00
-65%$10.00
$3.50Description
Go Beyond the Preview—Access the Full Strategic Report
TIME dotCom faces moderate buyer power with large enterprise clients, supplier dependence for backbone infrastructure, intense rivalry from regional telcos and OTT players, and a measurable threat from mobile and cloud substitutes; this snapshot highlights key strategic pressures. Unlock the full Porter's Five Forces Analysis to access detailed force ratings, scenarios, and actionable recommendations for investment or strategy.
Suppliers Bargaining Power
Concentrated network equipment vendors
In 2024, core transport and access gear remains supplied by a few OEMs such as Huawei, Nokia and Cisco, raising TIME dotCom’s vendor dependence. Limited interoperability and vendor certification paths increase switching costs and deployment risk. OEMs can shape pricing, support SLAs and upgrade cycles, affecting Opex and CapEx timing. Dual-vendor strategies reduce but do not remove supplier leverage.
Rights-of-way and civil works providers
Local councils, utilities and contractors control permits, ducts and digs, allowing them to impose fees or delays that can squeeze margins and timelines for TIME dotCom. Scarce urban ducts in congested corridors increase supplier leverage, while permit lead times commonly range from weeks to several months. Long-term wayleave agreements, commonly 10–25 years, partially stabilize access terms and cashflow predictability.
Subsea cable consortia and landing parties
International capacity for TIME dotCom depends on subsea cable consortia such as AAG and SEA-ME-WE, with subsea systems carrying about 97% of global internet traffic (2024); capacity pricing and upgrade schedules are often set by wholesale owners and can be supplier-driven. Holding participation stakes limits cash exposure but does not eliminate dependency on consortium timelines or pricing. Achieving true route diversity requires multi-party negotiations across consortia and landing parties.
Power utilities and data center critical suppliers
Data centers require high-quality, redundant power at scale, with energy typically representing about 30–40% of operating costs for hyperscale and colocation facilities in 2024; tariffs, connection lead times and fuel prices directly compress unit economics.
Backup generators and precision cooling suppliers are specialized vendors with strong technical leverage; energy market volatility passes through to opex via fuel and grid price swings.
- Energy share: 30–40% of opex
- Specialized vendor leverage: high
- Tariffs/lead times: material impact on unit economics
Tower/duct owners and dark fiber lessors
Where leasing is needed, tower/duct owners and dark‑fiber lessors exercise strong leverage by imposing CPI or fixed escalators (commonly 3–5% p.a.) and limited route alternatives in key corridors raise switching costs; IRU commitments (typically 10–25 years) lock cash flows to suppliers, while building‑owning customers can negotiate cross‑tenant concessions to offset rents.
- IRU duration: 10–25 years
- Typical escalator: 3–5% p.a.
- Key corridors: limited alternative routes
- Building owners: extract cross‑tenant concessions
High OEM concentration, locked IRUs and rising energy costs squeeze network and DC margins
Supplier power is high: core OEMs (Huawei, Nokia, Cisco) concentrate equipment supply; switching costs and certification raise CapEx/Opex risk. Permits, ducts and IRUs (10–25y) plus limited corridor routes and 3–5% escalators constrain flexibility. Subsea consortia drive international capacity (97% of traffic, 2024) and energy (30–40% of DC opex) passes through to margins.
| Item | Metric (2024) | Impact |
|---|---|---|
| OEM concentration | Huawei/Nokia/Cisco | High |
| Subsea share | 97% global traffic | Supplier pricing risk |
| Energy | 30–40% opex | Margin sensitivity |
| IRU/escalator | 10–25y / 3–5% p.a. | Locked costs |
What is included in the product
Detailed Word Document
Uncovers key drivers of competition, customer influence, and market entry risks tailored to TIME dotCom, evaluating supplier and buyer power, substitutes, rivalry intensity, and barriers to entry. Identifies disruptive threats and strategic levers to protect market share and enhance long‑term profitability.
Customizable Excel Spreadsheet
A concise, one-sheet Porter's Five Forces for TIME dotCom—instantly visualizes competitive pressure with a spider chart and clean layout for pitch decks or boardroom slides. Swap in your own data, duplicate scenarios (pre/post regulation) and integrate into Excel dashboards without macros for fast, non-technical decision-making.
Customers Bargaining Power
Large wholesale carriers and hyperscalers
Large wholesale carriers and hyperscalers buy at scale and negotiate aggressively, often multi-homing to benchmark prices. AWS, Microsoft and Google held roughly 64% of global cloud market share in 2024, strengthening their leverage over suppliers. Contract renewals hinge on performance and cost; volume discounts and custom SLAs compress TIME dotCom margins.
Enterprise customers with multi-sourcing
By 2024 many enterprise IT buyers deploy dual-carrier strategies alongside SD-WAN to boost resilience, reducing single-vendor dependence. Switching barriers are moderate because standardized interfaces and interoperable CPE lower technical lock-in. RFP-driven procurement keeps pricing and contract terms competitive, though tailored value-added services (managed SD-WAN, security) can shift negotiations from pure price to total-cost-of-ownership.
Retail fiber users sensitive to price
Consumers compare speed-price bundles across ISPs, with TIME marketing up to 1 Gbps retail plans in 2024 and frequent 12-month promotional tariffs; churn typically spikes when promotions expire or rivals upgrade speeds. Porting processes and CPE lock-ins create minor frictions that dampen switching, while TIME’s brand and measured service quality help curb buyer power.
Colocation clients demanding uptime
Colocation clients insisting on high availability force TIME dotCom into strict SLAs often targeting 99.99%–99.999% uptime (≈52.6 to 5.26 minutes annual downtime), with service credits and penalties in contracts; buyers resist full pass-through of higher pricing for resilience upgrades. Expansion rights and cross-connect fees are tightly negotiated, and outage-driven reputation risk amplifies buyer leverage in renewals and RFPs.
- SLAs: 99.99%–99.999% uptime
- Downtime equiv.: ~52.6 to ~5.26 min/year
- Credits/penalties: standard negotiation lever
- Cross-connect/expansion: heavily negotiated
International carriers seeking regional reach
International carriers seeking regional reach can bypass TIME dotCom by routing traffic via alternative hubs and competing cables, keeping negotiation leverage high; transparent wholesale pricing across Asia-Pacific limits TIME dotCom’s ability to extract premium rates. Commit charges tied to usage volumes are frequently contested in contracts, and while unique routes (e.g., certain landing stations) reduce but do not eliminate carrier bargaining power.
- alternative-routing leverage
- wholesale-pricing transparency
- contested commit charges
- route uniqueness moderates leverage
Hyperscalers (~64%) squeeze pricing; SD‑WAN and dual‑carrier shift value
Wholesale buyers and hyperscalers (AWS/Microsoft/Google = ~64% cloud share in 2024) exert strong price leverage on TIME dotCom.
Enterprises use dual‑carrier and SD‑WAN strategies lowering switching costs; RFPs keep margins pressured while value‑added services shift negotiations.
Retail competition (TIME retail up to 1 Gbps in 2024) and minor CPE lock‑ins moderate consumer bargaining power.
| Metric | 2024 value |
|---|---|
| Global hyperscaler share | ~64% |
| Max retail speed | 1 Gbps |
| SLA uptime | 99.99%–99.999% (~52.6–5.26 min/yr) |
Preview the Actual Deliverable
TIME dotCom Porter's Five Forces Analysis
This preview shows the exact Porter’s Five Forces analysis for TIME dotCom that you’ll receive—fully written, professionally formatted, and ready for immediate use. The file displayed is the same complete document available for instant download after purchase, with no placeholders or samples. Buy now and gain immediate access to this final, actionable analysis.











