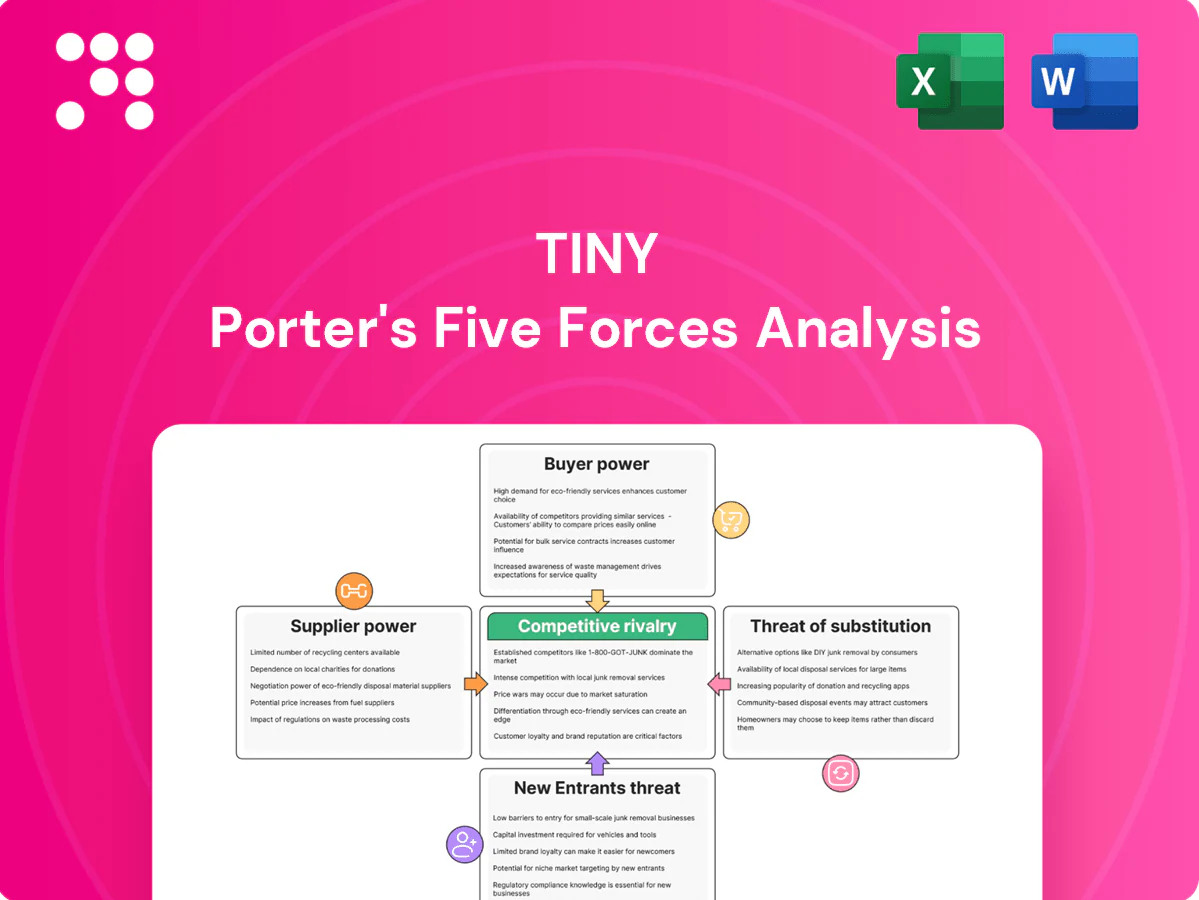
Tiny Porter's Five Forces Analysis

Don't Miss the Bigger Picture
Tiny's Porter's Five Forces snapshot highlights competitive intensity, buyer and supplier pressures, and substitute threats shaping its market. This brief overview identifies key vulnerabilities and potential advantages for strategic planning. The complete report reveals force-by-force ratings, visuals, and actionable implications. Unlock the full analysis to make data-driven decisions about Tiny's competitive position.
Suppliers Bargaining Power

Concentrated cloud and platform vendors
Portfolio companies depend on concentrated vendors—AWS (≈31%), Azure (≈23%) and Google Cloud (≈11%) per 2024 Synergy Research, plus Apple/Google app stores that levy 15–30% commission. That concentration gives vendors pricing power, policy change risk and margin take rates. Switching requires costly re‑architecture and downtime risk. Tiny mitigates by multi‑cloud strategies and negotiating enterprise terms.
Talent and specialized contractors
Skilled engineers, designers, and growth marketers command premium rates—US median software engineer base ~130,000 in 2024, product designers ~90,000 and growth marketers ~85,000—putting margin pressure across holdings. Tight labor markets (US unemployment ~3.7% in 2024) increase wage and retention costs. Remote hiring widens the talent pool but intensifies global competition for top talent. Building centralized in-house shared services reduces reliance on costly freelancers.

Customer acquisition channels
Google and Meta function as quasi-suppliers of demand, capturing roughly 60–65% of US digital ad spend in 2024, so bid inflation and algorithm shifts can spike CAC by 20–40% within months. Dependence varies by brand: strong content and SEO moats can lower paid CAC 30–70%. At portfolio scale (often >$100k/month), buyers gain better support, beta tools and volume discounts that mitigate supplier power.

Payment processors and marketplaces
Payment processors (Stripe, PayPal, Shopify Payments) and marketplaces impose fees (typical card rates ~2.9%+30¢; marketplaces 5–20%) and rules; policy shifts (chargebacks costing $25–$100 and reserve holds lasting 3–45 days) materially affect working capital. Multi-processor setups and direct billing reduce single-vendor exposure; volume aggregation can shave ~0.1–0.5% off rates and secure priority support.
- Fees: Stripe/PayPal ~2.9%+30¢; marketplaces 5–20%
- Chargebacks: $25–$100; reserve holds 3–45 days
- Mitigation: multi-processor + direct billing
- Negotiation: volume aggregation → ~0.1–0.5% lower rates / priority support
Data, compliance, and infra vendors
CDNs, analytics, security and compliance vendors become highly sticky once integrated, with surveys showing 70–80% of enterprises facing meaningful switching friction; price hikes or product sunsets often add migration costs. Standardized architectures (containers, IaC) improve portability, while long-term 3–5 year contracts commonly trade flexibility for c.5–15% price stability.
- stickiness: 70–80% reported switching friction
- contracts: 3–5 years
- discounts: ~5–15%
- portability: containers/IaC improve migration
Cloud, app-store fees and talent costs squeeze margins; multi-cloud and shared services as hedge
Concentrated vendors (AWS ≈31%, Azure ≈23%, GCP ≈11% in 2024) and app stores (15–30% commission) create pricing and policy risk. Skilled talent (US med. eng $130k, designer $90k, marketer $85k in 2024) and dominant ad platforms (Google+Meta 60–65% US spend) pressure margins. Tiny mitigates via multi-cloud, enterprise deals, shared services and multi-processor billing.
| Supplier | Metric | 2024 |
|---|---|---|
| Cloud | Share | AWS 31%/Azure 23%/GCP 11% |
| Ads | US spend | Google+Meta 60–65% |
| Payments | Card rate | ≈2.9%+30¢ |
| Labor | Median pay | Eng $130k/PD $90k/GM $85k |
What is included in the product
 Detailed Word Document
Tiny-specific Porter’s Five Forces analysis uncovering competitive intensity, buyer and supplier leverage, threat of substitutes and new entrants, and strategic vulnerabilities—supported by industry data, disruptive threats, and actionable insights to guide pricing, barrier creation, and defensive positioning.

 Customizable Excel Spreadsheet
A compact, one-sheet Five Forces tool that turns complex competitive analysis into instant, actionable insight—adjust pressure levels, swap in your data, and export clean spider charts for decks or dashboards without macros or heavy finance skills.
Customers Bargaining Power

Fragmented SMB and consumer base
Many portfolio businesses sell into highly fragmented SMB and consumer segments—99.9% of US firms are small businesses per SBA—limiting individual buyer power. Individual customers therefore have low leverage on price, though easy substitutes keep churn risk elevated (SaaS SMB median annual churn ~20% in 2023–24). Strong value differentiation and support can command 10–15% price premiums and reduce sensitivity.
Enterprise accounts in select products
Where contracts are larger, enterprise buyers typically secure deeper discounts and tighter SLAs—2024 SaaS benchmarks report median enterprise discounts near 20% and sales cycles extending to 6–12 months, which lengthen ramp and compress margins. Renewal negotiations and longer payment terms further squeeze margins, while land-and-expand models reduce initial concessions as expansion drives ARPU growth. Multi-year deals boost revenue stability but lock in pricing and limit upside during inflationary periods.

Low switching costs in SaaS niches
Low switching costs drive trial-and-switch: 2024 surveys report about 68% of buyers test multiple SaaS vendors before purchase, and transparent pricing enables easy comparison shopping. Data portability (GDPR-era rights) raises churn risk by removing technical lock-in. Conversely, rapid feature velocity and deep integrations — cited by 57% of buyers in 2024 as key retention factors — materially raise effective switching costs.

Price transparency in e-commerce
- Price transparency: 72% multi-site checks (2024)
- Margin pressure: rival promotions frequent
- Defenses: brand, community, unique SKUs
- Revenue levers: subscriptions/bundles → ~20% higher ARPU (2024)
Support and reliability expectations
Customers now treat fast support and 99.95–99.99% uptime SLAs as table stakes in 2024; outages quickly amplify buyer power through downgrades or cancellations, so proactive incident communication and clear SLAs preserve trust.
- 2024: 99.95–99.99% SLA expectations
- Outages → higher downgrade/cancellation risk
- Proactive comms + SLAs = retained customers
- Shared SRE practices reduce MTTR across portfolio
Defend growth: cut SaaS SMB churn, boost ARPU via subscriptions and high-availability SLAs
Customer bargaining is low in fragmented SMB/consumer segments (99.9% of US firms are small businesses) but churn is elevated (SaaS SMB median annual churn ~20% in 2023–24). Enterprise buyers extract ~20% discounts and longer sales cycles, compressing margins, while 68% of buyers test multiple vendors and 72% perform multi-site price checks (2024). Defenses: brand, integrations, subscriptions (+~20% ARPU) and 99.95–99.99% SLAs raise effective switching costs.
| Metric | 2024 Value |
|---|---|
| SMB share (US) | 99.9% |
| SaaS SMB churn | ~20% |
| Enterprise discount | ~20% |
| Multi-vendor testing | 68% |
| Multi-site checks | 72% |
| Subscription ARPU lift | ~20% |
| SLA expectation | 99.95–99.99% |
Preview the Actual Deliverable
Tiny Porter's Five Forces Analysis
This preview shows the exact Tiny Porter's Five Forces Analysis you'll receive immediately after purchase—no placeholders or mockups. The document displayed here is fully formatted and ready for download the moment you buy, containing the same professionally written content you see. No surprises: what you preview is what you get.

Don't Miss the Bigger Picture
Tiny's Porter's Five Forces snapshot highlights competitive intensity, buyer and supplier pressures, and substitute threats shaping its market. This brief overview identifies key vulnerabilities and potential advantages for strategic planning. The complete report reveals force-by-force ratings, visuals, and actionable implications. Unlock the full analysis to make data-driven decisions about Tiny's competitive position.
Suppliers Bargaining Power
Concentrated cloud and platform vendors
Portfolio companies depend on concentrated vendors—AWS (≈31%), Azure (≈23%) and Google Cloud (≈11%) per 2024 Synergy Research, plus Apple/Google app stores that levy 15–30% commission. That concentration gives vendors pricing power, policy change risk and margin take rates. Switching requires costly re‑architecture and downtime risk. Tiny mitigates by multi‑cloud strategies and negotiating enterprise terms.
Talent and specialized contractors
Skilled engineers, designers, and growth marketers command premium rates—US median software engineer base ~130,000 in 2024, product designers ~90,000 and growth marketers ~85,000—putting margin pressure across holdings. Tight labor markets (US unemployment ~3.7% in 2024) increase wage and retention costs. Remote hiring widens the talent pool but intensifies global competition for top talent. Building centralized in-house shared services reduces reliance on costly freelancers.
Customer acquisition channels
Google and Meta function as quasi-suppliers of demand, capturing roughly 60–65% of US digital ad spend in 2024, so bid inflation and algorithm shifts can spike CAC by 20–40% within months. Dependence varies by brand: strong content and SEO moats can lower paid CAC 30–70%. At portfolio scale (often >$100k/month), buyers gain better support, beta tools and volume discounts that mitigate supplier power.
Payment processors and marketplaces
Payment processors (Stripe, PayPal, Shopify Payments) and marketplaces impose fees (typical card rates ~2.9%+30¢; marketplaces 5–20%) and rules; policy shifts (chargebacks costing $25–$100 and reserve holds lasting 3–45 days) materially affect working capital. Multi-processor setups and direct billing reduce single-vendor exposure; volume aggregation can shave ~0.1–0.5% off rates and secure priority support.
- Fees: Stripe/PayPal ~2.9%+30¢; marketplaces 5–20%
- Chargebacks: $25–$100; reserve holds 3–45 days
- Mitigation: multi-processor + direct billing
- Negotiation: volume aggregation → ~0.1–0.5% lower rates / priority support
Data, compliance, and infra vendors
CDNs, analytics, security and compliance vendors become highly sticky once integrated, with surveys showing 70–80% of enterprises facing meaningful switching friction; price hikes or product sunsets often add migration costs. Standardized architectures (containers, IaC) improve portability, while long-term 3–5 year contracts commonly trade flexibility for c.5–15% price stability.
- stickiness: 70–80% reported switching friction
- contracts: 3–5 years
- discounts: ~5–15%
- portability: containers/IaC improve migration
Cloud, app-store fees and talent costs squeeze margins; multi-cloud and shared services as hedge
Concentrated vendors (AWS ≈31%, Azure ≈23%, GCP ≈11% in 2024) and app stores (15–30% commission) create pricing and policy risk. Skilled talent (US med. eng $130k, designer $90k, marketer $85k in 2024) and dominant ad platforms (Google+Meta 60–65% US spend) pressure margins. Tiny mitigates via multi-cloud, enterprise deals, shared services and multi-processor billing.
| Supplier | Metric | 2024 |
|---|---|---|
| Cloud | Share | AWS 31%/Azure 23%/GCP 11% |
| Ads | US spend | Google+Meta 60–65% |
| Payments | Card rate | ≈2.9%+30¢ |
| Labor | Median pay | Eng $130k/PD $90k/GM $85k |
What is included in the product
Detailed Word Document
Tiny-specific Porter’s Five Forces analysis uncovering competitive intensity, buyer and supplier leverage, threat of substitutes and new entrants, and strategic vulnerabilities—supported by industry data, disruptive threats, and actionable insights to guide pricing, barrier creation, and defensive positioning.
Customizable Excel Spreadsheet
A compact, one-sheet Five Forces tool that turns complex competitive analysis into instant, actionable insight—adjust pressure levels, swap in your data, and export clean spider charts for decks or dashboards without macros or heavy finance skills.
Customers Bargaining Power
Fragmented SMB and consumer base
Many portfolio businesses sell into highly fragmented SMB and consumer segments—99.9% of US firms are small businesses per SBA—limiting individual buyer power. Individual customers therefore have low leverage on price, though easy substitutes keep churn risk elevated (SaaS SMB median annual churn ~20% in 2023–24). Strong value differentiation and support can command 10–15% price premiums and reduce sensitivity.
Enterprise accounts in select products
Where contracts are larger, enterprise buyers typically secure deeper discounts and tighter SLAs—2024 SaaS benchmarks report median enterprise discounts near 20% and sales cycles extending to 6–12 months, which lengthen ramp and compress margins. Renewal negotiations and longer payment terms further squeeze margins, while land-and-expand models reduce initial concessions as expansion drives ARPU growth. Multi-year deals boost revenue stability but lock in pricing and limit upside during inflationary periods.
Low switching costs in SaaS niches
Low switching costs drive trial-and-switch: 2024 surveys report about 68% of buyers test multiple SaaS vendors before purchase, and transparent pricing enables easy comparison shopping. Data portability (GDPR-era rights) raises churn risk by removing technical lock-in. Conversely, rapid feature velocity and deep integrations — cited by 57% of buyers in 2024 as key retention factors — materially raise effective switching costs.
Price transparency in e-commerce
- Price transparency: 72% multi-site checks (2024)
- Margin pressure: rival promotions frequent
- Defenses: brand, community, unique SKUs
- Revenue levers: subscriptions/bundles → ~20% higher ARPU (2024)
Support and reliability expectations
Customers now treat fast support and 99.95–99.99% uptime SLAs as table stakes in 2024; outages quickly amplify buyer power through downgrades or cancellations, so proactive incident communication and clear SLAs preserve trust.
- 2024: 99.95–99.99% SLA expectations
- Outages → higher downgrade/cancellation risk
- Proactive comms + SLAs = retained customers
- Shared SRE practices reduce MTTR across portfolio
Defend growth: cut SaaS SMB churn, boost ARPU via subscriptions and high-availability SLAs
Customer bargaining is low in fragmented SMB/consumer segments (99.9% of US firms are small businesses) but churn is elevated (SaaS SMB median annual churn ~20% in 2023–24). Enterprise buyers extract ~20% discounts and longer sales cycles, compressing margins, while 68% of buyers test multiple vendors and 72% perform multi-site price checks (2024). Defenses: brand, integrations, subscriptions (+~20% ARPU) and 99.95–99.99% SLAs raise effective switching costs.
| Metric | 2024 Value |
|---|---|
| SMB share (US) | 99.9% |
| SaaS SMB churn | ~20% |
| Enterprise discount | ~20% |
| Multi-vendor testing | 68% |
| Multi-site checks | 72% |
| Subscription ARPU lift | ~20% |
| SLA expectation | 99.95–99.99% |
Preview the Actual Deliverable
Tiny Porter's Five Forces Analysis
This preview shows the exact Tiny Porter's Five Forces Analysis you'll receive immediately after purchase—no placeholders or mockups. The document displayed here is fully formatted and ready for download the moment you buy, containing the same professionally written content you see. No surprises: what you preview is what you get.
Original: $10.00
-65%$10.00
$3.50Description
Don't Miss the Bigger Picture
Tiny's Porter's Five Forces snapshot highlights competitive intensity, buyer and supplier pressures, and substitute threats shaping its market. This brief overview identifies key vulnerabilities and potential advantages for strategic planning. The complete report reveals force-by-force ratings, visuals, and actionable implications. Unlock the full analysis to make data-driven decisions about Tiny's competitive position.
Suppliers Bargaining Power
Concentrated cloud and platform vendors
Portfolio companies depend on concentrated vendors—AWS (≈31%), Azure (≈23%) and Google Cloud (≈11%) per 2024 Synergy Research, plus Apple/Google app stores that levy 15–30% commission. That concentration gives vendors pricing power, policy change risk and margin take rates. Switching requires costly re‑architecture and downtime risk. Tiny mitigates by multi‑cloud strategies and negotiating enterprise terms.
Talent and specialized contractors
Skilled engineers, designers, and growth marketers command premium rates—US median software engineer base ~130,000 in 2024, product designers ~90,000 and growth marketers ~85,000—putting margin pressure across holdings. Tight labor markets (US unemployment ~3.7% in 2024) increase wage and retention costs. Remote hiring widens the talent pool but intensifies global competition for top talent. Building centralized in-house shared services reduces reliance on costly freelancers.
Customer acquisition channels
Google and Meta function as quasi-suppliers of demand, capturing roughly 60–65% of US digital ad spend in 2024, so bid inflation and algorithm shifts can spike CAC by 20–40% within months. Dependence varies by brand: strong content and SEO moats can lower paid CAC 30–70%. At portfolio scale (often >$100k/month), buyers gain better support, beta tools and volume discounts that mitigate supplier power.
Payment processors and marketplaces
Payment processors (Stripe, PayPal, Shopify Payments) and marketplaces impose fees (typical card rates ~2.9%+30¢; marketplaces 5–20%) and rules; policy shifts (chargebacks costing $25–$100 and reserve holds lasting 3–45 days) materially affect working capital. Multi-processor setups and direct billing reduce single-vendor exposure; volume aggregation can shave ~0.1–0.5% off rates and secure priority support.
- Fees: Stripe/PayPal ~2.9%+30¢; marketplaces 5–20%
- Chargebacks: $25–$100; reserve holds 3–45 days
- Mitigation: multi-processor + direct billing
- Negotiation: volume aggregation → ~0.1–0.5% lower rates / priority support
Data, compliance, and infra vendors
CDNs, analytics, security and compliance vendors become highly sticky once integrated, with surveys showing 70–80% of enterprises facing meaningful switching friction; price hikes or product sunsets often add migration costs. Standardized architectures (containers, IaC) improve portability, while long-term 3–5 year contracts commonly trade flexibility for c.5–15% price stability.
- stickiness: 70–80% reported switching friction
- contracts: 3–5 years
- discounts: ~5–15%
- portability: containers/IaC improve migration
Cloud, app-store fees and talent costs squeeze margins; multi-cloud and shared services as hedge
Concentrated vendors (AWS ≈31%, Azure ≈23%, GCP ≈11% in 2024) and app stores (15–30% commission) create pricing and policy risk. Skilled talent (US med. eng $130k, designer $90k, marketer $85k in 2024) and dominant ad platforms (Google+Meta 60–65% US spend) pressure margins. Tiny mitigates via multi-cloud, enterprise deals, shared services and multi-processor billing.
| Supplier | Metric | 2024 |
|---|---|---|
| Cloud | Share | AWS 31%/Azure 23%/GCP 11% |
| Ads | US spend | Google+Meta 60–65% |
| Payments | Card rate | ≈2.9%+30¢ |
| Labor | Median pay | Eng $130k/PD $90k/GM $85k |
What is included in the product
Detailed Word Document
Tiny-specific Porter’s Five Forces analysis uncovering competitive intensity, buyer and supplier leverage, threat of substitutes and new entrants, and strategic vulnerabilities—supported by industry data, disruptive threats, and actionable insights to guide pricing, barrier creation, and defensive positioning.
Customizable Excel Spreadsheet
A compact, one-sheet Five Forces tool that turns complex competitive analysis into instant, actionable insight—adjust pressure levels, swap in your data, and export clean spider charts for decks or dashboards without macros or heavy finance skills.
Customers Bargaining Power
Fragmented SMB and consumer base
Many portfolio businesses sell into highly fragmented SMB and consumer segments—99.9% of US firms are small businesses per SBA—limiting individual buyer power. Individual customers therefore have low leverage on price, though easy substitutes keep churn risk elevated (SaaS SMB median annual churn ~20% in 2023–24). Strong value differentiation and support can command 10–15% price premiums and reduce sensitivity.
Enterprise accounts in select products
Where contracts are larger, enterprise buyers typically secure deeper discounts and tighter SLAs—2024 SaaS benchmarks report median enterprise discounts near 20% and sales cycles extending to 6–12 months, which lengthen ramp and compress margins. Renewal negotiations and longer payment terms further squeeze margins, while land-and-expand models reduce initial concessions as expansion drives ARPU growth. Multi-year deals boost revenue stability but lock in pricing and limit upside during inflationary periods.
Low switching costs in SaaS niches
Low switching costs drive trial-and-switch: 2024 surveys report about 68% of buyers test multiple SaaS vendors before purchase, and transparent pricing enables easy comparison shopping. Data portability (GDPR-era rights) raises churn risk by removing technical lock-in. Conversely, rapid feature velocity and deep integrations — cited by 57% of buyers in 2024 as key retention factors — materially raise effective switching costs.
Price transparency in e-commerce
- Price transparency: 72% multi-site checks (2024)
- Margin pressure: rival promotions frequent
- Defenses: brand, community, unique SKUs
- Revenue levers: subscriptions/bundles → ~20% higher ARPU (2024)
Support and reliability expectations
Customers now treat fast support and 99.95–99.99% uptime SLAs as table stakes in 2024; outages quickly amplify buyer power through downgrades or cancellations, so proactive incident communication and clear SLAs preserve trust.
- 2024: 99.95–99.99% SLA expectations
- Outages → higher downgrade/cancellation risk
- Proactive comms + SLAs = retained customers
- Shared SRE practices reduce MTTR across portfolio
Defend growth: cut SaaS SMB churn, boost ARPU via subscriptions and high-availability SLAs
Customer bargaining is low in fragmented SMB/consumer segments (99.9% of US firms are small businesses) but churn is elevated (SaaS SMB median annual churn ~20% in 2023–24). Enterprise buyers extract ~20% discounts and longer sales cycles, compressing margins, while 68% of buyers test multiple vendors and 72% perform multi-site price checks (2024). Defenses: brand, integrations, subscriptions (+~20% ARPU) and 99.95–99.99% SLAs raise effective switching costs.
| Metric | 2024 Value |
|---|---|
| SMB share (US) | 99.9% |
| SaaS SMB churn | ~20% |
| Enterprise discount | ~20% |
| Multi-vendor testing | 68% |
| Multi-site checks | 72% |
| Subscription ARPU lift | ~20% |
| SLA expectation | 99.95–99.99% |
Preview the Actual Deliverable
Tiny Porter's Five Forces Analysis
This preview shows the exact Tiny Porter's Five Forces Analysis you'll receive immediately after purchase—no placeholders or mockups. The document displayed here is fully formatted and ready for download the moment you buy, containing the same professionally written content you see. No surprises: what you preview is what you get.











