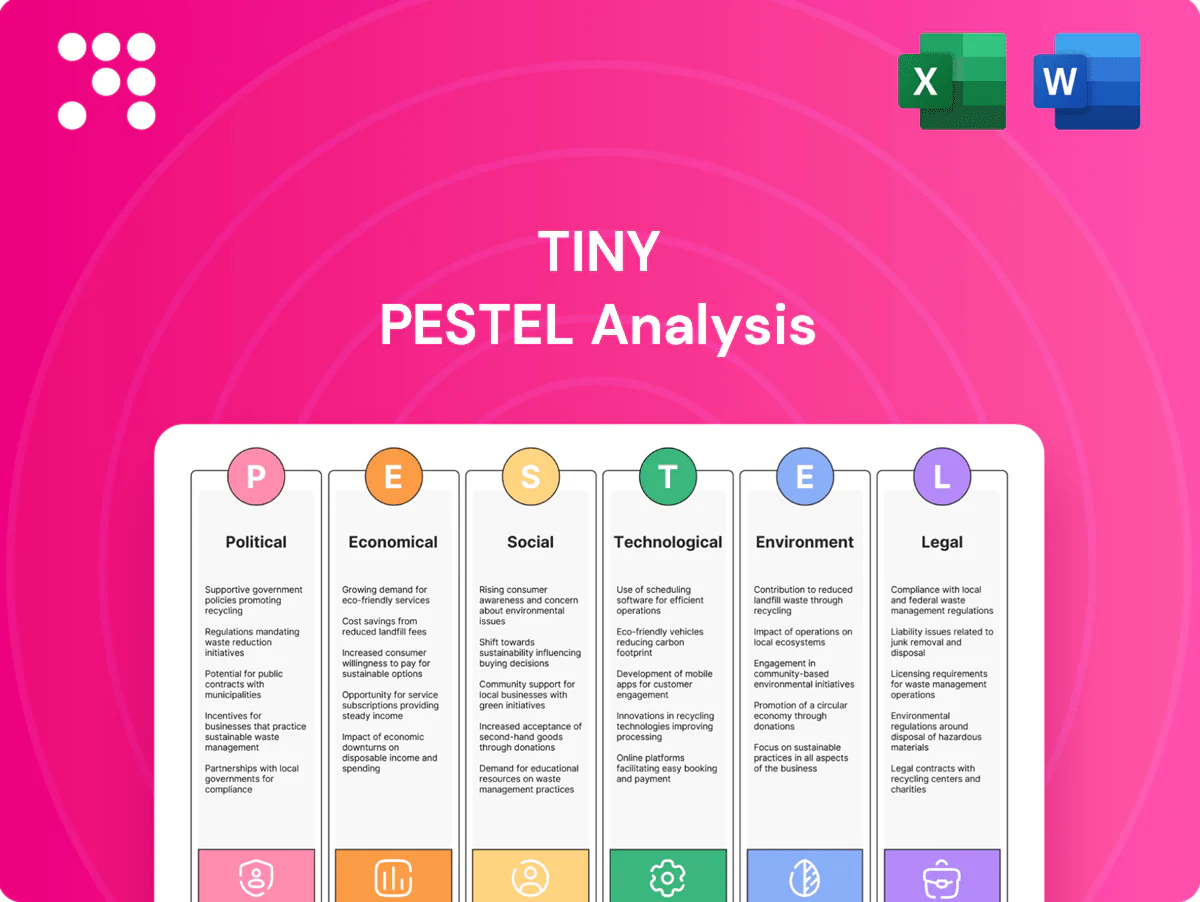
Tiny PESTLE Analysis

Skip the Research. Get the Strategy.
Gain a strategic edge with our Tiny PESTLE Analysis—concise yet powerful insights into political, economic, social, technological, legal and environmental forces shaping Tiny's future. Ideal for investors and strategists, it saves research time and supports decision-making. Purchase the full report for the complete, ready-to-use breakdown.
Political factors

Cross-border regulatory stability
Acquisitions and operations across jurisdictions expose Tiny to shifting policies and political stability risks, with UNCTAD reporting global FDI around $1.3tn in 2023, highlighting deal volatility. Changes in foreign investment rules or capital controls can slow timelines and raise transaction costs, as screening regimes expanded post-2020. Monitoring country risk and keeping optional corporate structures preserves agility, while regional diversification reduces single-country shock exposure.
Digital taxation and platform policies
Global moves like the OECD Inclusive Framework (136 jurisdictions agreeing a 15% minimum tax) and unilateral digital services levies compress portfolio margins, while platform governance—app store fees typically 15–30% and shifting ad policies—can change unit economics rapidly. Active tax planning and platform relationship management are strategic safeguards, and scenario models should price in policy-driven take-rate shifts of ±5 percentage points.

Government incentives for tech and SMEs
Subsidies, R&D tax credits and export grants can materially lift returns for software and digital services; for example the European Innovation Council budget is about €10.1bn (2021–2027) and the US CHIPS and Science Act totals roughly $280bn for tech-related investment.

Geopolitics and supply chain digitization
Geopolitical fragmentation alters cross-border data flows, forces cloud localization and narrows vendor choice; over 130 countries had data protection or localization rules by 2024, raising compliance costs and latency risks.
Sanctions and trade restrictions (UN, US, EU regimes) can cut off service providers or customer cohorts, interrupting revenue and operations.
Building compliant alternative stacks and including contract clauses for sudden service discontinuities reduces exposure to geopolitical bottlenecks.
- fragmentation: >130 countries with data laws (2024)
- risk: sanctions can sever vendors/customers
- mitigation: alternative stacks + contractual continuity
Public procurement and civic tech exposure
Public procurement exposure matters: public procurement is about 14% of EU GDP and 10–15% globally (World Bank), so civic-tech vendors can face demand swings tied to election cycles and policy pivots. Budget freezes or policy shifts often pause projects for months, compressing near‑term sales windows. Compliance with procurement rules increases win rates and long‑term retention.
- Balance pipelines: diversify toward private sector
- Risk: election/policy-driven pauses
- Stat: public procurement ≈14% EU GDP; 10–15% global
- Mitigation: strict procurement compliance
Cross-border deals: policy volatility, tax & data rules squeeze margins—diversify and monitor risk
Cross-border deals face policy volatility (global FDI ~$1.3tn in 2023) and expanded investment screening; monitor country risk and use optional structures. Tax and platform rules (OECD 15% minimum, 136 jurisdictions) and >130 data-localization laws (2024) compress margins and raise compliance costs. Public procurement (≈14% EU GDP) and sanctions can abruptly halt revenues; diversify and build alternative stacks.
| Metric | 2023–2024 |
|---|---|
| Global FDI | $1.3tn (2023) |
| OECD min tax | 15% (136 juris.) |
| Data laws | >130 countries (2024) |
| EU procurement | ≈14% GDP |
What is included in the product
 Detailed Word Document
Explores how macro-environmental forces shape Tiny across six dimensions—Political, Economic, Social, Technological, Environmental, and Legal—backed by current data and trends to surface actionable threats and opportunities. Designed for executives and investors, it provides region- and industry-specific examples, forward-looking insights for scenario planning, and clean formatting ready for business plans or pitch decks.

 Customizable Excel Spreadsheet
Tiny PESTLE condenses full external-analysis insights into a bite-sized, visually segmented summary that’s easy to drop into presentations, share across teams, and use in quick planning sessions to speed alignment and reduce prep time.
Economic factors

Interest rates and cost of capital
As a serial acquirer, Tiny’s valuation thresholds closely track funding costs: as of June–July 2025 the US federal funds rate hovered around 5.25–5.50% and the 10-year Treasury near 4.3–4.5%, compressing deal IRRs and favoring higher-margin, cash-generative targets. Creative structures such as earnouts and seller financing can preserve returns, while active liability management and interest-rate hedging protect predictable cash flows.
Macro cycles and SMB software demand
Downturns compress discretionary SaaS and e-commerce budgets, raising churn risk as buyers reallocate spend; public/private SaaS multiples compressed into mid-single-digit EV/NTM revenue in 2023–24. Mission-critical, workflow-embedded tools typically sustain NDR above 100% and lower churn. Pricing, packaging and upsell must mirror segment elasticity. Counter-cyclical M&A can buy growth at lower multiples.

Currency volatility in global revenues
Revenues and costs across currencies create translation and transaction risks; a 10% USD appreciation typically reduces reported foreign-currency revenues by roughly 3–7% depending on regional mix, and many multinationals experienced 5–8% FX-driven swings in 2024–25. USD strength can depress foreign earnings while USD weakness inflates imported costs. Natural hedges—matching costs to revenue regions—cut exposure, and policy-driven FX hedging should be calibrated to cash-flow visibility and tenor.

Labor markets and talent costs
Tech labor scarcity drives wage inflation and retention pain—CompTIA and industry surveys showed IT pay rising near 6% in 2024 while BLS projects 15% growth in computer occupations through 2031; distributed hiring expands the talent pool but increases multi-jurisdiction compliance and payroll complexity; portfolio-wide shared services can centralize recruiting and comp; automation and AI cut support and ops costs.
- Wage inflation: ~6% Y/Y (2024)
- Demand: BLS +15% (2021–2031)
- Levers: shared services, distributed hiring, AI automation
E-commerce logistics and consumer spending
Consumer confidence and freight costs materially drive D2C performance; carrier rate swings and returns processing erode contribution margins. Diversifying channels and optimizing fulfillment (cheaper mix, regional nodes) stabilizes unit economics. Inventory-light and subscription models reduce revenue and margin volatility—returns average ~18% online; apparel >30%; subscription segments grew ~12% in 2024.
- Consumer confidence impacts demand; returns ~18% (online)
- Carrier rate volatility and returns cut margins
- Channel diversification + fulfillment optimization stabilize units
- Inventory-light/subscription models (≈12% growth in 2024) reduce volatility
Cross-border deals: policy volatility, tax & data rules squeeze margins—diversify and monitor risk
Higher rates (FF 5.25–5.50%, 10y ~4.3–4.5% mid‑2025) compress IRRs and favor cash‑generative targets; creative deal structures and hedging preserve returns. SaaS multiples retrenched to mid‑single‑digit EV/NTM (2023–24); mission‑critical tools keep NDR>100%. USD moves drove ~5–8% FY swings (2024–25); wage inflation ~6% (2024) pressures margins; online returns ~18%.
| Metric | Value |
|---|---|
| Fed funds (Jun–Jul 2025) | 5.25–5.50% |
| 10‑yr Treasury | ~4.3–4.5% |
| Wage inflation (2024) | ~6% |
| Online returns | ~18% |
| Subscription growth (2024) | ~12% |
Same Document Delivered
Tiny PESTLE Analysis
The preview shown here is the exact Tiny PESTLE Analysis document you’ll receive after purchase—fully formatted and ready to use. No placeholders or teasers; the layout, content, and structure are identical to the downloadable file. After payment you’ll instantly get this final, professionally structured file.

Skip the Research. Get the Strategy.
Gain a strategic edge with our Tiny PESTLE Analysis—concise yet powerful insights into political, economic, social, technological, legal and environmental forces shaping Tiny's future. Ideal for investors and strategists, it saves research time and supports decision-making. Purchase the full report for the complete, ready-to-use breakdown.
Political factors
Cross-border regulatory stability
Acquisitions and operations across jurisdictions expose Tiny to shifting policies and political stability risks, with UNCTAD reporting global FDI around $1.3tn in 2023, highlighting deal volatility. Changes in foreign investment rules or capital controls can slow timelines and raise transaction costs, as screening regimes expanded post-2020. Monitoring country risk and keeping optional corporate structures preserves agility, while regional diversification reduces single-country shock exposure.
Digital taxation and platform policies
Global moves like the OECD Inclusive Framework (136 jurisdictions agreeing a 15% minimum tax) and unilateral digital services levies compress portfolio margins, while platform governance—app store fees typically 15–30% and shifting ad policies—can change unit economics rapidly. Active tax planning and platform relationship management are strategic safeguards, and scenario models should price in policy-driven take-rate shifts of ±5 percentage points.
Government incentives for tech and SMEs
Subsidies, R&D tax credits and export grants can materially lift returns for software and digital services; for example the European Innovation Council budget is about €10.1bn (2021–2027) and the US CHIPS and Science Act totals roughly $280bn for tech-related investment.
Geopolitics and supply chain digitization
Geopolitical fragmentation alters cross-border data flows, forces cloud localization and narrows vendor choice; over 130 countries had data protection or localization rules by 2024, raising compliance costs and latency risks.
Sanctions and trade restrictions (UN, US, EU regimes) can cut off service providers or customer cohorts, interrupting revenue and operations.
Building compliant alternative stacks and including contract clauses for sudden service discontinuities reduces exposure to geopolitical bottlenecks.
- fragmentation: >130 countries with data laws (2024)
- risk: sanctions can sever vendors/customers
- mitigation: alternative stacks + contractual continuity
Public procurement and civic tech exposure
Public procurement exposure matters: public procurement is about 14% of EU GDP and 10–15% globally (World Bank), so civic-tech vendors can face demand swings tied to election cycles and policy pivots. Budget freezes or policy shifts often pause projects for months, compressing near‑term sales windows. Compliance with procurement rules increases win rates and long‑term retention.
- Balance pipelines: diversify toward private sector
- Risk: election/policy-driven pauses
- Stat: public procurement ≈14% EU GDP; 10–15% global
- Mitigation: strict procurement compliance
Cross-border deals: policy volatility, tax & data rules squeeze margins—diversify and monitor risk
Cross-border deals face policy volatility (global FDI ~$1.3tn in 2023) and expanded investment screening; monitor country risk and use optional structures. Tax and platform rules (OECD 15% minimum, 136 jurisdictions) and >130 data-localization laws (2024) compress margins and raise compliance costs. Public procurement (≈14% EU GDP) and sanctions can abruptly halt revenues; diversify and build alternative stacks.
| Metric | 2023–2024 |
|---|---|
| Global FDI | $1.3tn (2023) |
| OECD min tax | 15% (136 juris.) |
| Data laws | >130 countries (2024) |
| EU procurement | ≈14% GDP |
What is included in the product
Detailed Word Document
Explores how macro-environmental forces shape Tiny across six dimensions—Political, Economic, Social, Technological, Environmental, and Legal—backed by current data and trends to surface actionable threats and opportunities. Designed for executives and investors, it provides region- and industry-specific examples, forward-looking insights for scenario planning, and clean formatting ready for business plans or pitch decks.
Customizable Excel Spreadsheet
Tiny PESTLE condenses full external-analysis insights into a bite-sized, visually segmented summary that’s easy to drop into presentations, share across teams, and use in quick planning sessions to speed alignment and reduce prep time.
Economic factors
Interest rates and cost of capital
As a serial acquirer, Tiny’s valuation thresholds closely track funding costs: as of June–July 2025 the US federal funds rate hovered around 5.25–5.50% and the 10-year Treasury near 4.3–4.5%, compressing deal IRRs and favoring higher-margin, cash-generative targets. Creative structures such as earnouts and seller financing can preserve returns, while active liability management and interest-rate hedging protect predictable cash flows.
Macro cycles and SMB software demand
Downturns compress discretionary SaaS and e-commerce budgets, raising churn risk as buyers reallocate spend; public/private SaaS multiples compressed into mid-single-digit EV/NTM revenue in 2023–24. Mission-critical, workflow-embedded tools typically sustain NDR above 100% and lower churn. Pricing, packaging and upsell must mirror segment elasticity. Counter-cyclical M&A can buy growth at lower multiples.
Currency volatility in global revenues
Revenues and costs across currencies create translation and transaction risks; a 10% USD appreciation typically reduces reported foreign-currency revenues by roughly 3–7% depending on regional mix, and many multinationals experienced 5–8% FX-driven swings in 2024–25. USD strength can depress foreign earnings while USD weakness inflates imported costs. Natural hedges—matching costs to revenue regions—cut exposure, and policy-driven FX hedging should be calibrated to cash-flow visibility and tenor.
Labor markets and talent costs
Tech labor scarcity drives wage inflation and retention pain—CompTIA and industry surveys showed IT pay rising near 6% in 2024 while BLS projects 15% growth in computer occupations through 2031; distributed hiring expands the talent pool but increases multi-jurisdiction compliance and payroll complexity; portfolio-wide shared services can centralize recruiting and comp; automation and AI cut support and ops costs.
- Wage inflation: ~6% Y/Y (2024)
- Demand: BLS +15% (2021–2031)
- Levers: shared services, distributed hiring, AI automation
E-commerce logistics and consumer spending
Consumer confidence and freight costs materially drive D2C performance; carrier rate swings and returns processing erode contribution margins. Diversifying channels and optimizing fulfillment (cheaper mix, regional nodes) stabilizes unit economics. Inventory-light and subscription models reduce revenue and margin volatility—returns average ~18% online; apparel >30%; subscription segments grew ~12% in 2024.
- Consumer confidence impacts demand; returns ~18% (online)
- Carrier rate volatility and returns cut margins
- Channel diversification + fulfillment optimization stabilize units
- Inventory-light/subscription models (≈12% growth in 2024) reduce volatility
Cross-border deals: policy volatility, tax & data rules squeeze margins—diversify and monitor risk
Higher rates (FF 5.25–5.50%, 10y ~4.3–4.5% mid‑2025) compress IRRs and favor cash‑generative targets; creative deal structures and hedging preserve returns. SaaS multiples retrenched to mid‑single‑digit EV/NTM (2023–24); mission‑critical tools keep NDR>100%. USD moves drove ~5–8% FY swings (2024–25); wage inflation ~6% (2024) pressures margins; online returns ~18%.
| Metric | Value |
|---|---|
| Fed funds (Jun–Jul 2025) | 5.25–5.50% |
| 10‑yr Treasury | ~4.3–4.5% |
| Wage inflation (2024) | ~6% |
| Online returns | ~18% |
| Subscription growth (2024) | ~12% |
Same Document Delivered
Tiny PESTLE Analysis
The preview shown here is the exact Tiny PESTLE Analysis document you’ll receive after purchase—fully formatted and ready to use. No placeholders or teasers; the layout, content, and structure are identical to the downloadable file. After payment you’ll instantly get this final, professionally structured file.
Original: $10.00
-65%$10.00
$3.50Description
Skip the Research. Get the Strategy.
Gain a strategic edge with our Tiny PESTLE Analysis—concise yet powerful insights into political, economic, social, technological, legal and environmental forces shaping Tiny's future. Ideal for investors and strategists, it saves research time and supports decision-making. Purchase the full report for the complete, ready-to-use breakdown.
Political factors
Cross-border regulatory stability
Acquisitions and operations across jurisdictions expose Tiny to shifting policies and political stability risks, with UNCTAD reporting global FDI around $1.3tn in 2023, highlighting deal volatility. Changes in foreign investment rules or capital controls can slow timelines and raise transaction costs, as screening regimes expanded post-2020. Monitoring country risk and keeping optional corporate structures preserves agility, while regional diversification reduces single-country shock exposure.
Digital taxation and platform policies
Global moves like the OECD Inclusive Framework (136 jurisdictions agreeing a 15% minimum tax) and unilateral digital services levies compress portfolio margins, while platform governance—app store fees typically 15–30% and shifting ad policies—can change unit economics rapidly. Active tax planning and platform relationship management are strategic safeguards, and scenario models should price in policy-driven take-rate shifts of ±5 percentage points.
Government incentives for tech and SMEs
Subsidies, R&D tax credits and export grants can materially lift returns for software and digital services; for example the European Innovation Council budget is about €10.1bn (2021–2027) and the US CHIPS and Science Act totals roughly $280bn for tech-related investment.
Geopolitics and supply chain digitization
Geopolitical fragmentation alters cross-border data flows, forces cloud localization and narrows vendor choice; over 130 countries had data protection or localization rules by 2024, raising compliance costs and latency risks.
Sanctions and trade restrictions (UN, US, EU regimes) can cut off service providers or customer cohorts, interrupting revenue and operations.
Building compliant alternative stacks and including contract clauses for sudden service discontinuities reduces exposure to geopolitical bottlenecks.
- fragmentation: >130 countries with data laws (2024)
- risk: sanctions can sever vendors/customers
- mitigation: alternative stacks + contractual continuity
Public procurement and civic tech exposure
Public procurement exposure matters: public procurement is about 14% of EU GDP and 10–15% globally (World Bank), so civic-tech vendors can face demand swings tied to election cycles and policy pivots. Budget freezes or policy shifts often pause projects for months, compressing near‑term sales windows. Compliance with procurement rules increases win rates and long‑term retention.
- Balance pipelines: diversify toward private sector
- Risk: election/policy-driven pauses
- Stat: public procurement ≈14% EU GDP; 10–15% global
- Mitigation: strict procurement compliance
Cross-border deals: policy volatility, tax & data rules squeeze margins—diversify and monitor risk
Cross-border deals face policy volatility (global FDI ~$1.3tn in 2023) and expanded investment screening; monitor country risk and use optional structures. Tax and platform rules (OECD 15% minimum, 136 jurisdictions) and >130 data-localization laws (2024) compress margins and raise compliance costs. Public procurement (≈14% EU GDP) and sanctions can abruptly halt revenues; diversify and build alternative stacks.
| Metric | 2023–2024 |
|---|---|
| Global FDI | $1.3tn (2023) |
| OECD min tax | 15% (136 juris.) |
| Data laws | >130 countries (2024) |
| EU procurement | ≈14% GDP |
What is included in the product
Detailed Word Document
Explores how macro-environmental forces shape Tiny across six dimensions—Political, Economic, Social, Technological, Environmental, and Legal—backed by current data and trends to surface actionable threats and opportunities. Designed for executives and investors, it provides region- and industry-specific examples, forward-looking insights for scenario planning, and clean formatting ready for business plans or pitch decks.
Customizable Excel Spreadsheet
Tiny PESTLE condenses full external-analysis insights into a bite-sized, visually segmented summary that’s easy to drop into presentations, share across teams, and use in quick planning sessions to speed alignment and reduce prep time.
Economic factors
Interest rates and cost of capital
As a serial acquirer, Tiny’s valuation thresholds closely track funding costs: as of June–July 2025 the US federal funds rate hovered around 5.25–5.50% and the 10-year Treasury near 4.3–4.5%, compressing deal IRRs and favoring higher-margin, cash-generative targets. Creative structures such as earnouts and seller financing can preserve returns, while active liability management and interest-rate hedging protect predictable cash flows.
Macro cycles and SMB software demand
Downturns compress discretionary SaaS and e-commerce budgets, raising churn risk as buyers reallocate spend; public/private SaaS multiples compressed into mid-single-digit EV/NTM revenue in 2023–24. Mission-critical, workflow-embedded tools typically sustain NDR above 100% and lower churn. Pricing, packaging and upsell must mirror segment elasticity. Counter-cyclical M&A can buy growth at lower multiples.
Currency volatility in global revenues
Revenues and costs across currencies create translation and transaction risks; a 10% USD appreciation typically reduces reported foreign-currency revenues by roughly 3–7% depending on regional mix, and many multinationals experienced 5–8% FX-driven swings in 2024–25. USD strength can depress foreign earnings while USD weakness inflates imported costs. Natural hedges—matching costs to revenue regions—cut exposure, and policy-driven FX hedging should be calibrated to cash-flow visibility and tenor.
Labor markets and talent costs
Tech labor scarcity drives wage inflation and retention pain—CompTIA and industry surveys showed IT pay rising near 6% in 2024 while BLS projects 15% growth in computer occupations through 2031; distributed hiring expands the talent pool but increases multi-jurisdiction compliance and payroll complexity; portfolio-wide shared services can centralize recruiting and comp; automation and AI cut support and ops costs.
- Wage inflation: ~6% Y/Y (2024)
- Demand: BLS +15% (2021–2031)
- Levers: shared services, distributed hiring, AI automation
E-commerce logistics and consumer spending
Consumer confidence and freight costs materially drive D2C performance; carrier rate swings and returns processing erode contribution margins. Diversifying channels and optimizing fulfillment (cheaper mix, regional nodes) stabilizes unit economics. Inventory-light and subscription models reduce revenue and margin volatility—returns average ~18% online; apparel >30%; subscription segments grew ~12% in 2024.
- Consumer confidence impacts demand; returns ~18% (online)
- Carrier rate volatility and returns cut margins
- Channel diversification + fulfillment optimization stabilize units
- Inventory-light/subscription models (≈12% growth in 2024) reduce volatility
Cross-border deals: policy volatility, tax & data rules squeeze margins—diversify and monitor risk
Higher rates (FF 5.25–5.50%, 10y ~4.3–4.5% mid‑2025) compress IRRs and favor cash‑generative targets; creative deal structures and hedging preserve returns. SaaS multiples retrenched to mid‑single‑digit EV/NTM (2023–24); mission‑critical tools keep NDR>100%. USD moves drove ~5–8% FY swings (2024–25); wage inflation ~6% (2024) pressures margins; online returns ~18%.
| Metric | Value |
|---|---|
| Fed funds (Jun–Jul 2025) | 5.25–5.50% |
| 10‑yr Treasury | ~4.3–4.5% |
| Wage inflation (2024) | ~6% |
| Online returns | ~18% |
| Subscription growth (2024) | ~12% |
Same Document Delivered
Tiny PESTLE Analysis
The preview shown here is the exact Tiny PESTLE Analysis document you’ll receive after purchase—fully formatted and ready to use. No placeholders or teasers; the layout, content, and structure are identical to the downloadable file. After payment you’ll instantly get this final, professionally structured file.











