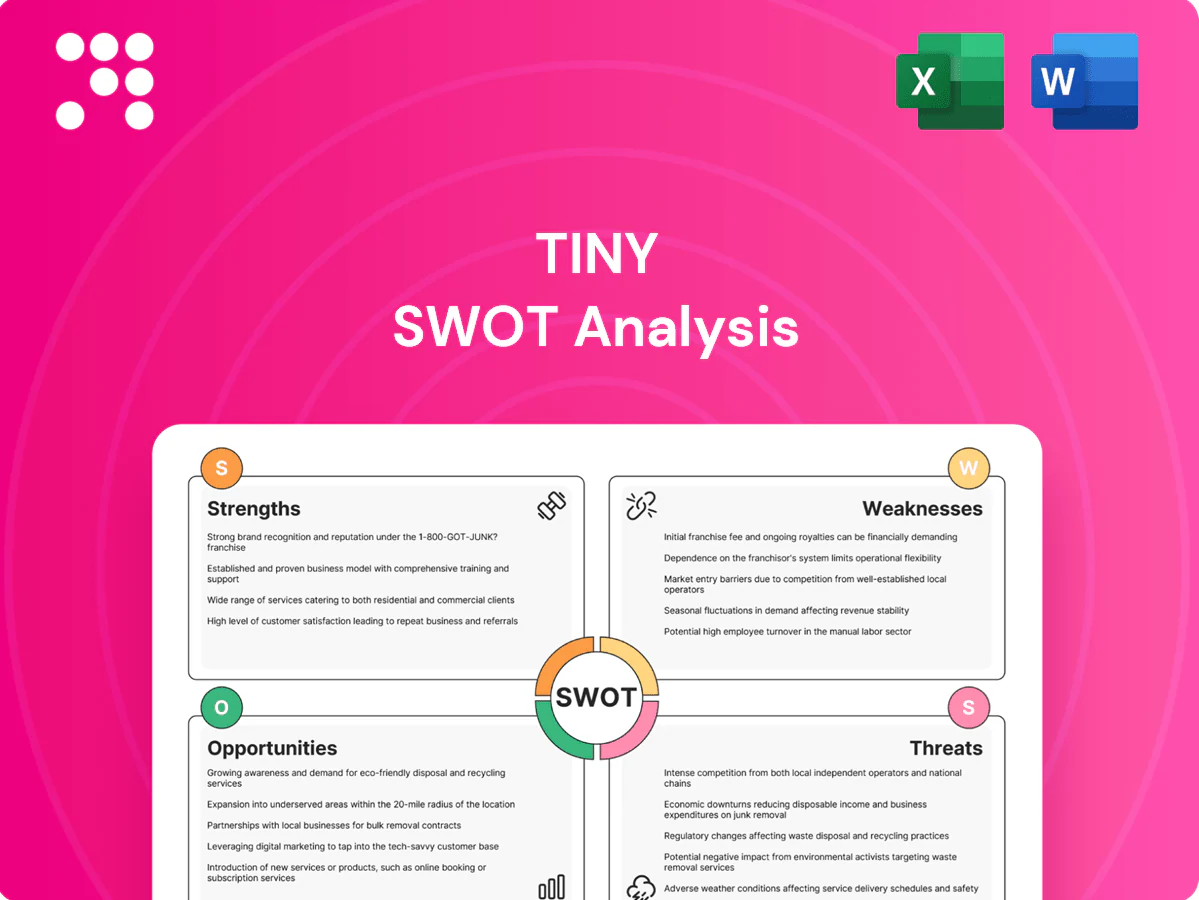
Tiny SWOT Analysis

Elevate Your Analysis with the Complete SWOT Report
What you’ve seen is a concise snapshot—unlock the full SWOT to reveal research-backed strengths, risks, and growth levers with actionable recommendations and financial context. Purchase the complete, editable report (Word + Excel) to support pitches, strategy, or investment decisions with confidence.
Strengths

Diversified digital portfolio
Spanning software, services and e-commerce reduces single-market dependency and smooths cash flows; global e-commerce topped about 6.3 trillion USD in 2023 and SaaS leaders often report net retention above 100%, illustrating complementary demand drivers. Diversification offsets cyclicality across niches, with SaaS gross margins commonly 70–80%. The mix broadens capital allocation optionality and supports resilient, steady compounding.
Profitable-first acquisitions
Prioritizing established, cash-generative targets lowers failure risk by focusing on predictable free cash flow and strong unit economics that enable self-funded growth and reinvestment. Stable cash yields improve debt capacity and downside protection, aligning returns with operating cash conversion rather than relying on speculative exit timing. With global private equity dry powder above $2.5 trillion in 2024, cash-yield strategies can deploy capital into sustainable, income-driven deals.

Decentralized operating model
Decentralized operating model gives portfolio CEOs autonomy to speed decisions and preserve founder DNA, while lean central teams keep overhead low (typical holding overheads cited in 2024 roll-up reports often under 10% of total headcount); operators remain close to customers and product, enabling scalable management across dozens of small companies (many roll-ups managed 30–80 entities by 2024).

Long-term ownership mindset
No forced exit timeline enables compounding over years, with Bain 2024 noting average PE holding periods near six years, aligning with teams seeking stability and stewardship. Patient capital typically funds prudent improvements rather than aggressive cuts and helps preserve brand equity when founders or sellers remain involved, supporting long-term value creation versus short-term extraction.
- holding_period: ~6 years (Bain 2024)
- stability: founder retention improves brand continuity
- strategy: patient capital -> capex/organic growth over cuts
Strong deal flow network
Strong deal flow network attracts off-market opportunities at fair prices, with proprietary channels commonly accounting for a large share of private-market wins and improving acquisition spreads. Prior successes generate referrals and repeat sellers, raising repeat-source deal share and shortening diligence timelines. A broad sourcing funnel increases selectivity, and this edge compounds with each closed transaction.
- off-market advantage: higher hit rate
- referrals: repeat sellers shorten cycles
- broad funnel: greater selectivity
- compounding: network value grows per deal
Diversified model: cash-generative e-commerce + SaaS roll-ups powered by patient PE capital
Diversified model (software, services, e-commerce) smooths cash flow; global e-commerce was about 6.3T in 2023 and SaaS leaders report net retention >100% with 70–80% gross margins. Focus on cash-generative targets and patient capital (PE dry powder >$2.5T in 2024; avg hold ~6 years) reduces risk and enables compounding. Decentralized ops cut overheads (<10%) and scale roll-ups (30–80 entities).
| Metric | Value |
|---|---|
| Global e-commerce (2023) | 6.3T USD |
| SaaS gross margin | 70–80% |
| SaaS net retention | >100% |
| PE dry powder (2024) | >2.5T USD |
| Avg PE hold (Bain 2024) | ~6 years |
| Holding overheads | <10% |
| Roll-up scale (by 2024) | 30–80 entities |
What is included in the product
 Detailed Word Document
Provides a concise strategic overview of Tiny’s internal strengths and weaknesses alongside external opportunities and threats, highlighting key growth drivers, operational gaps, and market risks to inform strategic decisions.

 Customizable Excel Spreadsheet
Delivers a compact SWOT snapshot that reduces analysis time and highlights priority actions for quick decision-making. Its clean, visual layout makes it easy to share with stakeholders and update as priorities shift.
Weaknesses

Sector concentration risk
Heavy tilts to internet businesses tie returns to digital cycles; top tech names represented roughly 28% of S&P 500 market cap in 2024, concentrating index risk. Platform dependency can amplify shocks—changes in a single platform’s algorithm or ad policy can dent ad-driven revenues across holdings. Historical downturns show correlations rising sharply (often >0.7–0.8), magnifying portfolio losses.
Integration complexity
Managing many small firms strains oversight and systems, and 70% of M&A integrations historically fail to capture expected synergies, highlighting execution risk. Heterogeneous tech stacks impede data visibility and slow consolidated reporting. Standardizing reports without stifling local autonomy is difficult, and limited execution bandwidth often becomes a bottleneck during simultaneous integrations.

Key founder reliance
Performance often hinges on original leaders staying engaged, leaving operations vulnerable if founders step back. Founder burnout or turnover can impair continuity; CB Insights lists team as a top reason for startup failure (23%). Incentive misalignment commonly surfaces post-acquisition, a factor in studies showing ~70% of acquisitions underperform. Succession planning is resource intensive and diverts scarce early-stage capital.

Limited shared synergies
Diverse niches reduce cross-selling potential, so portfolio-wide lift is muted; studies show roughly 70% of acquisitions fail to deliver expected value and planned synergies often reach only 30–60% within 2–3 years. Fragmented customer bases limit network effects and central services frequently misalign with local business models.
- Diverse niches → low cross-sell
- Fragmented bases → weak network effects
- Central services mismatch
- Synergy capture 30–60% over 2–3 years
Capital deployment pacing
Disciplined pricing in hot markets narrows deal volume and pushes firms to wait for value, while roughly $2.5 trillion of private equity dry powder as of 2024 can sit idle and drag net IRRs; smaller check sizes raise transaction overhead per dollar, and pipeline variability leads to lumpy, uneven growth quarters for small active managers.
- Disciplined pricing → fewer deals
- Idle dry powder (~$2.5T, 2024) → return drag
- Smaller checks → higher fee per $
- Pipeline variability → uneven growth
Concentration risk (28% top tech), M&A failure 70%, dry powder $2.5T
Concentration in internet/tech (top tech ~28% of S&P500 market cap in 2024) raises index and platform risk; correlations often spike >0.7–0.8 in downturns. High integration failure (≈70% of M&A) and limited synergy capture (30–60% in 2–3 years) impair returns. Founder turnover and team issues (team cited in 23% of startup failures) threaten continuity. $2.5T private equity dry powder (2024) can drag net IRRs.
| Metric | Value |
|---|---|
| Top tech share (2024) | ~28% S&P500 |
| M&A failure rate | ~70% |
| Synergy capture (2–3y) | 30–60% |
| Team failure cite | 23% |
| Dry powder (2024) | $2.5T |
Full Version Awaits
Tiny SWOT Analysis
This is the actual Tiny SWOT Analysis document you’ll receive upon purchase—no surprises, just professional quality. The preview below is taken directly from the full SWOT report you'll get; purchase unlocks the complete, editable version. Buy now to download the full, detailed file immediately after checkout.

Elevate Your Analysis with the Complete SWOT Report
What you’ve seen is a concise snapshot—unlock the full SWOT to reveal research-backed strengths, risks, and growth levers with actionable recommendations and financial context. Purchase the complete, editable report (Word + Excel) to support pitches, strategy, or investment decisions with confidence.
Strengths
Diversified digital portfolio
Spanning software, services and e-commerce reduces single-market dependency and smooths cash flows; global e-commerce topped about 6.3 trillion USD in 2023 and SaaS leaders often report net retention above 100%, illustrating complementary demand drivers. Diversification offsets cyclicality across niches, with SaaS gross margins commonly 70–80%. The mix broadens capital allocation optionality and supports resilient, steady compounding.
Profitable-first acquisitions
Prioritizing established, cash-generative targets lowers failure risk by focusing on predictable free cash flow and strong unit economics that enable self-funded growth and reinvestment. Stable cash yields improve debt capacity and downside protection, aligning returns with operating cash conversion rather than relying on speculative exit timing. With global private equity dry powder above $2.5 trillion in 2024, cash-yield strategies can deploy capital into sustainable, income-driven deals.
Decentralized operating model
Decentralized operating model gives portfolio CEOs autonomy to speed decisions and preserve founder DNA, while lean central teams keep overhead low (typical holding overheads cited in 2024 roll-up reports often under 10% of total headcount); operators remain close to customers and product, enabling scalable management across dozens of small companies (many roll-ups managed 30–80 entities by 2024).
Long-term ownership mindset
No forced exit timeline enables compounding over years, with Bain 2024 noting average PE holding periods near six years, aligning with teams seeking stability and stewardship. Patient capital typically funds prudent improvements rather than aggressive cuts and helps preserve brand equity when founders or sellers remain involved, supporting long-term value creation versus short-term extraction.
- holding_period: ~6 years (Bain 2024)
- stability: founder retention improves brand continuity
- strategy: patient capital -> capex/organic growth over cuts
Strong deal flow network
Strong deal flow network attracts off-market opportunities at fair prices, with proprietary channels commonly accounting for a large share of private-market wins and improving acquisition spreads. Prior successes generate referrals and repeat sellers, raising repeat-source deal share and shortening diligence timelines. A broad sourcing funnel increases selectivity, and this edge compounds with each closed transaction.
- off-market advantage: higher hit rate
- referrals: repeat sellers shorten cycles
- broad funnel: greater selectivity
- compounding: network value grows per deal
Diversified model: cash-generative e-commerce + SaaS roll-ups powered by patient PE capital
Diversified model (software, services, e-commerce) smooths cash flow; global e-commerce was about 6.3T in 2023 and SaaS leaders report net retention >100% with 70–80% gross margins. Focus on cash-generative targets and patient capital (PE dry powder >$2.5T in 2024; avg hold ~6 years) reduces risk and enables compounding. Decentralized ops cut overheads (<10%) and scale roll-ups (30–80 entities).
| Metric | Value |
|---|---|
| Global e-commerce (2023) | 6.3T USD |
| SaaS gross margin | 70–80% |
| SaaS net retention | >100% |
| PE dry powder (2024) | >2.5T USD |
| Avg PE hold (Bain 2024) | ~6 years |
| Holding overheads | <10% |
| Roll-up scale (by 2024) | 30–80 entities |
What is included in the product
Detailed Word Document
Provides a concise strategic overview of Tiny’s internal strengths and weaknesses alongside external opportunities and threats, highlighting key growth drivers, operational gaps, and market risks to inform strategic decisions.
Customizable Excel Spreadsheet
Delivers a compact SWOT snapshot that reduces analysis time and highlights priority actions for quick decision-making. Its clean, visual layout makes it easy to share with stakeholders and update as priorities shift.
Weaknesses
Sector concentration risk
Heavy tilts to internet businesses tie returns to digital cycles; top tech names represented roughly 28% of S&P 500 market cap in 2024, concentrating index risk. Platform dependency can amplify shocks—changes in a single platform’s algorithm or ad policy can dent ad-driven revenues across holdings. Historical downturns show correlations rising sharply (often >0.7–0.8), magnifying portfolio losses.
Integration complexity
Managing many small firms strains oversight and systems, and 70% of M&A integrations historically fail to capture expected synergies, highlighting execution risk. Heterogeneous tech stacks impede data visibility and slow consolidated reporting. Standardizing reports without stifling local autonomy is difficult, and limited execution bandwidth often becomes a bottleneck during simultaneous integrations.
Key founder reliance
Performance often hinges on original leaders staying engaged, leaving operations vulnerable if founders step back. Founder burnout or turnover can impair continuity; CB Insights lists team as a top reason for startup failure (23%). Incentive misalignment commonly surfaces post-acquisition, a factor in studies showing ~70% of acquisitions underperform. Succession planning is resource intensive and diverts scarce early-stage capital.
Limited shared synergies
Diverse niches reduce cross-selling potential, so portfolio-wide lift is muted; studies show roughly 70% of acquisitions fail to deliver expected value and planned synergies often reach only 30–60% within 2–3 years. Fragmented customer bases limit network effects and central services frequently misalign with local business models.
- Diverse niches → low cross-sell
- Fragmented bases → weak network effects
- Central services mismatch
- Synergy capture 30–60% over 2–3 years
Capital deployment pacing
Disciplined pricing in hot markets narrows deal volume and pushes firms to wait for value, while roughly $2.5 trillion of private equity dry powder as of 2024 can sit idle and drag net IRRs; smaller check sizes raise transaction overhead per dollar, and pipeline variability leads to lumpy, uneven growth quarters for small active managers.
- Disciplined pricing → fewer deals
- Idle dry powder (~$2.5T, 2024) → return drag
- Smaller checks → higher fee per $
- Pipeline variability → uneven growth
Concentration risk (28% top tech), M&A failure 70%, dry powder $2.5T
Concentration in internet/tech (top tech ~28% of S&P500 market cap in 2024) raises index and platform risk; correlations often spike >0.7–0.8 in downturns. High integration failure (≈70% of M&A) and limited synergy capture (30–60% in 2–3 years) impair returns. Founder turnover and team issues (team cited in 23% of startup failures) threaten continuity. $2.5T private equity dry powder (2024) can drag net IRRs.
| Metric | Value |
|---|---|
| Top tech share (2024) | ~28% S&P500 |
| M&A failure rate | ~70% |
| Synergy capture (2–3y) | 30–60% |
| Team failure cite | 23% |
| Dry powder (2024) | $2.5T |
Full Version Awaits
Tiny SWOT Analysis
This is the actual Tiny SWOT Analysis document you’ll receive upon purchase—no surprises, just professional quality. The preview below is taken directly from the full SWOT report you'll get; purchase unlocks the complete, editable version. Buy now to download the full, detailed file immediately after checkout.
Description
Elevate Your Analysis with the Complete SWOT Report
What you’ve seen is a concise snapshot—unlock the full SWOT to reveal research-backed strengths, risks, and growth levers with actionable recommendations and financial context. Purchase the complete, editable report (Word + Excel) to support pitches, strategy, or investment decisions with confidence.
Strengths
Diversified digital portfolio
Spanning software, services and e-commerce reduces single-market dependency and smooths cash flows; global e-commerce topped about 6.3 trillion USD in 2023 and SaaS leaders often report net retention above 100%, illustrating complementary demand drivers. Diversification offsets cyclicality across niches, with SaaS gross margins commonly 70–80%. The mix broadens capital allocation optionality and supports resilient, steady compounding.
Profitable-first acquisitions
Prioritizing established, cash-generative targets lowers failure risk by focusing on predictable free cash flow and strong unit economics that enable self-funded growth and reinvestment. Stable cash yields improve debt capacity and downside protection, aligning returns with operating cash conversion rather than relying on speculative exit timing. With global private equity dry powder above $2.5 trillion in 2024, cash-yield strategies can deploy capital into sustainable, income-driven deals.
Decentralized operating model
Decentralized operating model gives portfolio CEOs autonomy to speed decisions and preserve founder DNA, while lean central teams keep overhead low (typical holding overheads cited in 2024 roll-up reports often under 10% of total headcount); operators remain close to customers and product, enabling scalable management across dozens of small companies (many roll-ups managed 30–80 entities by 2024).
Long-term ownership mindset
No forced exit timeline enables compounding over years, with Bain 2024 noting average PE holding periods near six years, aligning with teams seeking stability and stewardship. Patient capital typically funds prudent improvements rather than aggressive cuts and helps preserve brand equity when founders or sellers remain involved, supporting long-term value creation versus short-term extraction.
- holding_period: ~6 years (Bain 2024)
- stability: founder retention improves brand continuity
- strategy: patient capital -> capex/organic growth over cuts
Strong deal flow network
Strong deal flow network attracts off-market opportunities at fair prices, with proprietary channels commonly accounting for a large share of private-market wins and improving acquisition spreads. Prior successes generate referrals and repeat sellers, raising repeat-source deal share and shortening diligence timelines. A broad sourcing funnel increases selectivity, and this edge compounds with each closed transaction.
- off-market advantage: higher hit rate
- referrals: repeat sellers shorten cycles
- broad funnel: greater selectivity
- compounding: network value grows per deal
Diversified model: cash-generative e-commerce + SaaS roll-ups powered by patient PE capital
Diversified model (software, services, e-commerce) smooths cash flow; global e-commerce was about 6.3T in 2023 and SaaS leaders report net retention >100% with 70–80% gross margins. Focus on cash-generative targets and patient capital (PE dry powder >$2.5T in 2024; avg hold ~6 years) reduces risk and enables compounding. Decentralized ops cut overheads (<10%) and scale roll-ups (30–80 entities).
| Metric | Value |
|---|---|
| Global e-commerce (2023) | 6.3T USD |
| SaaS gross margin | 70–80% |
| SaaS net retention | >100% |
| PE dry powder (2024) | >2.5T USD |
| Avg PE hold (Bain 2024) | ~6 years |
| Holding overheads | <10% |
| Roll-up scale (by 2024) | 30–80 entities |
What is included in the product
Detailed Word Document
Provides a concise strategic overview of Tiny’s internal strengths and weaknesses alongside external opportunities and threats, highlighting key growth drivers, operational gaps, and market risks to inform strategic decisions.
Customizable Excel Spreadsheet
Delivers a compact SWOT snapshot that reduces analysis time and highlights priority actions for quick decision-making. Its clean, visual layout makes it easy to share with stakeholders and update as priorities shift.
Weaknesses
Sector concentration risk
Heavy tilts to internet businesses tie returns to digital cycles; top tech names represented roughly 28% of S&P 500 market cap in 2024, concentrating index risk. Platform dependency can amplify shocks—changes in a single platform’s algorithm or ad policy can dent ad-driven revenues across holdings. Historical downturns show correlations rising sharply (often >0.7–0.8), magnifying portfolio losses.
Integration complexity
Managing many small firms strains oversight and systems, and 70% of M&A integrations historically fail to capture expected synergies, highlighting execution risk. Heterogeneous tech stacks impede data visibility and slow consolidated reporting. Standardizing reports without stifling local autonomy is difficult, and limited execution bandwidth often becomes a bottleneck during simultaneous integrations.
Key founder reliance
Performance often hinges on original leaders staying engaged, leaving operations vulnerable if founders step back. Founder burnout or turnover can impair continuity; CB Insights lists team as a top reason for startup failure (23%). Incentive misalignment commonly surfaces post-acquisition, a factor in studies showing ~70% of acquisitions underperform. Succession planning is resource intensive and diverts scarce early-stage capital.
Limited shared synergies
Diverse niches reduce cross-selling potential, so portfolio-wide lift is muted; studies show roughly 70% of acquisitions fail to deliver expected value and planned synergies often reach only 30–60% within 2–3 years. Fragmented customer bases limit network effects and central services frequently misalign with local business models.
- Diverse niches → low cross-sell
- Fragmented bases → weak network effects
- Central services mismatch
- Synergy capture 30–60% over 2–3 years
Capital deployment pacing
Disciplined pricing in hot markets narrows deal volume and pushes firms to wait for value, while roughly $2.5 trillion of private equity dry powder as of 2024 can sit idle and drag net IRRs; smaller check sizes raise transaction overhead per dollar, and pipeline variability leads to lumpy, uneven growth quarters for small active managers.
- Disciplined pricing → fewer deals
- Idle dry powder (~$2.5T, 2024) → return drag
- Smaller checks → higher fee per $
- Pipeline variability → uneven growth
Concentration risk (28% top tech), M&A failure 70%, dry powder $2.5T
Concentration in internet/tech (top tech ~28% of S&P500 market cap in 2024) raises index and platform risk; correlations often spike >0.7–0.8 in downturns. High integration failure (≈70% of M&A) and limited synergy capture (30–60% in 2–3 years) impair returns. Founder turnover and team issues (team cited in 23% of startup failures) threaten continuity. $2.5T private equity dry powder (2024) can drag net IRRs.
| Metric | Value |
|---|---|
| Top tech share (2024) | ~28% S&P500 |
| M&A failure rate | ~70% |
| Synergy capture (2–3y) | 30–60% |
| Team failure cite | 23% |
| Dry powder (2024) | $2.5T |
Full Version Awaits
Tiny SWOT Analysis
This is the actual Tiny SWOT Analysis document you’ll receive upon purchase—no surprises, just professional quality. The preview below is taken directly from the full SWOT report you'll get; purchase unlocks the complete, editable version. Buy now to download the full, detailed file immediately after checkout.











