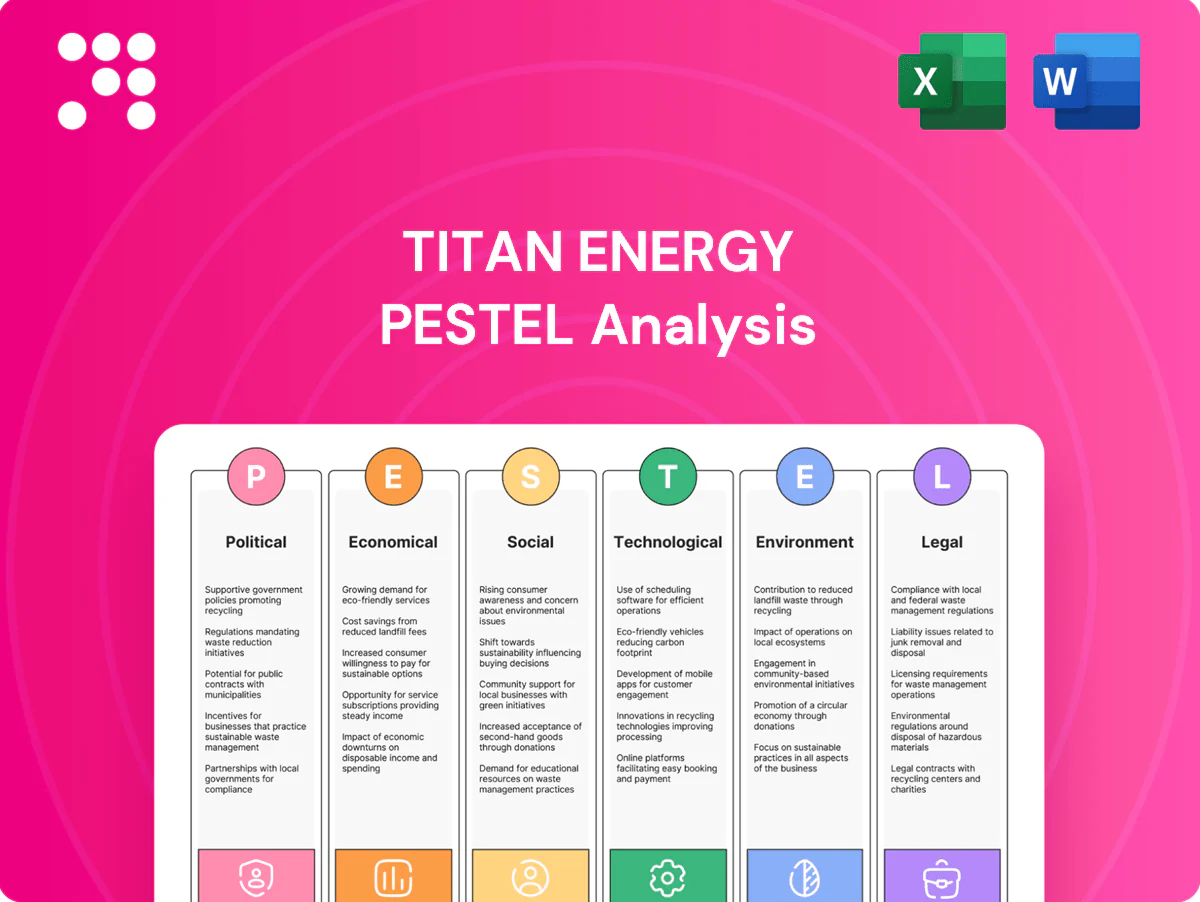
Titan Energy PESTLE Analysis

Plan Smarter. Present Sharper. Compete Stronger.
Discover how political shifts, economic cycles, and technological change are reshaping Titan Energy’s outlook in our concise PESTLE preview; it highlights key risks and opportunities for investors and strategists. Purchase the full analysis for the complete, actionable report.
Political factors

Federal energy policy shifts
Changes in U.S. administration priorities can speed or slow upstream permitting, leasing and methane enforcement; the Inflation Reduction Act mobilized roughly $369 billion for clean energy, reallocating capital away from oil and gas. Appalachian Basin output of about 38 Bcf/d (2023–24) means federal agency staffing and guidance can materially affect project timelines. Titan must scenario‑plan for pendulum swings in fossil‑fuel stance.
State-level regulation in Appalachia
Pennsylvania maintains no statewide natural‑gas severance tax while West Virginia levies a 5% gas severance tax and Ohio applies its own higher‑rate regime, creating material per‑well cost differences. Divergent bonding, setback and water rules drive cross‑border economic gaps that can reach several hundred thousand dollars per well. Titan can optimize pad placement and sequencing to exploit favorable state regimes, but policy harmonization or further divergence will shift competitive advantage.

Permitting and infrastructure politics
Pipeline approvals and gathering line siting remain politically sensitive; NEPA reviews and local permits often add 12–24 months to projects. Delays have historically widened basis differentials—Permian spreads surged as much as $15/bbl in stressed periods—constraining takeaway and capping realized prices. Titan’s production growth depends on midstream alignment and local political support, and proactive engagement with regulators and communities can materially reduce bottleneck risk.

Local governance and community approvals
County and township ordinances can restrict truck routes, noise and operating hours, often adding 6–18 months to permitting timelines; local councils and school boards shape social license and can halt projects during hearings. Titan should use transparent communication, community benefits and mitigation plans to streamline approvals. Local elections can rapidly shift operating conditions and permitting priorities.
- County ordinances: restrict routes, noise, hours
- School boards/councils: influence social license
- Mitigation: transparent communication + benefits
- Elections: can change approvals timeline
Geopolitical supply dynamics
Geopolitical shocks from OPEC+ cuts, the Russia‑Ukraine war and Middle East tensions pushed Brent and WTI volatility in 2024–H1 2025 (Brent broadly ranged ~$80–95/bbl), driving U.S. energy policy rhetoric; higher prices can spur drilling yet revive regulatory and fiscal scrutiny. Titan should adopt scenario-linked hedges and monitor LNG/NGL export policy shifts that reprice regional demand.
- OPEC+/cuts → price spikes
- Russia‑Ukraine & Middle East → supply risk
- Hedging tied to geopolitical scenarios
- U.S. LNG/NGL export policy alters regional prices
IRA $369B and 12-24 month NEPA delays heighten volatility in Appalachian gas
Federal shifts (IRA $369 billion) and NEPA/agency staffing can change permitting timelines by 12–24 months; Appalachian output ~38 Bcf/d (2023–24) magnifies impact. State regimes vary—Pennsylvania no severance tax, West Virginia 5%—driving per‑well economics. Geopolitical shocks pushed Brent ~$80–95/bbl in 2024–H1 2025, increasing price/permit volatility.
| Factor | Metric |
|---|---|
| IRA funding | $369B |
| Appalachian output | ~38 Bcf/d |
| NEPA delays | 12–24 months |
| WV severance | 5% |
| Brent 2024–H1 2025 | $80–95/bbl |
What is included in the product
 Detailed Word Document
Explores how macro-environmental factors uniquely impact Titan Energy across Political, Economic, Social, Technological, Environmental, and Legal dimensions, with each section supported by relevant data and current trends. Designed for executives and investors, the analysis highlights threats, opportunities, and forward-looking insights to guide strategy, scenario planning, and funding decisions.

 Customizable Excel Spreadsheet
A clean, summarized Titan Energy PESTLE that’s visually segmented by PESTEL categories for quick interpretation, easily editable with region- or business-specific notes and formatted for seamless insertion into presentations or team-alignment materials.
Economic factors

Commodity price volatility
Commodity price volatility directly controls Titan Energy’s cash flow, borrowing base and development pace: WTI averaged about $80/bbl in 2024 and Henry Hub around $3/MMBtu, so price swings of 20–30% can cut borrowing bases materially. Heavy Appalachian exposure makes revenues sensitive to Henry Hub and local basis differentials (often negative by up to several $/MMBtu). Titan should expand hedges and keep capex flexible to protect margins; price collapses can strand inventory while spikes strain services and supply chains.
Basis and takeaway capacity
Appalachian production (~36 Bcf/d) typically trades at a basis $1–3/MMBtu below Henry Hub, directly depressing realized gas prices; pipeline expansions (eg, recent capacity adds) tend to compress that gap while constraints can push differentials toward $5/MMBtu in winter peaks. Titan’s marketing contracts and firm transport commitments underpin revenue stability, and proactive coordination with midstream partners reduces curtailment risk.

Capital access and interest rates
Higher policy rates (Fed funds 5.25–5.50% and 10‑yr Treasury ~4.2% in mid‑2025) push up WACC and lower PV‑10 valuations for reserves. Lenders now weight PDP reserves, stress decline‑curve proofs and ESG screening in covenants. Titan should reduce reliance on RBLs, pursue bonds or private credit and keep net leverage disciplined. Credit spreads move with cycle: IG OAS ~90bp vs HY ~350bp, tightening in rallies, widening in stress.

Service costs and inflation
Pressure pumping, tubulars, labor and diesel costs swing directly with activity; U.S. CPI was 3.4% in 2024 and average diesel ran about $4.03/gal, so inflation can erode well‑level IRRs even if hydrocarbon prices stay steady. Titan must lock contracts, standardize designs and optimize pad logistics to protect margins; deflation windows let it capture backlog and reprice AFEs.
- Lock long‑term service contracts
- Standardize well designs
- Optimize pad logistics to cut non‑op costs
- Use deflation to reprice AFEs and lock backlog
NGL and condensate pricing
Wet‑gas windows’ liquids uplift materially raises per‑MCF returns, with condensate and NGLs often contributing the majority of value in liquids‑rich plays; Mont Belvieu propane/butane hubs set regional netbacks and trade publicly (OPIS/Platts).
Titan’s ability to shift product mix and secure fractionation and fractionator capacity drives margin capture, while storage and seasonal arbitrage (winter propane demand peaks) provide marketing optionality.
- Mont Belvieu hub determines regional netbacks
- Product mix + fractionation access = earnings lever
- Storage/seasonality = marketing optionality
- Liquids uplift key to well economics
IRA $369B and 12-24 month NEPA delays heighten volatility in Appalachian gas
Commodity volatility (WTI ~$80/bbl, Henry Hub ~$3/MMBtu in 2024) and Appalachian basis (often -$1–3/MMBtu) drive cash flow and borrowing base; higher rates (Fed 5.25–5.50%, 10yr ~4.2% mid‑2025) raise WACC and compress PV‑10. Inflation (CPI 3.4% in 2024, diesel ~$4.03/gal) lifts service costs; liquids uplift and fractionation access remain key margin levers.
| Metric | Value |
|---|---|
| WTI 2024 | $80/bbl |
| Henry Hub 2024 | $3/MMBtu |
| Appalachian prod | ~36 Bcf/d |
| Fed funds mid‑2025 | 5.25–5.50% |
What You See Is What You Get
Titan Energy PESTLE Analysis
The preview shown here is the exact Titan Energy PESTLE Analysis you’ll receive after purchase — fully formatted, professionally structured, and ready to use. The content, layout, and insights visible in this preview are identical to the downloadable file. No placeholders or teasers—this is the finished document you’ll instantly get upon checkout.

Plan Smarter. Present Sharper. Compete Stronger.
Discover how political shifts, economic cycles, and technological change are reshaping Titan Energy’s outlook in our concise PESTLE preview; it highlights key risks and opportunities for investors and strategists. Purchase the full analysis for the complete, actionable report.
Political factors
Federal energy policy shifts
Changes in U.S. administration priorities can speed or slow upstream permitting, leasing and methane enforcement; the Inflation Reduction Act mobilized roughly $369 billion for clean energy, reallocating capital away from oil and gas. Appalachian Basin output of about 38 Bcf/d (2023–24) means federal agency staffing and guidance can materially affect project timelines. Titan must scenario‑plan for pendulum swings in fossil‑fuel stance.
State-level regulation in Appalachia
Pennsylvania maintains no statewide natural‑gas severance tax while West Virginia levies a 5% gas severance tax and Ohio applies its own higher‑rate regime, creating material per‑well cost differences. Divergent bonding, setback and water rules drive cross‑border economic gaps that can reach several hundred thousand dollars per well. Titan can optimize pad placement and sequencing to exploit favorable state regimes, but policy harmonization or further divergence will shift competitive advantage.
Permitting and infrastructure politics
Pipeline approvals and gathering line siting remain politically sensitive; NEPA reviews and local permits often add 12–24 months to projects. Delays have historically widened basis differentials—Permian spreads surged as much as $15/bbl in stressed periods—constraining takeaway and capping realized prices. Titan’s production growth depends on midstream alignment and local political support, and proactive engagement with regulators and communities can materially reduce bottleneck risk.
Local governance and community approvals
County and township ordinances can restrict truck routes, noise and operating hours, often adding 6–18 months to permitting timelines; local councils and school boards shape social license and can halt projects during hearings. Titan should use transparent communication, community benefits and mitigation plans to streamline approvals. Local elections can rapidly shift operating conditions and permitting priorities.
- County ordinances: restrict routes, noise, hours
- School boards/councils: influence social license
- Mitigation: transparent communication + benefits
- Elections: can change approvals timeline
Geopolitical supply dynamics
Geopolitical shocks from OPEC+ cuts, the Russia‑Ukraine war and Middle East tensions pushed Brent and WTI volatility in 2024–H1 2025 (Brent broadly ranged ~$80–95/bbl), driving U.S. energy policy rhetoric; higher prices can spur drilling yet revive regulatory and fiscal scrutiny. Titan should adopt scenario-linked hedges and monitor LNG/NGL export policy shifts that reprice regional demand.
- OPEC+/cuts → price spikes
- Russia‑Ukraine & Middle East → supply risk
- Hedging tied to geopolitical scenarios
- U.S. LNG/NGL export policy alters regional prices
IRA $369B and 12-24 month NEPA delays heighten volatility in Appalachian gas
Federal shifts (IRA $369 billion) and NEPA/agency staffing can change permitting timelines by 12–24 months; Appalachian output ~38 Bcf/d (2023–24) magnifies impact. State regimes vary—Pennsylvania no severance tax, West Virginia 5%—driving per‑well economics. Geopolitical shocks pushed Brent ~$80–95/bbl in 2024–H1 2025, increasing price/permit volatility.
| Factor | Metric |
|---|---|
| IRA funding | $369B |
| Appalachian output | ~38 Bcf/d |
| NEPA delays | 12–24 months |
| WV severance | 5% |
| Brent 2024–H1 2025 | $80–95/bbl |
What is included in the product
Detailed Word Document
Explores how macro-environmental factors uniquely impact Titan Energy across Political, Economic, Social, Technological, Environmental, and Legal dimensions, with each section supported by relevant data and current trends. Designed for executives and investors, the analysis highlights threats, opportunities, and forward-looking insights to guide strategy, scenario planning, and funding decisions.
Customizable Excel Spreadsheet
A clean, summarized Titan Energy PESTLE that’s visually segmented by PESTEL categories for quick interpretation, easily editable with region- or business-specific notes and formatted for seamless insertion into presentations or team-alignment materials.
Economic factors
Commodity price volatility
Commodity price volatility directly controls Titan Energy’s cash flow, borrowing base and development pace: WTI averaged about $80/bbl in 2024 and Henry Hub around $3/MMBtu, so price swings of 20–30% can cut borrowing bases materially. Heavy Appalachian exposure makes revenues sensitive to Henry Hub and local basis differentials (often negative by up to several $/MMBtu). Titan should expand hedges and keep capex flexible to protect margins; price collapses can strand inventory while spikes strain services and supply chains.
Basis and takeaway capacity
Appalachian production (~36 Bcf/d) typically trades at a basis $1–3/MMBtu below Henry Hub, directly depressing realized gas prices; pipeline expansions (eg, recent capacity adds) tend to compress that gap while constraints can push differentials toward $5/MMBtu in winter peaks. Titan’s marketing contracts and firm transport commitments underpin revenue stability, and proactive coordination with midstream partners reduces curtailment risk.
Capital access and interest rates
Higher policy rates (Fed funds 5.25–5.50% and 10‑yr Treasury ~4.2% in mid‑2025) push up WACC and lower PV‑10 valuations for reserves. Lenders now weight PDP reserves, stress decline‑curve proofs and ESG screening in covenants. Titan should reduce reliance on RBLs, pursue bonds or private credit and keep net leverage disciplined. Credit spreads move with cycle: IG OAS ~90bp vs HY ~350bp, tightening in rallies, widening in stress.
Service costs and inflation
Pressure pumping, tubulars, labor and diesel costs swing directly with activity; U.S. CPI was 3.4% in 2024 and average diesel ran about $4.03/gal, so inflation can erode well‑level IRRs even if hydrocarbon prices stay steady. Titan must lock contracts, standardize designs and optimize pad logistics to protect margins; deflation windows let it capture backlog and reprice AFEs.
- Lock long‑term service contracts
- Standardize well designs
- Optimize pad logistics to cut non‑op costs
- Use deflation to reprice AFEs and lock backlog
NGL and condensate pricing
Wet‑gas windows’ liquids uplift materially raises per‑MCF returns, with condensate and NGLs often contributing the majority of value in liquids‑rich plays; Mont Belvieu propane/butane hubs set regional netbacks and trade publicly (OPIS/Platts).
Titan’s ability to shift product mix and secure fractionation and fractionator capacity drives margin capture, while storage and seasonal arbitrage (winter propane demand peaks) provide marketing optionality.
- Mont Belvieu hub determines regional netbacks
- Product mix + fractionation access = earnings lever
- Storage/seasonality = marketing optionality
- Liquids uplift key to well economics
IRA $369B and 12-24 month NEPA delays heighten volatility in Appalachian gas
Commodity volatility (WTI ~$80/bbl, Henry Hub ~$3/MMBtu in 2024) and Appalachian basis (often -$1–3/MMBtu) drive cash flow and borrowing base; higher rates (Fed 5.25–5.50%, 10yr ~4.2% mid‑2025) raise WACC and compress PV‑10. Inflation (CPI 3.4% in 2024, diesel ~$4.03/gal) lifts service costs; liquids uplift and fractionation access remain key margin levers.
| Metric | Value |
|---|---|
| WTI 2024 | $80/bbl |
| Henry Hub 2024 | $3/MMBtu |
| Appalachian prod | ~36 Bcf/d |
| Fed funds mid‑2025 | 5.25–5.50% |
What You See Is What You Get
Titan Energy PESTLE Analysis
The preview shown here is the exact Titan Energy PESTLE Analysis you’ll receive after purchase — fully formatted, professionally structured, and ready to use. The content, layout, and insights visible in this preview are identical to the downloadable file. No placeholders or teasers—this is the finished document you’ll instantly get upon checkout.
Original: $10.00
-65%$10.00
$3.50Description
Plan Smarter. Present Sharper. Compete Stronger.
Discover how political shifts, economic cycles, and technological change are reshaping Titan Energy’s outlook in our concise PESTLE preview; it highlights key risks and opportunities for investors and strategists. Purchase the full analysis for the complete, actionable report.
Political factors
Federal energy policy shifts
Changes in U.S. administration priorities can speed or slow upstream permitting, leasing and methane enforcement; the Inflation Reduction Act mobilized roughly $369 billion for clean energy, reallocating capital away from oil and gas. Appalachian Basin output of about 38 Bcf/d (2023–24) means federal agency staffing and guidance can materially affect project timelines. Titan must scenario‑plan for pendulum swings in fossil‑fuel stance.
State-level regulation in Appalachia
Pennsylvania maintains no statewide natural‑gas severance tax while West Virginia levies a 5% gas severance tax and Ohio applies its own higher‑rate regime, creating material per‑well cost differences. Divergent bonding, setback and water rules drive cross‑border economic gaps that can reach several hundred thousand dollars per well. Titan can optimize pad placement and sequencing to exploit favorable state regimes, but policy harmonization or further divergence will shift competitive advantage.
Permitting and infrastructure politics
Pipeline approvals and gathering line siting remain politically sensitive; NEPA reviews and local permits often add 12–24 months to projects. Delays have historically widened basis differentials—Permian spreads surged as much as $15/bbl in stressed periods—constraining takeaway and capping realized prices. Titan’s production growth depends on midstream alignment and local political support, and proactive engagement with regulators and communities can materially reduce bottleneck risk.
Local governance and community approvals
County and township ordinances can restrict truck routes, noise and operating hours, often adding 6–18 months to permitting timelines; local councils and school boards shape social license and can halt projects during hearings. Titan should use transparent communication, community benefits and mitigation plans to streamline approvals. Local elections can rapidly shift operating conditions and permitting priorities.
- County ordinances: restrict routes, noise, hours
- School boards/councils: influence social license
- Mitigation: transparent communication + benefits
- Elections: can change approvals timeline
Geopolitical supply dynamics
Geopolitical shocks from OPEC+ cuts, the Russia‑Ukraine war and Middle East tensions pushed Brent and WTI volatility in 2024–H1 2025 (Brent broadly ranged ~$80–95/bbl), driving U.S. energy policy rhetoric; higher prices can spur drilling yet revive regulatory and fiscal scrutiny. Titan should adopt scenario-linked hedges and monitor LNG/NGL export policy shifts that reprice regional demand.
- OPEC+/cuts → price spikes
- Russia‑Ukraine & Middle East → supply risk
- Hedging tied to geopolitical scenarios
- U.S. LNG/NGL export policy alters regional prices
IRA $369B and 12-24 month NEPA delays heighten volatility in Appalachian gas
Federal shifts (IRA $369 billion) and NEPA/agency staffing can change permitting timelines by 12–24 months; Appalachian output ~38 Bcf/d (2023–24) magnifies impact. State regimes vary—Pennsylvania no severance tax, West Virginia 5%—driving per‑well economics. Geopolitical shocks pushed Brent ~$80–95/bbl in 2024–H1 2025, increasing price/permit volatility.
| Factor | Metric |
|---|---|
| IRA funding | $369B |
| Appalachian output | ~38 Bcf/d |
| NEPA delays | 12–24 months |
| WV severance | 5% |
| Brent 2024–H1 2025 | $80–95/bbl |
What is included in the product
Detailed Word Document
Explores how macro-environmental factors uniquely impact Titan Energy across Political, Economic, Social, Technological, Environmental, and Legal dimensions, with each section supported by relevant data and current trends. Designed for executives and investors, the analysis highlights threats, opportunities, and forward-looking insights to guide strategy, scenario planning, and funding decisions.
Customizable Excel Spreadsheet
A clean, summarized Titan Energy PESTLE that’s visually segmented by PESTEL categories for quick interpretation, easily editable with region- or business-specific notes and formatted for seamless insertion into presentations or team-alignment materials.
Economic factors
Commodity price volatility
Commodity price volatility directly controls Titan Energy’s cash flow, borrowing base and development pace: WTI averaged about $80/bbl in 2024 and Henry Hub around $3/MMBtu, so price swings of 20–30% can cut borrowing bases materially. Heavy Appalachian exposure makes revenues sensitive to Henry Hub and local basis differentials (often negative by up to several $/MMBtu). Titan should expand hedges and keep capex flexible to protect margins; price collapses can strand inventory while spikes strain services and supply chains.
Basis and takeaway capacity
Appalachian production (~36 Bcf/d) typically trades at a basis $1–3/MMBtu below Henry Hub, directly depressing realized gas prices; pipeline expansions (eg, recent capacity adds) tend to compress that gap while constraints can push differentials toward $5/MMBtu in winter peaks. Titan’s marketing contracts and firm transport commitments underpin revenue stability, and proactive coordination with midstream partners reduces curtailment risk.
Capital access and interest rates
Higher policy rates (Fed funds 5.25–5.50% and 10‑yr Treasury ~4.2% in mid‑2025) push up WACC and lower PV‑10 valuations for reserves. Lenders now weight PDP reserves, stress decline‑curve proofs and ESG screening in covenants. Titan should reduce reliance on RBLs, pursue bonds or private credit and keep net leverage disciplined. Credit spreads move with cycle: IG OAS ~90bp vs HY ~350bp, tightening in rallies, widening in stress.
Service costs and inflation
Pressure pumping, tubulars, labor and diesel costs swing directly with activity; U.S. CPI was 3.4% in 2024 and average diesel ran about $4.03/gal, so inflation can erode well‑level IRRs even if hydrocarbon prices stay steady. Titan must lock contracts, standardize designs and optimize pad logistics to protect margins; deflation windows let it capture backlog and reprice AFEs.
- Lock long‑term service contracts
- Standardize well designs
- Optimize pad logistics to cut non‑op costs
- Use deflation to reprice AFEs and lock backlog
NGL and condensate pricing
Wet‑gas windows’ liquids uplift materially raises per‑MCF returns, with condensate and NGLs often contributing the majority of value in liquids‑rich plays; Mont Belvieu propane/butane hubs set regional netbacks and trade publicly (OPIS/Platts).
Titan’s ability to shift product mix and secure fractionation and fractionator capacity drives margin capture, while storage and seasonal arbitrage (winter propane demand peaks) provide marketing optionality.
- Mont Belvieu hub determines regional netbacks
- Product mix + fractionation access = earnings lever
- Storage/seasonality = marketing optionality
- Liquids uplift key to well economics
IRA $369B and 12-24 month NEPA delays heighten volatility in Appalachian gas
Commodity volatility (WTI ~$80/bbl, Henry Hub ~$3/MMBtu in 2024) and Appalachian basis (often -$1–3/MMBtu) drive cash flow and borrowing base; higher rates (Fed 5.25–5.50%, 10yr ~4.2% mid‑2025) raise WACC and compress PV‑10. Inflation (CPI 3.4% in 2024, diesel ~$4.03/gal) lifts service costs; liquids uplift and fractionation access remain key margin levers.
| Metric | Value |
|---|---|
| WTI 2024 | $80/bbl |
| Henry Hub 2024 | $3/MMBtu |
| Appalachian prod | ~36 Bcf/d |
| Fed funds mid‑2025 | 5.25–5.50% |
What You See Is What You Get
Titan Energy PESTLE Analysis
The preview shown here is the exact Titan Energy PESTLE Analysis you’ll receive after purchase — fully formatted, professionally structured, and ready to use. The content, layout, and insights visible in this preview are identical to the downloadable file. No placeholders or teasers—this is the finished document you’ll instantly get upon checkout.











