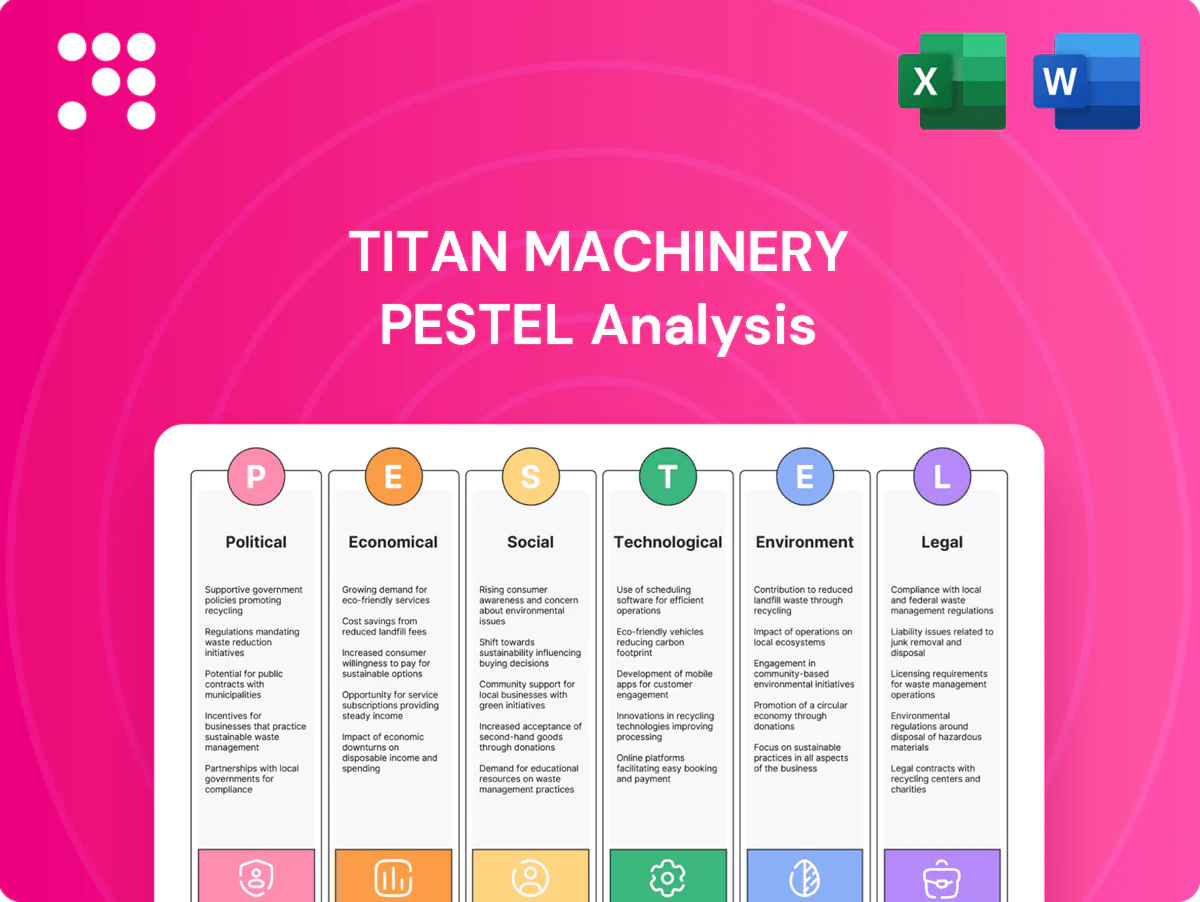
Titan Machinery PESTLE Analysis

Plan Smarter. Present Sharper. Compete Stronger.
Gain strategic clarity with our PESTLE Analysis of Titan Machinery, revealing how political, economic, social, technological, legal and environmental forces shape growth and risk. Actionable insights highlight regulatory exposures, supply-chain pressures, tech adoption opportunities and sustainability trends. Ideal for investors, advisors and strategists who need ready-to-use intelligence. Purchase the full report for the complete, editable breakdown and immediate download.
Political factors

Ag policy and subsidies
Government farm bills and subsidy schemes — USDA commodity and conservation payments topping $40B in 2023 — plus rural development grants drive cyclical demand for tractors, combines and precision gear; supportive measures in 2024-25 boosted replacement and precision-adoption spending, while cuts or payment delays commonly defer grower capex. Titan Machinery’s sales and service utilization closely track these policy signals.
Infrastructure and public works
Construction budgets, highway bills and municipal capital plans—bolstered by the 2021 Bipartisan Infrastructure Law (about $550 billion new federal spending within a $1.2 trillion package)—drive demand for construction fleets, boosting Titan Machinery rentals, parts and service revenue. 2023 US construction put-in-place near $1.9 trillion supports backlog conversion, while stimulus outlays spike rental utilization; fiscal tightening reduces project starts and shifts store-level mix toward maintenance over new-equipment sales.

Trade and tariff exposure
US Section 232 tariffs (25% steel, 10% aluminum) raise costs for farm equipment makers and can compress Titan Machinery margins through higher input prices. Retaliatory ag tariffs (China levies up to 25% on soy at peak) have historically reduced farm incomes and delayed equipment upgrades, with US net farm income down roughly 20% from 2021 highs. USMCA and trade deals improve parts flow across borders, while Titan (FY2024 revenue ~$2.8B) must optimize sourcing and pass-through pricing strategies to protect margins.

Rural development priorities
- Broadband: $65B IIJA
- ReConnect: $1.2B+ awarded
- Water: $50+B BIL
- Risk: funding reallocation reduces service demand
Geopolitical and election cycles
Election outcomes such as the 2024 US vote shift spending priorities and regulatory tone for ag and construction, while ongoing 2024–25 geopolitical tensions (Russia–Ukraine, China–Taiwan) continue to threaten OEM deliveries and global supply chains. Market volatility forces Titan to keep inventory and pricing agility, and flexible rental and service offerings help preserve revenue during uncertainty.
- Political risk: 2024 election policy swings
- Geopolitics: supply/OEM delivery disruption
- Operational: inventory & pricing agility
- Strategic: rental/service flexibility
Policy-driven $40B farm aid and $550B IIJA spur equipment demand; tariffs & 2024 risk
Policy-driven farm payments (USDA ~$40B in 2023), IIJA/BIL infrastructure spending (~$550B new) and rural grants (ReConnect $1.2B+) materially drive tractor, combine and rental demand, while tariffs (Steel 25%) and 2024 election swings create margin and timing risks for Titan Machinery (FY2024 revenue ~$2.8B).
| Metric | Value |
|---|---|
| USDA payments 2023 | $40B |
| IIJA new spending | $550B |
| Titan FY2024 revenue | $2.8B |
What is included in the product
 Detailed Word Document
Explores how Political, Economic, Social, Technological, Environmental and Legal forces uniquely affect Titan Machinery, with data-backed trends and region-specific examples; designed for executives and investors to identify risks, opportunities and forward-looking scenarios for strategy and funding decisions.

 Customizable Excel Spreadsheet
A concise, PESTLE-segmented summary that clarifies external risks and opportunities for Titan Machinery, easily dropped into presentations, shared across teams, and edited with context-specific notes for faster strategic alignment.
Economic factors

Farm income and commodity prices
USDA estimated net farm income at $142.4B in 2024, with benchmark corn averaging about $4.70/bu and U.S. corn yield near 176 bu/acre, driving growers’ capex ability. High commodity prices pull forward equipment replacements while downturns boost repairs and demand for used units. Precision upgrades rise when ROI is clear. Titan adjusts its product mix seasonally toward new machines, used inventory and precision systems.
Interest rates and financing
Equipment purchases are highly rate-sensitive and often financed; as of July 2025 the federal funds target range is 5.25%-5.50%, which raises borrower costs and can push customers toward rentals, used units, or extended service agreements. Titan is a major John Deere dealer, and OEM financing programs like John Deere Financial help mitigate rate headwinds. Titan’s sales cadence closely tracks financing affordability and program availability.

Construction cycle and housing
Nonresidential starts and U.S. housing permits drive earthmoving demand and fleet turnover for Titan Machinery; U.S. housing starts averaged about 1.45 million units in 2024, supporting replacement and rental purchases. Strong construction backlogs in 2024-25 elevated parts and service consumption, boosting aftermarket revenue. During slowdowns customers shift to maintenance and short-term rentals, preserving utilization. Utilization rates directly correlate with follow-on parts, service and rental revenue.

Inflation and input costs
Parts, labor and logistics inflation—roughly 3–5% across key categories in 2024—compress Titan Machinery margins unless passed to customers; buyers may delay replacements in high-inflation periods, and inventory carrying costs rise as price levels climb. Dynamic pricing and higher inventory turns are critical to protect gross margin and cash flow.
- Parts & labor inflation ~3–5% (2024)
- Customers delay replacements
- Inventory carrying costs increase with prices
- Dynamic pricing + faster turns = margin protection
Labor market tightness
Labor-market tightness drives wage pressure and longer service lead times as technician vacancy rates hit about 15% in 2024, pushing Titan Machinery to compete on pay and scheduling; customer operator shortages boost demand for automation and precision tools, raising parts and telematics sales. Training investment—now a strategic differentiator—supports service capacity, directly affecting customer loyalty and retention.
- technician-vacancy: ~15% (2024)
- training-reduces-churn: key differentiator
- automation-demand: increased parts/telematics sales
- service-capacity: drives customer loyalty
Policy-driven $40B farm aid and $550B IIJA spur equipment demand; tariffs & 2024 risk
USDA net farm income $142.4B (2024) and corn ~$4.70/bu support capex and new equipment demand; fed funds 5.25–5.50% (Jul 2025) raises financing costs, pushing buyers to used, rentals or OEM finance. Housing starts ~1.45M (2024) buoy earthmoving demand; parts/labor inflation 3–5% (2024) and technician vacancy ~15% (2024) press margins and service capacity.
| Metric | Value |
|---|---|
| Net farm income (2024) | $142.4B |
| Fed funds (Jul 2025) | 5.25–5.50% |
| US housing starts (2024) | ~1.45M |
| Parts/labor inflation (2024) | 3–5% |
| Technician vacancy (2024) | ~15% |
Preview the Actual Deliverable
Titan Machinery PESTLE Analysis
The preview shown here is the exact Titan Machinery PESTLE Analysis document you’ll receive after purchase—fully formatted and ready to use. This file is the final version and contains the complete, professionally structured PESTLE review with no placeholders. What you see is what you’ll download instantly after payment. Use it directly for strategic planning, reporting, or presentations.

Plan Smarter. Present Sharper. Compete Stronger.
Gain strategic clarity with our PESTLE Analysis of Titan Machinery, revealing how political, economic, social, technological, legal and environmental forces shape growth and risk. Actionable insights highlight regulatory exposures, supply-chain pressures, tech adoption opportunities and sustainability trends. Ideal for investors, advisors and strategists who need ready-to-use intelligence. Purchase the full report for the complete, editable breakdown and immediate download.
Political factors
Ag policy and subsidies
Government farm bills and subsidy schemes — USDA commodity and conservation payments topping $40B in 2023 — plus rural development grants drive cyclical demand for tractors, combines and precision gear; supportive measures in 2024-25 boosted replacement and precision-adoption spending, while cuts or payment delays commonly defer grower capex. Titan Machinery’s sales and service utilization closely track these policy signals.
Infrastructure and public works
Construction budgets, highway bills and municipal capital plans—bolstered by the 2021 Bipartisan Infrastructure Law (about $550 billion new federal spending within a $1.2 trillion package)—drive demand for construction fleets, boosting Titan Machinery rentals, parts and service revenue. 2023 US construction put-in-place near $1.9 trillion supports backlog conversion, while stimulus outlays spike rental utilization; fiscal tightening reduces project starts and shifts store-level mix toward maintenance over new-equipment sales.
Trade and tariff exposure
US Section 232 tariffs (25% steel, 10% aluminum) raise costs for farm equipment makers and can compress Titan Machinery margins through higher input prices. Retaliatory ag tariffs (China levies up to 25% on soy at peak) have historically reduced farm incomes and delayed equipment upgrades, with US net farm income down roughly 20% from 2021 highs. USMCA and trade deals improve parts flow across borders, while Titan (FY2024 revenue ~$2.8B) must optimize sourcing and pass-through pricing strategies to protect margins.
Rural development priorities
- Broadband: $65B IIJA
- ReConnect: $1.2B+ awarded
- Water: $50+B BIL
- Risk: funding reallocation reduces service demand
Geopolitical and election cycles
Election outcomes such as the 2024 US vote shift spending priorities and regulatory tone for ag and construction, while ongoing 2024–25 geopolitical tensions (Russia–Ukraine, China–Taiwan) continue to threaten OEM deliveries and global supply chains. Market volatility forces Titan to keep inventory and pricing agility, and flexible rental and service offerings help preserve revenue during uncertainty.
- Political risk: 2024 election policy swings
- Geopolitics: supply/OEM delivery disruption
- Operational: inventory & pricing agility
- Strategic: rental/service flexibility
Policy-driven $40B farm aid and $550B IIJA spur equipment demand; tariffs & 2024 risk
Policy-driven farm payments (USDA ~$40B in 2023), IIJA/BIL infrastructure spending (~$550B new) and rural grants (ReConnect $1.2B+) materially drive tractor, combine and rental demand, while tariffs (Steel 25%) and 2024 election swings create margin and timing risks for Titan Machinery (FY2024 revenue ~$2.8B).
| Metric | Value |
|---|---|
| USDA payments 2023 | $40B |
| IIJA new spending | $550B |
| Titan FY2024 revenue | $2.8B |
What is included in the product
Detailed Word Document
Explores how Political, Economic, Social, Technological, Environmental and Legal forces uniquely affect Titan Machinery, with data-backed trends and region-specific examples; designed for executives and investors to identify risks, opportunities and forward-looking scenarios for strategy and funding decisions.
Customizable Excel Spreadsheet
A concise, PESTLE-segmented summary that clarifies external risks and opportunities for Titan Machinery, easily dropped into presentations, shared across teams, and edited with context-specific notes for faster strategic alignment.
Economic factors
Farm income and commodity prices
USDA estimated net farm income at $142.4B in 2024, with benchmark corn averaging about $4.70/bu and U.S. corn yield near 176 bu/acre, driving growers’ capex ability. High commodity prices pull forward equipment replacements while downturns boost repairs and demand for used units. Precision upgrades rise when ROI is clear. Titan adjusts its product mix seasonally toward new machines, used inventory and precision systems.
Interest rates and financing
Equipment purchases are highly rate-sensitive and often financed; as of July 2025 the federal funds target range is 5.25%-5.50%, which raises borrower costs and can push customers toward rentals, used units, or extended service agreements. Titan is a major John Deere dealer, and OEM financing programs like John Deere Financial help mitigate rate headwinds. Titan’s sales cadence closely tracks financing affordability and program availability.
Construction cycle and housing
Nonresidential starts and U.S. housing permits drive earthmoving demand and fleet turnover for Titan Machinery; U.S. housing starts averaged about 1.45 million units in 2024, supporting replacement and rental purchases. Strong construction backlogs in 2024-25 elevated parts and service consumption, boosting aftermarket revenue. During slowdowns customers shift to maintenance and short-term rentals, preserving utilization. Utilization rates directly correlate with follow-on parts, service and rental revenue.
Inflation and input costs
Parts, labor and logistics inflation—roughly 3–5% across key categories in 2024—compress Titan Machinery margins unless passed to customers; buyers may delay replacements in high-inflation periods, and inventory carrying costs rise as price levels climb. Dynamic pricing and higher inventory turns are critical to protect gross margin and cash flow.
- Parts & labor inflation ~3–5% (2024)
- Customers delay replacements
- Inventory carrying costs increase with prices
- Dynamic pricing + faster turns = margin protection
Labor market tightness
Labor-market tightness drives wage pressure and longer service lead times as technician vacancy rates hit about 15% in 2024, pushing Titan Machinery to compete on pay and scheduling; customer operator shortages boost demand for automation and precision tools, raising parts and telematics sales. Training investment—now a strategic differentiator—supports service capacity, directly affecting customer loyalty and retention.
- technician-vacancy: ~15% (2024)
- training-reduces-churn: key differentiator
- automation-demand: increased parts/telematics sales
- service-capacity: drives customer loyalty
Policy-driven $40B farm aid and $550B IIJA spur equipment demand; tariffs & 2024 risk
USDA net farm income $142.4B (2024) and corn ~$4.70/bu support capex and new equipment demand; fed funds 5.25–5.50% (Jul 2025) raises financing costs, pushing buyers to used, rentals or OEM finance. Housing starts ~1.45M (2024) buoy earthmoving demand; parts/labor inflation 3–5% (2024) and technician vacancy ~15% (2024) press margins and service capacity.
| Metric | Value |
|---|---|
| Net farm income (2024) | $142.4B |
| Fed funds (Jul 2025) | 5.25–5.50% |
| US housing starts (2024) | ~1.45M |
| Parts/labor inflation (2024) | 3–5% |
| Technician vacancy (2024) | ~15% |
Preview the Actual Deliverable
Titan Machinery PESTLE Analysis
The preview shown here is the exact Titan Machinery PESTLE Analysis document you’ll receive after purchase—fully formatted and ready to use. This file is the final version and contains the complete, professionally structured PESTLE review with no placeholders. What you see is what you’ll download instantly after payment. Use it directly for strategic planning, reporting, or presentations.
Original: $10.00
-65%$10.00
$3.50Description
Plan Smarter. Present Sharper. Compete Stronger.
Gain strategic clarity with our PESTLE Analysis of Titan Machinery, revealing how political, economic, social, technological, legal and environmental forces shape growth and risk. Actionable insights highlight regulatory exposures, supply-chain pressures, tech adoption opportunities and sustainability trends. Ideal for investors, advisors and strategists who need ready-to-use intelligence. Purchase the full report for the complete, editable breakdown and immediate download.
Political factors
Ag policy and subsidies
Government farm bills and subsidy schemes — USDA commodity and conservation payments topping $40B in 2023 — plus rural development grants drive cyclical demand for tractors, combines and precision gear; supportive measures in 2024-25 boosted replacement and precision-adoption spending, while cuts or payment delays commonly defer grower capex. Titan Machinery’s sales and service utilization closely track these policy signals.
Infrastructure and public works
Construction budgets, highway bills and municipal capital plans—bolstered by the 2021 Bipartisan Infrastructure Law (about $550 billion new federal spending within a $1.2 trillion package)—drive demand for construction fleets, boosting Titan Machinery rentals, parts and service revenue. 2023 US construction put-in-place near $1.9 trillion supports backlog conversion, while stimulus outlays spike rental utilization; fiscal tightening reduces project starts and shifts store-level mix toward maintenance over new-equipment sales.
Trade and tariff exposure
US Section 232 tariffs (25% steel, 10% aluminum) raise costs for farm equipment makers and can compress Titan Machinery margins through higher input prices. Retaliatory ag tariffs (China levies up to 25% on soy at peak) have historically reduced farm incomes and delayed equipment upgrades, with US net farm income down roughly 20% from 2021 highs. USMCA and trade deals improve parts flow across borders, while Titan (FY2024 revenue ~$2.8B) must optimize sourcing and pass-through pricing strategies to protect margins.
Rural development priorities
- Broadband: $65B IIJA
- ReConnect: $1.2B+ awarded
- Water: $50+B BIL
- Risk: funding reallocation reduces service demand
Geopolitical and election cycles
Election outcomes such as the 2024 US vote shift spending priorities and regulatory tone for ag and construction, while ongoing 2024–25 geopolitical tensions (Russia–Ukraine, China–Taiwan) continue to threaten OEM deliveries and global supply chains. Market volatility forces Titan to keep inventory and pricing agility, and flexible rental and service offerings help preserve revenue during uncertainty.
- Political risk: 2024 election policy swings
- Geopolitics: supply/OEM delivery disruption
- Operational: inventory & pricing agility
- Strategic: rental/service flexibility
Policy-driven $40B farm aid and $550B IIJA spur equipment demand; tariffs & 2024 risk
Policy-driven farm payments (USDA ~$40B in 2023), IIJA/BIL infrastructure spending (~$550B new) and rural grants (ReConnect $1.2B+) materially drive tractor, combine and rental demand, while tariffs (Steel 25%) and 2024 election swings create margin and timing risks for Titan Machinery (FY2024 revenue ~$2.8B).
| Metric | Value |
|---|---|
| USDA payments 2023 | $40B |
| IIJA new spending | $550B |
| Titan FY2024 revenue | $2.8B |
What is included in the product
Detailed Word Document
Explores how Political, Economic, Social, Technological, Environmental and Legal forces uniquely affect Titan Machinery, with data-backed trends and region-specific examples; designed for executives and investors to identify risks, opportunities and forward-looking scenarios for strategy and funding decisions.
Customizable Excel Spreadsheet
A concise, PESTLE-segmented summary that clarifies external risks and opportunities for Titan Machinery, easily dropped into presentations, shared across teams, and edited with context-specific notes for faster strategic alignment.
Economic factors
Farm income and commodity prices
USDA estimated net farm income at $142.4B in 2024, with benchmark corn averaging about $4.70/bu and U.S. corn yield near 176 bu/acre, driving growers’ capex ability. High commodity prices pull forward equipment replacements while downturns boost repairs and demand for used units. Precision upgrades rise when ROI is clear. Titan adjusts its product mix seasonally toward new machines, used inventory and precision systems.
Interest rates and financing
Equipment purchases are highly rate-sensitive and often financed; as of July 2025 the federal funds target range is 5.25%-5.50%, which raises borrower costs and can push customers toward rentals, used units, or extended service agreements. Titan is a major John Deere dealer, and OEM financing programs like John Deere Financial help mitigate rate headwinds. Titan’s sales cadence closely tracks financing affordability and program availability.
Construction cycle and housing
Nonresidential starts and U.S. housing permits drive earthmoving demand and fleet turnover for Titan Machinery; U.S. housing starts averaged about 1.45 million units in 2024, supporting replacement and rental purchases. Strong construction backlogs in 2024-25 elevated parts and service consumption, boosting aftermarket revenue. During slowdowns customers shift to maintenance and short-term rentals, preserving utilization. Utilization rates directly correlate with follow-on parts, service and rental revenue.
Inflation and input costs
Parts, labor and logistics inflation—roughly 3–5% across key categories in 2024—compress Titan Machinery margins unless passed to customers; buyers may delay replacements in high-inflation periods, and inventory carrying costs rise as price levels climb. Dynamic pricing and higher inventory turns are critical to protect gross margin and cash flow.
- Parts & labor inflation ~3–5% (2024)
- Customers delay replacements
- Inventory carrying costs increase with prices
- Dynamic pricing + faster turns = margin protection
Labor market tightness
Labor-market tightness drives wage pressure and longer service lead times as technician vacancy rates hit about 15% in 2024, pushing Titan Machinery to compete on pay and scheduling; customer operator shortages boost demand for automation and precision tools, raising parts and telematics sales. Training investment—now a strategic differentiator—supports service capacity, directly affecting customer loyalty and retention.
- technician-vacancy: ~15% (2024)
- training-reduces-churn: key differentiator
- automation-demand: increased parts/telematics sales
- service-capacity: drives customer loyalty
Policy-driven $40B farm aid and $550B IIJA spur equipment demand; tariffs & 2024 risk
USDA net farm income $142.4B (2024) and corn ~$4.70/bu support capex and new equipment demand; fed funds 5.25–5.50% (Jul 2025) raises financing costs, pushing buyers to used, rentals or OEM finance. Housing starts ~1.45M (2024) buoy earthmoving demand; parts/labor inflation 3–5% (2024) and technician vacancy ~15% (2024) press margins and service capacity.
| Metric | Value |
|---|---|
| Net farm income (2024) | $142.4B |
| Fed funds (Jul 2025) | 5.25–5.50% |
| US housing starts (2024) | ~1.45M |
| Parts/labor inflation (2024) | 3–5% |
| Technician vacancy (2024) | ~15% |
Preview the Actual Deliverable
Titan Machinery PESTLE Analysis
The preview shown here is the exact Titan Machinery PESTLE Analysis document you’ll receive after purchase—fully formatted and ready to use. This file is the final version and contains the complete, professionally structured PESTLE review with no placeholders. What you see is what you’ll download instantly after payment. Use it directly for strategic planning, reporting, or presentations.











