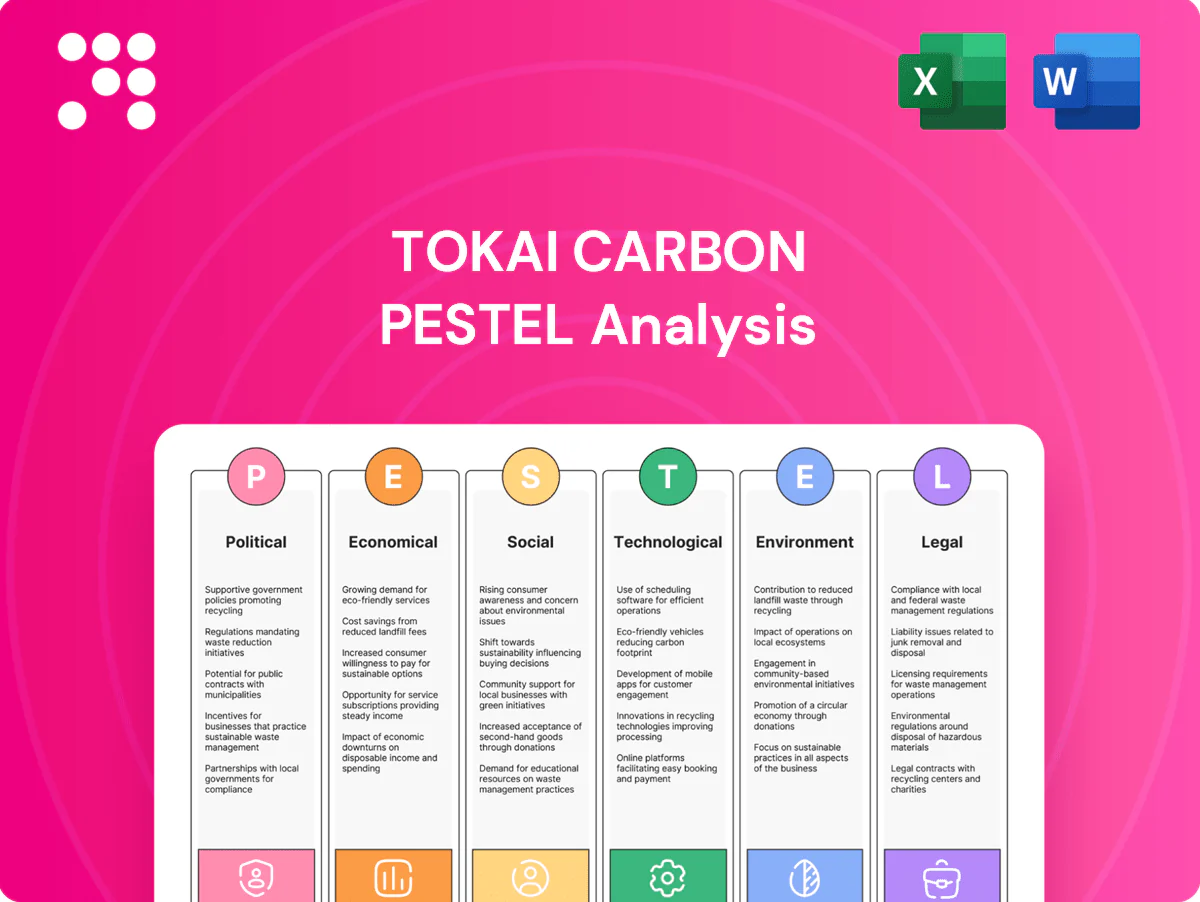
Tokai Carbon PESTLE Analysis

Make Smarter Strategic Decisions with a Complete PESTEL View
Our PESTLE Analysis of Tokai Carbon reveals how political shifts, commodity cycles, and cleantech trends are reshaping its markets and margins. Designed for investors and strategists, it highlights regulatory and environmental risks plus emergent opportunities. Purchase the full report to get actionable insights and ready-to-use, editable deliverables.
Political factors

Trade tariffs and geopolitics
Tariff and non‑tariff barriers across US‑China‑EU corridors — including US Section 301 tariffs of up to 25% and the EU Carbon Border Adjustment Mechanism (transitional since 2023) — raise risks for carbon black, graphite electrodes and specialty graphite. Geopolitical tensions can disrupt needle coke, coal tar pitch and petroleum feedstock flows, impacting supply continuity. Tokai Carbon may need to diversify sourcing and build regional redundancy; strategic stockpiles and dual‑sourcing contracts can mitigate shocks.
Export controls on advanced materials
High-purity graphite and semiconductor-grade components are increasingly subject to export licenses as Japan, the US and EU tighten dual-use controls. The US CHIPS Act allocates $52.7 billion to bolster domestic semiconductor capacity, increasing regulatory scrutiny on supply chains. Compliance can add weeks to lead times and limit addressable markets, so early screening and compliance-by-design reduce disruption and legal risk.

Industrial policy and subsidies
US Inflation Reduction Act mobilizes roughly $369 billion in clean energy incentives, while the EU Net-Zero Industry Act pushes faster permitting and scaling of strategic net-zero tech toward 2030, and Japan has reoriented subsidies to onshore EV, semiconductor and steel supply chains. Localization pressures may drive Tokai Carbon to co-locate capacity near subsidized steel, EV and chip projects. Accessing grants can materially reduce capex for furnace and purification upgrades, so policy shifts force agile, rephased capex planning.

Energy and carbon policy direction
- Policy impact: higher scrutiny and cost on calcination
- Japan targets: 46% by 2030, net-zero 2050
- Carbon price signal: EU ETS ~€90–100/t (2024)
- Mitigants: renewables tariffs, green H2 pilots, long-term PPAs
Sanctions and country risk
Sanctions on specific regions constrain raw-material logistics and customer access, tightening supply of specialty carbon feedstocks and limiting market reach. Maritime insurance and rerouting have raised freight costs (high-risk-route premiums climbed ~40% in 2023–24), pressuring margins. Tokai Carbon must monitor counterparty exposure, reroute supply chains and use political risk insurance and contractual clauses as buffers.
- Sanctions → supply/customer constraints
- Insurance/routing → freight +~40% (2023–24)
- Counterparty exposure monitoring
- Political risk insurance & contracts
Policy shocks force graphite supply chain regionalization; EU ETS, CHIPS, IRA raise costs
Tariffs, export controls and sanctions raise costs and restrict markets for carbon black, electrodes and high‑purity graphite, forcing regionalization and dual sourcing. EU ETS prices (~€90–100/t in 2024) and Japan GHG targets (46% by 2030, net‑zero 2050) increase calcination input costs. US CHIPS ($52.7bn) and IRA (~$369bn) drive localization and subsidy opportunities; freight premiums rose ~40% (2023–24).
| Risk/Policy | Metric/Value |
|---|---|
| EU ETS (2024) | €90–100/t |
| Japan target | 46% by 2030; net‑zero 2050 |
| US CHIPS | $52.7bn |
| IRA | $369bn |
| Freight premium | +~40% (2023–24) |
What is included in the product
 Detailed Word Document
Explores how macro-environmental factors uniquely affect Tokai Carbon across Political, Economic, Social, Technological, Environmental and Legal dimensions, combining data-driven trends and region-specific regulatory context to identify risks and opportunities. Designed for executives and investors, it offers detailed sub-points, forward-looking scenario insights and clean formatting for reports and decks.

 Customizable Excel Spreadsheet
A clean, summarized Tokai Carbon PESTLE that’s visually segmented by PESTEL categories for quick interpretation and meeting-ready slides, allowing users to add notes specific to regions or business lines for fast team alignment.
Economic factors

Steel cycle sensitivity
Graphite electrode demand closely mirrors electric arc furnace utilization, with EAF share of global steelmaking rising to about one-third by 2024 (≈33% per World Steel Association), so downcycles compress volumes and pricing while upcycles strain capacity and lift margins.
Tokai Carbon mitigates swings through inventory discipline and flexible production, and multi-year offtakes (commonly 1–3 years) help smooth cash flows and reduce spot exposure.
Auto and tire demand
Carbon black and friction-material demand tracks vehicle production and replacement tires; replacement tires account for roughly 60% of global tire volumes, cushioning OEM volatility. Rising EV mix—EU BEV share about 22% in 2024—boosts demand for specialty grades and low-rolling-resistance compounds. Aftermarket resilience helps offset OEM swings, while price-indexed contracts largely pass through feedstock cost movements.

Semiconductor capital cycle
Specialty graphite for wafers, epitaxy and high-temp fixtures at Tokai Carbon moves with wafer-fab capex; global fab-equipment spending rose about 12% in 2024 to roughly $85bn (SEMI), supporting demand for high-purity components. AI-driven capacity builds (notably HPC logic and foundry) add structural tailwinds for ultra-high-purity graphite and epitaxy susceptor parts. Order visibility remains lumpy quarter-to-quarter, but multi-stage vendor qualification raises customer stickiness and pricing leverage. Tokai Carbon’s balanced end-market mix limits single-cycle exposure and smooths revenue swings.

Feedstock and energy costs
FX and interest rates
Yen volatility (USD/JPY around 155 in mid-2025) drives translation swings and export pricing for Japan-headquartered Tokai Carbon, while global rate cycles (US fed funds ~5.25–5.50% in 2024–25; BoJ policy back near 0–0.5%) affect capex affordability and customer investment timing. Local production and invoicing alignment provide natural hedges; prudent leverage preserves flexibility in downturns.
- FX exposure: USD/JPY ≈155 (mid‑2025)
- Rates: Fed ≈5.25–5.50%, BoJ ≈0–0.5%
- Risk mitigant: local production & currency alignment
- Balance sheet: prudent leverage maintains optionality
Policy shocks force graphite supply chain regionalization; EU ETS, CHIPS, IRA raise costs
EAF share ~33% (2024) ties graphite electrode demand to steel cycles, while Tokai uses offtakes and flexible production to dampen spot swings. EV rise (EU BEV ~22% 2024) and fab capex ($85bn 2024) lift specialty graphite demand. Feedstock (needle coke, pitch) and power drive COGS; USD/JPY ≈155 (mid‑2025) and Fed ~5.25–5.50% affect margins and capex.
| Metric | Value |
|---|---|
| EAF share | ≈33% (2024) |
| EU BEV | ≈22% (2024) |
| Fab spend | $85bn (2024) |
| USD/JPY | ≈155 (mid‑2025) |
Same Document Delivered
Tokai Carbon PESTLE Analysis
This Tokai Carbon PESTLE Analysis preview is the exact, fully formatted document you’ll receive after purchase—comprehensive, current, and ready to use. It contains the same structure, insights, and charts shown here with no placeholders or edits. After checkout you’ll instantly download this finished file and can apply the strategic findings immediately.

Make Smarter Strategic Decisions with a Complete PESTEL View
Our PESTLE Analysis of Tokai Carbon reveals how political shifts, commodity cycles, and cleantech trends are reshaping its markets and margins. Designed for investors and strategists, it highlights regulatory and environmental risks plus emergent opportunities. Purchase the full report to get actionable insights and ready-to-use, editable deliverables.
Political factors
Trade tariffs and geopolitics
Tariff and non‑tariff barriers across US‑China‑EU corridors — including US Section 301 tariffs of up to 25% and the EU Carbon Border Adjustment Mechanism (transitional since 2023) — raise risks for carbon black, graphite electrodes and specialty graphite. Geopolitical tensions can disrupt needle coke, coal tar pitch and petroleum feedstock flows, impacting supply continuity. Tokai Carbon may need to diversify sourcing and build regional redundancy; strategic stockpiles and dual‑sourcing contracts can mitigate shocks.
Export controls on advanced materials
High-purity graphite and semiconductor-grade components are increasingly subject to export licenses as Japan, the US and EU tighten dual-use controls. The US CHIPS Act allocates $52.7 billion to bolster domestic semiconductor capacity, increasing regulatory scrutiny on supply chains. Compliance can add weeks to lead times and limit addressable markets, so early screening and compliance-by-design reduce disruption and legal risk.
Industrial policy and subsidies
US Inflation Reduction Act mobilizes roughly $369 billion in clean energy incentives, while the EU Net-Zero Industry Act pushes faster permitting and scaling of strategic net-zero tech toward 2030, and Japan has reoriented subsidies to onshore EV, semiconductor and steel supply chains. Localization pressures may drive Tokai Carbon to co-locate capacity near subsidized steel, EV and chip projects. Accessing grants can materially reduce capex for furnace and purification upgrades, so policy shifts force agile, rephased capex planning.
Energy and carbon policy direction
- Policy impact: higher scrutiny and cost on calcination
- Japan targets: 46% by 2030, net-zero 2050
- Carbon price signal: EU ETS ~€90–100/t (2024)
- Mitigants: renewables tariffs, green H2 pilots, long-term PPAs
Sanctions and country risk
Sanctions on specific regions constrain raw-material logistics and customer access, tightening supply of specialty carbon feedstocks and limiting market reach. Maritime insurance and rerouting have raised freight costs (high-risk-route premiums climbed ~40% in 2023–24), pressuring margins. Tokai Carbon must monitor counterparty exposure, reroute supply chains and use political risk insurance and contractual clauses as buffers.
- Sanctions → supply/customer constraints
- Insurance/routing → freight +~40% (2023–24)
- Counterparty exposure monitoring
- Political risk insurance & contracts
Policy shocks force graphite supply chain regionalization; EU ETS, CHIPS, IRA raise costs
Tariffs, export controls and sanctions raise costs and restrict markets for carbon black, electrodes and high‑purity graphite, forcing regionalization and dual sourcing. EU ETS prices (~€90–100/t in 2024) and Japan GHG targets (46% by 2030, net‑zero 2050) increase calcination input costs. US CHIPS ($52.7bn) and IRA (~$369bn) drive localization and subsidy opportunities; freight premiums rose ~40% (2023–24).
| Risk/Policy | Metric/Value |
|---|---|
| EU ETS (2024) | €90–100/t |
| Japan target | 46% by 2030; net‑zero 2050 |
| US CHIPS | $52.7bn |
| IRA | $369bn |
| Freight premium | +~40% (2023–24) |
What is included in the product
Detailed Word Document
Explores how macro-environmental factors uniquely affect Tokai Carbon across Political, Economic, Social, Technological, Environmental and Legal dimensions, combining data-driven trends and region-specific regulatory context to identify risks and opportunities. Designed for executives and investors, it offers detailed sub-points, forward-looking scenario insights and clean formatting for reports and decks.
Customizable Excel Spreadsheet
A clean, summarized Tokai Carbon PESTLE that’s visually segmented by PESTEL categories for quick interpretation and meeting-ready slides, allowing users to add notes specific to regions or business lines for fast team alignment.
Economic factors
Steel cycle sensitivity
Graphite electrode demand closely mirrors electric arc furnace utilization, with EAF share of global steelmaking rising to about one-third by 2024 (≈33% per World Steel Association), so downcycles compress volumes and pricing while upcycles strain capacity and lift margins.
Tokai Carbon mitigates swings through inventory discipline and flexible production, and multi-year offtakes (commonly 1–3 years) help smooth cash flows and reduce spot exposure.
Auto and tire demand
Carbon black and friction-material demand tracks vehicle production and replacement tires; replacement tires account for roughly 60% of global tire volumes, cushioning OEM volatility. Rising EV mix—EU BEV share about 22% in 2024—boosts demand for specialty grades and low-rolling-resistance compounds. Aftermarket resilience helps offset OEM swings, while price-indexed contracts largely pass through feedstock cost movements.
Semiconductor capital cycle
Specialty graphite for wafers, epitaxy and high-temp fixtures at Tokai Carbon moves with wafer-fab capex; global fab-equipment spending rose about 12% in 2024 to roughly $85bn (SEMI), supporting demand for high-purity components. AI-driven capacity builds (notably HPC logic and foundry) add structural tailwinds for ultra-high-purity graphite and epitaxy susceptor parts. Order visibility remains lumpy quarter-to-quarter, but multi-stage vendor qualification raises customer stickiness and pricing leverage. Tokai Carbon’s balanced end-market mix limits single-cycle exposure and smooths revenue swings.
Feedstock and energy costs
FX and interest rates
Yen volatility (USD/JPY around 155 in mid-2025) drives translation swings and export pricing for Japan-headquartered Tokai Carbon, while global rate cycles (US fed funds ~5.25–5.50% in 2024–25; BoJ policy back near 0–0.5%) affect capex affordability and customer investment timing. Local production and invoicing alignment provide natural hedges; prudent leverage preserves flexibility in downturns.
- FX exposure: USD/JPY ≈155 (mid‑2025)
- Rates: Fed ≈5.25–5.50%, BoJ ≈0–0.5%
- Risk mitigant: local production & currency alignment
- Balance sheet: prudent leverage maintains optionality
Policy shocks force graphite supply chain regionalization; EU ETS, CHIPS, IRA raise costs
EAF share ~33% (2024) ties graphite electrode demand to steel cycles, while Tokai uses offtakes and flexible production to dampen spot swings. EV rise (EU BEV ~22% 2024) and fab capex ($85bn 2024) lift specialty graphite demand. Feedstock (needle coke, pitch) and power drive COGS; USD/JPY ≈155 (mid‑2025) and Fed ~5.25–5.50% affect margins and capex.
| Metric | Value |
|---|---|
| EAF share | ≈33% (2024) |
| EU BEV | ≈22% (2024) |
| Fab spend | $85bn (2024) |
| USD/JPY | ≈155 (mid‑2025) |
Same Document Delivered
Tokai Carbon PESTLE Analysis
This Tokai Carbon PESTLE Analysis preview is the exact, fully formatted document you’ll receive after purchase—comprehensive, current, and ready to use. It contains the same structure, insights, and charts shown here with no placeholders or edits. After checkout you’ll instantly download this finished file and can apply the strategic findings immediately.
Description
Make Smarter Strategic Decisions with a Complete PESTEL View
Our PESTLE Analysis of Tokai Carbon reveals how political shifts, commodity cycles, and cleantech trends are reshaping its markets and margins. Designed for investors and strategists, it highlights regulatory and environmental risks plus emergent opportunities. Purchase the full report to get actionable insights and ready-to-use, editable deliverables.
Political factors
Trade tariffs and geopolitics
Tariff and non‑tariff barriers across US‑China‑EU corridors — including US Section 301 tariffs of up to 25% and the EU Carbon Border Adjustment Mechanism (transitional since 2023) — raise risks for carbon black, graphite electrodes and specialty graphite. Geopolitical tensions can disrupt needle coke, coal tar pitch and petroleum feedstock flows, impacting supply continuity. Tokai Carbon may need to diversify sourcing and build regional redundancy; strategic stockpiles and dual‑sourcing contracts can mitigate shocks.
Export controls on advanced materials
High-purity graphite and semiconductor-grade components are increasingly subject to export licenses as Japan, the US and EU tighten dual-use controls. The US CHIPS Act allocates $52.7 billion to bolster domestic semiconductor capacity, increasing regulatory scrutiny on supply chains. Compliance can add weeks to lead times and limit addressable markets, so early screening and compliance-by-design reduce disruption and legal risk.
Industrial policy and subsidies
US Inflation Reduction Act mobilizes roughly $369 billion in clean energy incentives, while the EU Net-Zero Industry Act pushes faster permitting and scaling of strategic net-zero tech toward 2030, and Japan has reoriented subsidies to onshore EV, semiconductor and steel supply chains. Localization pressures may drive Tokai Carbon to co-locate capacity near subsidized steel, EV and chip projects. Accessing grants can materially reduce capex for furnace and purification upgrades, so policy shifts force agile, rephased capex planning.
Energy and carbon policy direction
- Policy impact: higher scrutiny and cost on calcination
- Japan targets: 46% by 2030, net-zero 2050
- Carbon price signal: EU ETS ~€90–100/t (2024)
- Mitigants: renewables tariffs, green H2 pilots, long-term PPAs
Sanctions and country risk
Sanctions on specific regions constrain raw-material logistics and customer access, tightening supply of specialty carbon feedstocks and limiting market reach. Maritime insurance and rerouting have raised freight costs (high-risk-route premiums climbed ~40% in 2023–24), pressuring margins. Tokai Carbon must monitor counterparty exposure, reroute supply chains and use political risk insurance and contractual clauses as buffers.
- Sanctions → supply/customer constraints
- Insurance/routing → freight +~40% (2023–24)
- Counterparty exposure monitoring
- Political risk insurance & contracts
Policy shocks force graphite supply chain regionalization; EU ETS, CHIPS, IRA raise costs
Tariffs, export controls and sanctions raise costs and restrict markets for carbon black, electrodes and high‑purity graphite, forcing regionalization and dual sourcing. EU ETS prices (~€90–100/t in 2024) and Japan GHG targets (46% by 2030, net‑zero 2050) increase calcination input costs. US CHIPS ($52.7bn) and IRA (~$369bn) drive localization and subsidy opportunities; freight premiums rose ~40% (2023–24).
| Risk/Policy | Metric/Value |
|---|---|
| EU ETS (2024) | €90–100/t |
| Japan target | 46% by 2030; net‑zero 2050 |
| US CHIPS | $52.7bn |
| IRA | $369bn |
| Freight premium | +~40% (2023–24) |
What is included in the product
Detailed Word Document
Explores how macro-environmental factors uniquely affect Tokai Carbon across Political, Economic, Social, Technological, Environmental and Legal dimensions, combining data-driven trends and region-specific regulatory context to identify risks and opportunities. Designed for executives and investors, it offers detailed sub-points, forward-looking scenario insights and clean formatting for reports and decks.
Customizable Excel Spreadsheet
A clean, summarized Tokai Carbon PESTLE that’s visually segmented by PESTEL categories for quick interpretation and meeting-ready slides, allowing users to add notes specific to regions or business lines for fast team alignment.
Economic factors
Steel cycle sensitivity
Graphite electrode demand closely mirrors electric arc furnace utilization, with EAF share of global steelmaking rising to about one-third by 2024 (≈33% per World Steel Association), so downcycles compress volumes and pricing while upcycles strain capacity and lift margins.
Tokai Carbon mitigates swings through inventory discipline and flexible production, and multi-year offtakes (commonly 1–3 years) help smooth cash flows and reduce spot exposure.
Auto and tire demand
Carbon black and friction-material demand tracks vehicle production and replacement tires; replacement tires account for roughly 60% of global tire volumes, cushioning OEM volatility. Rising EV mix—EU BEV share about 22% in 2024—boosts demand for specialty grades and low-rolling-resistance compounds. Aftermarket resilience helps offset OEM swings, while price-indexed contracts largely pass through feedstock cost movements.
Semiconductor capital cycle
Specialty graphite for wafers, epitaxy and high-temp fixtures at Tokai Carbon moves with wafer-fab capex; global fab-equipment spending rose about 12% in 2024 to roughly $85bn (SEMI), supporting demand for high-purity components. AI-driven capacity builds (notably HPC logic and foundry) add structural tailwinds for ultra-high-purity graphite and epitaxy susceptor parts. Order visibility remains lumpy quarter-to-quarter, but multi-stage vendor qualification raises customer stickiness and pricing leverage. Tokai Carbon’s balanced end-market mix limits single-cycle exposure and smooths revenue swings.
Feedstock and energy costs
FX and interest rates
Yen volatility (USD/JPY around 155 in mid-2025) drives translation swings and export pricing for Japan-headquartered Tokai Carbon, while global rate cycles (US fed funds ~5.25–5.50% in 2024–25; BoJ policy back near 0–0.5%) affect capex affordability and customer investment timing. Local production and invoicing alignment provide natural hedges; prudent leverage preserves flexibility in downturns.
- FX exposure: USD/JPY ≈155 (mid‑2025)
- Rates: Fed ≈5.25–5.50%, BoJ ≈0–0.5%
- Risk mitigant: local production & currency alignment
- Balance sheet: prudent leverage maintains optionality
Policy shocks force graphite supply chain regionalization; EU ETS, CHIPS, IRA raise costs
EAF share ~33% (2024) ties graphite electrode demand to steel cycles, while Tokai uses offtakes and flexible production to dampen spot swings. EV rise (EU BEV ~22% 2024) and fab capex ($85bn 2024) lift specialty graphite demand. Feedstock (needle coke, pitch) and power drive COGS; USD/JPY ≈155 (mid‑2025) and Fed ~5.25–5.50% affect margins and capex.
| Metric | Value |
|---|---|
| EAF share | ≈33% (2024) |
| EU BEV | ≈22% (2024) |
| Fab spend | $85bn (2024) |
| USD/JPY | ≈155 (mid‑2025) |
Same Document Delivered
Tokai Carbon PESTLE Analysis
This Tokai Carbon PESTLE Analysis preview is the exact, fully formatted document you’ll receive after purchase—comprehensive, current, and ready to use. It contains the same structure, insights, and charts shown here with no placeholders or edits. After checkout you’ll instantly download this finished file and can apply the strategic findings immediately.











