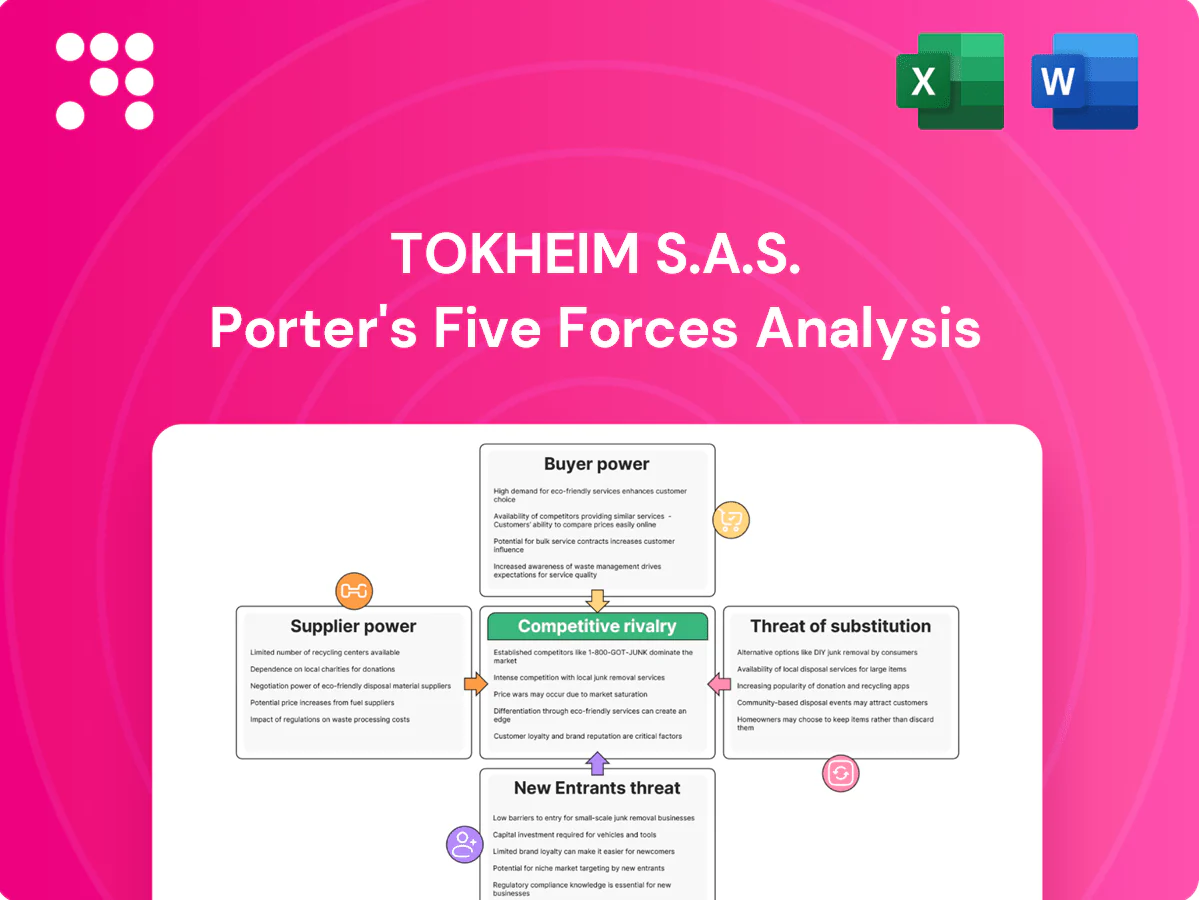
Tokheim S.A.S. Porter's Five Forces Analysis

Go Beyond the Preview—Access the Full Strategic Report
Tokheim S.A.S. faces mixed competitive pressures—strong supplier relationships, moderate buyer power, and rising substitute and technological threats shaping margin pressure and market positioning. Strategic responses will hinge on innovation, scale, and channel control to protect share and pricing. This brief snapshot only scratches the surface; unlock the full Porter's Five Forces Analysis for force-by-force ratings, visuals, and actionable strategy.
Suppliers Bargaining Power

Specialized component concentration
Core dispenser elements—meters, valves, nozzles and explosion‑proof enclosures—are sourced from a narrow pool of certified suppliers, giving those suppliers pricing and lead‑time leverage. Tokheim reduces exposure through dual‑sourcing where standards allow, but lengthy qualification cycles limit flexibility. Any supplier disruption can cascade into assembly bottlenecks, production delays and project slippage.
Certified payments and electronics
EMV/PCI-certified terminals, secure controllers and certified boards shrink suppliers for Tokheim, with EMV/PCI certification cycles in 2024 commonly spanning 3–12 months and lab fees plus integration often totaling USD 100k–500k, driving dependence on select electronics partners; suppliers can pace product roadmaps via certification timing, and switching vendors triggers costly revalidation and field recertification cycles.

Commodity and semiconductor exposure
Steel (~$700/t avg HRC in 2024), copper (~$8,700/t avg 2024) resins and semiconductors drive Tokheim BOM costs and availability; global semiconductor market revenue rose ~8% in 2024 to about $602B, keeping chip volatility high. Chip and power-electronics swings have produced double-digit input-cost and lead-time shocks that compress margins and delay deliveries. Long-term purchase agreements and inventory buffers mitigate shortages but lock up working capital and cost pass-through in competitive bids is often infeasible.

Aftermarket parts and service inputs
OEM-approved parts, seals and metering kits are mandatory for safety and warranty, and 2024 industry reports show OEM mandates materially extend lead times and service costs. Certified technician availability and vendor-controlled training materials concentrate knowledge with select suppliers, letting them set pricing and certification cadence. Suppliers can prioritize parts allocation, slowing response for non-preferred customers; downtime-sensitive retailers face heightened risk and leverage.
- OEM parts required — increases cost and lead time
- Certified techs depend on vendors — centralizes expertise
- Parts prioritization — affects responsiveness
- Downtime-sensitive customers — amplify supplier leverage
Regulatory qualification and switching costs
ATEX, IECEx and UL approvals are mandatory for hazardous-location fuel equipment and require formal type-testing, technical documentation and notified-body or NRTL audits, which routinely extend vendor changes into multi-month timelines and can span full product lifecycles of 5–15 years.
That requalification friction locks in suppliers and gives them leverage to resist aggressive cost-downs.
- certification scope: ATEX/IECEx/UL
- requalification timeline: multi-months to years
- typical lifecycle lock-in: 5–15 years
- supplier leverage: reduced price elasticity
Few certified vendors give pricing leverage; EMV cycles 3-12 months, BOM volatility high
Certified dispenser and electronics vendors are few, giving pricing and lead‑time leverage; EMV/PCI cycles commonly 3–12 months with lab/integration costs USD 100k–500k. Input costs (HRC steel ~USD 700/t, copper ~USD 8,700/t) and semiconductor market (~USD 602B in 2024, +8%) keep BOM volatility high. ATEX/UL requalification (5–15y lifecycles) locks suppliers in.
| Metric | 2024 Value |
|---|---|
| EMV/PCI cert time | 3–12 months |
| EMV lab/integration | USD 100k–500k |
| HRC steel | ~USD 700/t |
| Semiconductor market | ~USD 602B (+8%) |
| Lifecycle lock-in | 5–15 years |
What is included in the product
 Detailed Word Document
Uncovers key drivers of competition, customer influence, and market entry risks tailored to Tokheim S.A.S.; evaluates supplier and buyer power, threat of substitutes, and competitive rivalry to highlight strategic vulnerabilities and protective dynamics.

 Customizable Excel Spreadsheet
Clear one-sheet Porter's Five Forces for Tokheim S.A.S.—instantly highlight supplier, buyer, rivalry, new entrants and substitute pressures to guide strategic moves and relieve decision-making pain.
Customers Bargaining Power

Consolidated fuel retailers
Consolidated fuel retailers—notably oil majors and large hypermarket chains—buy at scale, with oil companies and integrated retailers operating tens of thousands of sites globally and roughly 2 million fuel retail outlets worldwide (Statista 2023). Centralized procurement frequently runs competitive tenders that extract volume-driven discounts and favorable payment and supply terms. Volume commitments from these buyers can reallocate regional capacity and give them high bargaining power, amplified in multi-country frameworks.
RFPs and TCO focus
Buyers drive procurement through standardized RFPs and TCO metrics, with 60-75% of fuel retail procurement explicitly weighting uptime, energy use, calibration drift and service costs in 2024; this narrows differentiation to measurable specs and price. Value-add software must demonstrably deliver ROI—otherwise it is treated as commoditized—and downward pressure on hardware margins persists even when services are bundled.

Service and SLA leverage
Uptime SLAs (commonly 99.5–99.9% in 2024 benchmarks) and response-time targets (typically 2–24 hours) plus penalty clauses (often 5–15% of monthly service fees) are central to Tokheim service contracts. Buyers increasingly secure multi-year service bundles to reduce lifecycle costs by roughly 8–12% per 2024 supplier reports. Missed KPIs trigger rebates or contract termination, shifting bargaining power to customers at renewal.

Global footprint and localization
Multinationals in 2024 demand consistent platforms that support local compliance, languages and payment variants, driving Tokheim to deliver configurable solutions.
Vendors must customize implementations while keeping common architectures to control R&D and integration costs across regions.
Buyers use global standardization to secure volume pricing and will switch local distributors if service or compliance lags.
- global consistency vs local compliance
- common architecture with configurable modules
- volume-based negotiation leverage
- performance-based distributor switching
Alternative qualified vendors
Competing global brands and strong regional vendors give buyers multiple options, with approved vendor lists commonly including several OEMs; site refresh cycles typically run 8–12 years, making switching costs present but manageable, which increases buyer negotiating power.
- Multiple OEMs on approvals
- 8–12 year site refresh cycle
- Manageable switching costs
- Higher buyer leverage
Buyers lead: centralized RFPs in ≈2,000,000; TCO 60–75%
Large consolidated retailers and oil majors (≈2 million outlets globally, Statista 2023) wield strong volume leverage, driving centralized RFPs and 60–75% procurement weighting on uptime/TCO (2024). SLAs (99.5–99.9%) and penalties (5–15%) shift power to buyers; multi-year bundles cut lifecycle costs ~8–12% and 8–12-year refresh cycles make switching manageable.
| Metric | 2023/24 Value |
|---|---|
| Global outlets | ≈2,000,000 |
| Procurement TCO weighting | 60–75% |
| SLA targets | 99.5–99.9% |
| Penalty clauses | 5–15% |
| Lifecycle saving | 8–12% |
| Site refresh | 8–12 yrs |
Full Version Awaits
Tokheim S.A.S. Porter's Five Forces Analysis
This preview shows the exact Porter's Five Forces analysis of Tokheim S.A.S. you'll receive immediately after purchase—no placeholders or samples. The document is fully formatted, professionally written and ready for immediate download and use. What you see here is precisely the deliverable available to you upon completion of payment.

Go Beyond the Preview—Access the Full Strategic Report
Tokheim S.A.S. faces mixed competitive pressures—strong supplier relationships, moderate buyer power, and rising substitute and technological threats shaping margin pressure and market positioning. Strategic responses will hinge on innovation, scale, and channel control to protect share and pricing. This brief snapshot only scratches the surface; unlock the full Porter's Five Forces Analysis for force-by-force ratings, visuals, and actionable strategy.
Suppliers Bargaining Power
Specialized component concentration
Core dispenser elements—meters, valves, nozzles and explosion‑proof enclosures—are sourced from a narrow pool of certified suppliers, giving those suppliers pricing and lead‑time leverage. Tokheim reduces exposure through dual‑sourcing where standards allow, but lengthy qualification cycles limit flexibility. Any supplier disruption can cascade into assembly bottlenecks, production delays and project slippage.
Certified payments and electronics
EMV/PCI-certified terminals, secure controllers and certified boards shrink suppliers for Tokheim, with EMV/PCI certification cycles in 2024 commonly spanning 3–12 months and lab fees plus integration often totaling USD 100k–500k, driving dependence on select electronics partners; suppliers can pace product roadmaps via certification timing, and switching vendors triggers costly revalidation and field recertification cycles.
Commodity and semiconductor exposure
Steel (~$700/t avg HRC in 2024), copper (~$8,700/t avg 2024) resins and semiconductors drive Tokheim BOM costs and availability; global semiconductor market revenue rose ~8% in 2024 to about $602B, keeping chip volatility high. Chip and power-electronics swings have produced double-digit input-cost and lead-time shocks that compress margins and delay deliveries. Long-term purchase agreements and inventory buffers mitigate shortages but lock up working capital and cost pass-through in competitive bids is often infeasible.
Aftermarket parts and service inputs
OEM-approved parts, seals and metering kits are mandatory for safety and warranty, and 2024 industry reports show OEM mandates materially extend lead times and service costs. Certified technician availability and vendor-controlled training materials concentrate knowledge with select suppliers, letting them set pricing and certification cadence. Suppliers can prioritize parts allocation, slowing response for non-preferred customers; downtime-sensitive retailers face heightened risk and leverage.
- OEM parts required — increases cost and lead time
- Certified techs depend on vendors — centralizes expertise
- Parts prioritization — affects responsiveness
- Downtime-sensitive customers — amplify supplier leverage
Regulatory qualification and switching costs
ATEX, IECEx and UL approvals are mandatory for hazardous-location fuel equipment and require formal type-testing, technical documentation and notified-body or NRTL audits, which routinely extend vendor changes into multi-month timelines and can span full product lifecycles of 5–15 years.
That requalification friction locks in suppliers and gives them leverage to resist aggressive cost-downs.
- certification scope: ATEX/IECEx/UL
- requalification timeline: multi-months to years
- typical lifecycle lock-in: 5–15 years
- supplier leverage: reduced price elasticity
Few certified vendors give pricing leverage; EMV cycles 3-12 months, BOM volatility high
Certified dispenser and electronics vendors are few, giving pricing and lead‑time leverage; EMV/PCI cycles commonly 3–12 months with lab/integration costs USD 100k–500k. Input costs (HRC steel ~USD 700/t, copper ~USD 8,700/t) and semiconductor market (~USD 602B in 2024, +8%) keep BOM volatility high. ATEX/UL requalification (5–15y lifecycles) locks suppliers in.
| Metric | 2024 Value |
|---|---|
| EMV/PCI cert time | 3–12 months |
| EMV lab/integration | USD 100k–500k |
| HRC steel | ~USD 700/t |
| Semiconductor market | ~USD 602B (+8%) |
| Lifecycle lock-in | 5–15 years |
What is included in the product
Detailed Word Document
Uncovers key drivers of competition, customer influence, and market entry risks tailored to Tokheim S.A.S.; evaluates supplier and buyer power, threat of substitutes, and competitive rivalry to highlight strategic vulnerabilities and protective dynamics.
Customizable Excel Spreadsheet
Clear one-sheet Porter's Five Forces for Tokheim S.A.S.—instantly highlight supplier, buyer, rivalry, new entrants and substitute pressures to guide strategic moves and relieve decision-making pain.
Customers Bargaining Power
Consolidated fuel retailers
Consolidated fuel retailers—notably oil majors and large hypermarket chains—buy at scale, with oil companies and integrated retailers operating tens of thousands of sites globally and roughly 2 million fuel retail outlets worldwide (Statista 2023). Centralized procurement frequently runs competitive tenders that extract volume-driven discounts and favorable payment and supply terms. Volume commitments from these buyers can reallocate regional capacity and give them high bargaining power, amplified in multi-country frameworks.
RFPs and TCO focus
Buyers drive procurement through standardized RFPs and TCO metrics, with 60-75% of fuel retail procurement explicitly weighting uptime, energy use, calibration drift and service costs in 2024; this narrows differentiation to measurable specs and price. Value-add software must demonstrably deliver ROI—otherwise it is treated as commoditized—and downward pressure on hardware margins persists even when services are bundled.
Service and SLA leverage
Uptime SLAs (commonly 99.5–99.9% in 2024 benchmarks) and response-time targets (typically 2–24 hours) plus penalty clauses (often 5–15% of monthly service fees) are central to Tokheim service contracts. Buyers increasingly secure multi-year service bundles to reduce lifecycle costs by roughly 8–12% per 2024 supplier reports. Missed KPIs trigger rebates or contract termination, shifting bargaining power to customers at renewal.
Global footprint and localization
Multinationals in 2024 demand consistent platforms that support local compliance, languages and payment variants, driving Tokheim to deliver configurable solutions.
Vendors must customize implementations while keeping common architectures to control R&D and integration costs across regions.
Buyers use global standardization to secure volume pricing and will switch local distributors if service or compliance lags.
- global consistency vs local compliance
- common architecture with configurable modules
- volume-based negotiation leverage
- performance-based distributor switching
Alternative qualified vendors
Competing global brands and strong regional vendors give buyers multiple options, with approved vendor lists commonly including several OEMs; site refresh cycles typically run 8–12 years, making switching costs present but manageable, which increases buyer negotiating power.
- Multiple OEMs on approvals
- 8–12 year site refresh cycle
- Manageable switching costs
- Higher buyer leverage
Buyers lead: centralized RFPs in ≈2,000,000; TCO 60–75%
Large consolidated retailers and oil majors (≈2 million outlets globally, Statista 2023) wield strong volume leverage, driving centralized RFPs and 60–75% procurement weighting on uptime/TCO (2024). SLAs (99.5–99.9%) and penalties (5–15%) shift power to buyers; multi-year bundles cut lifecycle costs ~8–12% and 8–12-year refresh cycles make switching manageable.
| Metric | 2023/24 Value |
|---|---|
| Global outlets | ≈2,000,000 |
| Procurement TCO weighting | 60–75% |
| SLA targets | 99.5–99.9% |
| Penalty clauses | 5–15% |
| Lifecycle saving | 8–12% |
| Site refresh | 8–12 yrs |
Full Version Awaits
Tokheim S.A.S. Porter's Five Forces Analysis
This preview shows the exact Porter's Five Forces analysis of Tokheim S.A.S. you'll receive immediately after purchase—no placeholders or samples. The document is fully formatted, professionally written and ready for immediate download and use. What you see here is precisely the deliverable available to you upon completion of payment.
Description
Go Beyond the Preview—Access the Full Strategic Report
Tokheim S.A.S. faces mixed competitive pressures—strong supplier relationships, moderate buyer power, and rising substitute and technological threats shaping margin pressure and market positioning. Strategic responses will hinge on innovation, scale, and channel control to protect share and pricing. This brief snapshot only scratches the surface; unlock the full Porter's Five Forces Analysis for force-by-force ratings, visuals, and actionable strategy.
Suppliers Bargaining Power
Specialized component concentration
Core dispenser elements—meters, valves, nozzles and explosion‑proof enclosures—are sourced from a narrow pool of certified suppliers, giving those suppliers pricing and lead‑time leverage. Tokheim reduces exposure through dual‑sourcing where standards allow, but lengthy qualification cycles limit flexibility. Any supplier disruption can cascade into assembly bottlenecks, production delays and project slippage.
Certified payments and electronics
EMV/PCI-certified terminals, secure controllers and certified boards shrink suppliers for Tokheim, with EMV/PCI certification cycles in 2024 commonly spanning 3–12 months and lab fees plus integration often totaling USD 100k–500k, driving dependence on select electronics partners; suppliers can pace product roadmaps via certification timing, and switching vendors triggers costly revalidation and field recertification cycles.
Commodity and semiconductor exposure
Steel (~$700/t avg HRC in 2024), copper (~$8,700/t avg 2024) resins and semiconductors drive Tokheim BOM costs and availability; global semiconductor market revenue rose ~8% in 2024 to about $602B, keeping chip volatility high. Chip and power-electronics swings have produced double-digit input-cost and lead-time shocks that compress margins and delay deliveries. Long-term purchase agreements and inventory buffers mitigate shortages but lock up working capital and cost pass-through in competitive bids is often infeasible.
Aftermarket parts and service inputs
OEM-approved parts, seals and metering kits are mandatory for safety and warranty, and 2024 industry reports show OEM mandates materially extend lead times and service costs. Certified technician availability and vendor-controlled training materials concentrate knowledge with select suppliers, letting them set pricing and certification cadence. Suppliers can prioritize parts allocation, slowing response for non-preferred customers; downtime-sensitive retailers face heightened risk and leverage.
- OEM parts required — increases cost and lead time
- Certified techs depend on vendors — centralizes expertise
- Parts prioritization — affects responsiveness
- Downtime-sensitive customers — amplify supplier leverage
Regulatory qualification and switching costs
ATEX, IECEx and UL approvals are mandatory for hazardous-location fuel equipment and require formal type-testing, technical documentation and notified-body or NRTL audits, which routinely extend vendor changes into multi-month timelines and can span full product lifecycles of 5–15 years.
That requalification friction locks in suppliers and gives them leverage to resist aggressive cost-downs.
- certification scope: ATEX/IECEx/UL
- requalification timeline: multi-months to years
- typical lifecycle lock-in: 5–15 years
- supplier leverage: reduced price elasticity
Few certified vendors give pricing leverage; EMV cycles 3-12 months, BOM volatility high
Certified dispenser and electronics vendors are few, giving pricing and lead‑time leverage; EMV/PCI cycles commonly 3–12 months with lab/integration costs USD 100k–500k. Input costs (HRC steel ~USD 700/t, copper ~USD 8,700/t) and semiconductor market (~USD 602B in 2024, +8%) keep BOM volatility high. ATEX/UL requalification (5–15y lifecycles) locks suppliers in.
| Metric | 2024 Value |
|---|---|
| EMV/PCI cert time | 3–12 months |
| EMV lab/integration | USD 100k–500k |
| HRC steel | ~USD 700/t |
| Semiconductor market | ~USD 602B (+8%) |
| Lifecycle lock-in | 5–15 years |
What is included in the product
Detailed Word Document
Uncovers key drivers of competition, customer influence, and market entry risks tailored to Tokheim S.A.S.; evaluates supplier and buyer power, threat of substitutes, and competitive rivalry to highlight strategic vulnerabilities and protective dynamics.
Customizable Excel Spreadsheet
Clear one-sheet Porter's Five Forces for Tokheim S.A.S.—instantly highlight supplier, buyer, rivalry, new entrants and substitute pressures to guide strategic moves and relieve decision-making pain.
Customers Bargaining Power
Consolidated fuel retailers
Consolidated fuel retailers—notably oil majors and large hypermarket chains—buy at scale, with oil companies and integrated retailers operating tens of thousands of sites globally and roughly 2 million fuel retail outlets worldwide (Statista 2023). Centralized procurement frequently runs competitive tenders that extract volume-driven discounts and favorable payment and supply terms. Volume commitments from these buyers can reallocate regional capacity and give them high bargaining power, amplified in multi-country frameworks.
RFPs and TCO focus
Buyers drive procurement through standardized RFPs and TCO metrics, with 60-75% of fuel retail procurement explicitly weighting uptime, energy use, calibration drift and service costs in 2024; this narrows differentiation to measurable specs and price. Value-add software must demonstrably deliver ROI—otherwise it is treated as commoditized—and downward pressure on hardware margins persists even when services are bundled.
Service and SLA leverage
Uptime SLAs (commonly 99.5–99.9% in 2024 benchmarks) and response-time targets (typically 2–24 hours) plus penalty clauses (often 5–15% of monthly service fees) are central to Tokheim service contracts. Buyers increasingly secure multi-year service bundles to reduce lifecycle costs by roughly 8–12% per 2024 supplier reports. Missed KPIs trigger rebates or contract termination, shifting bargaining power to customers at renewal.
Global footprint and localization
Multinationals in 2024 demand consistent platforms that support local compliance, languages and payment variants, driving Tokheim to deliver configurable solutions.
Vendors must customize implementations while keeping common architectures to control R&D and integration costs across regions.
Buyers use global standardization to secure volume pricing and will switch local distributors if service or compliance lags.
- global consistency vs local compliance
- common architecture with configurable modules
- volume-based negotiation leverage
- performance-based distributor switching
Alternative qualified vendors
Competing global brands and strong regional vendors give buyers multiple options, with approved vendor lists commonly including several OEMs; site refresh cycles typically run 8–12 years, making switching costs present but manageable, which increases buyer negotiating power.
- Multiple OEMs on approvals
- 8–12 year site refresh cycle
- Manageable switching costs
- Higher buyer leverage
Buyers lead: centralized RFPs in ≈2,000,000; TCO 60–75%
Large consolidated retailers and oil majors (≈2 million outlets globally, Statista 2023) wield strong volume leverage, driving centralized RFPs and 60–75% procurement weighting on uptime/TCO (2024). SLAs (99.5–99.9%) and penalties (5–15%) shift power to buyers; multi-year bundles cut lifecycle costs ~8–12% and 8–12-year refresh cycles make switching manageable.
| Metric | 2023/24 Value |
|---|---|
| Global outlets | ≈2,000,000 |
| Procurement TCO weighting | 60–75% |
| SLA targets | 99.5–99.9% |
| Penalty clauses | 5–15% |
| Lifecycle saving | 8–12% |
| Site refresh | 8–12 yrs |
Full Version Awaits
Tokheim S.A.S. Porter's Five Forces Analysis
This preview shows the exact Porter's Five Forces analysis of Tokheim S.A.S. you'll receive immediately after purchase—no placeholders or samples. The document is fully formatted, professionally written and ready for immediate download and use. What you see here is precisely the deliverable available to you upon completion of payment.











