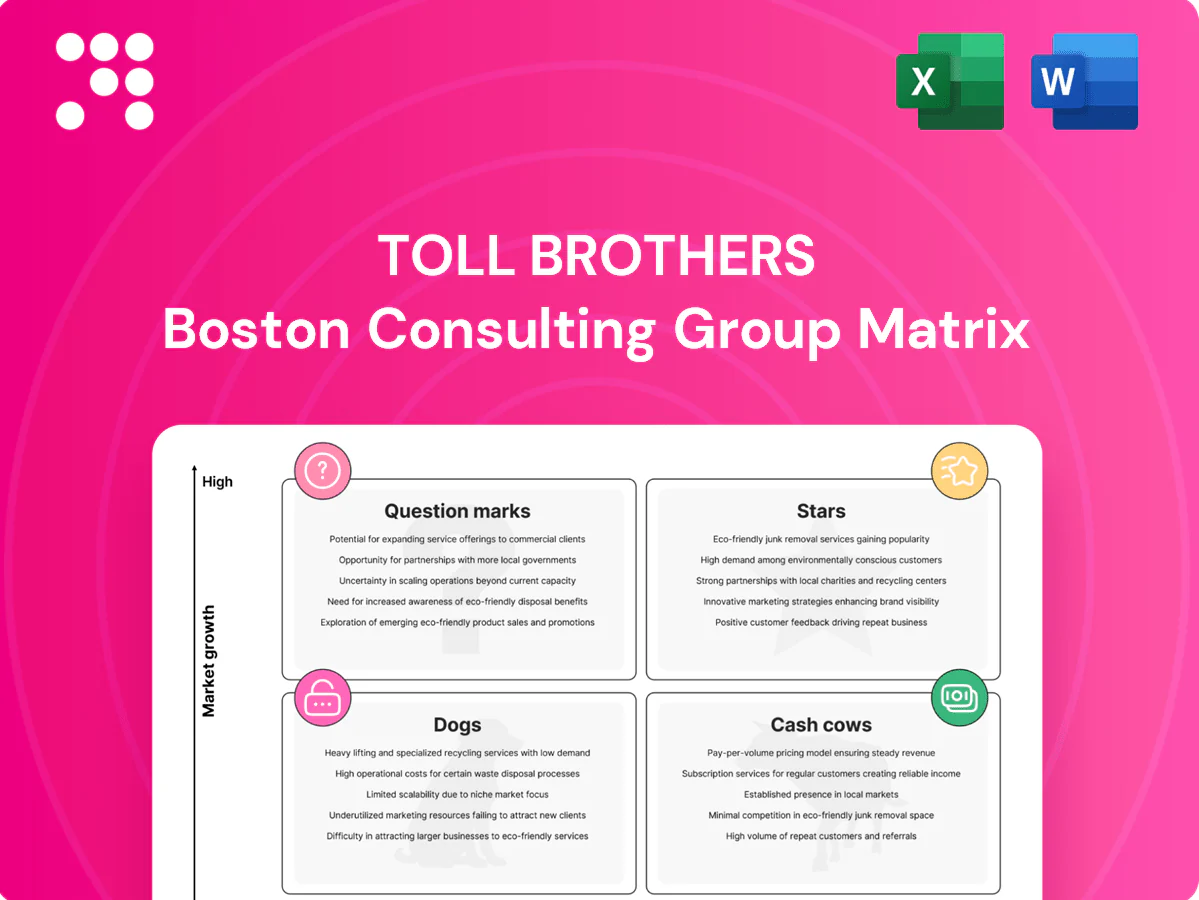
Toll Brothers Boston Consulting Group Matrix

See the Bigger Picture
Curious how Toll Brothers’ product lines stack up—stars driving growth, cash cows funding expansion, or question marks needing choices? This quick peek hints at where revenue and risk live; the full BCG Matrix gives quadrant-by-quadrant clarity, actionable strategy, and the data you can actually use. Purchase the complete report for a detailed Word narrative plus an Excel summary, ready to present and act on. Get the full picture and stop guessing—make smarter capital and product decisions now.
Stars

Luxury single‑family communities in high‑growth Sun Belt
Fast household formation and inbound migration keep Sun Belt markets hot; the region drove roughly two-thirds of U.S. population growth from 2020–2023 (Census Bureau), and Toll Brothers is a clear luxury category leader there. High absorption at premium price points drives visibility and faster turns, but these projects consume cash for land, labor, and sales centers. Continue smart land buys and targeted marketing to sustain share. Hold share now, harvest later as growth normalizes.
Design‑to‑order premium upgrades & personalization
Buyers in the luxury tier demand choice and Toll Brothers design studios are the showpiece, with take‑rates reported around 70% and option margins roughly 30–40%, materially boosting per‑home profitability. The experience locks in brand leadership and drives repeat/lifetime value, but sustaining this Star requires ongoing investment in merchandising, AR/VR visualization and staffing. Protect the edge: this is where Star cash is minted.

Resort‑style master‑planned communities
Amenity‑rich, gated, lifestyle‑heavy master‑planned communities are Stars in Toll Brothers’ BCG matrix, concentrated in fast‑growing nodes with strong waitlists in 2024. Toll’s premium brand captures top‑of‑market demand, giving the company share gains and pricing power. Upfront capital needs and long entitlement cycles keep cash intensity elevated. As phases open, scale and the moat deepen, improving returns over time.

Active adult (55+) luxury segments in growth metros
Active adult (55+) luxury in growth metros is a Star: demographic tailwinds as Census projects 65+ to approach 20% of the US population by 2030, and Toll’s premium‑credible positioning drives steady sell‑through and healthy option dollars per home. Success requires ongoing amenity capex and targeted marketing to sustain velocity; keep leaning in as the cohort swells.
- Demographics: 65+ ~20% by 2030
- Positioning: premium credibility
- Economics: steady sell‑through, strong option dollars
- Needs: amenity investment, targeted marketing
Digital lead gen + onsite sales engine
Digital lead gen plus onsite sales ops give Toll Brothers sustained share in an expanding luxury market. Conversion rates and price integrity signal leadership; 2024 backlog around $11B underpins scale and pricing power. Continuous spend in media, CRM, and content is required to maintain momentum; investment pays back and compounds via higher LTV and faster turnover.
- Strong brand + ops = sustained share
- 2024 backlog ~11B; pricing integrity
- High conversion rates = leadership trait
- Continuous media/CRM/content spend required
- Spend compounds into higher LTV
Sun Belt luxury: option margins 30-40%, backlog ~$11B - invest in design, digital, amenities
Stars: Sun Belt luxury, amenity‑rich masterplans and 55+ communities drive high absorption, option margins 30–40% and 2024 backlog ~$11B, supporting pricing power; cash intensity high for land/entitlements. Invest in design studios, digital lead gen and amenities to protect moat and sustain returns as growth normalizes.
| Metric | Value |
|---|---|
| 2024 backlog | ~$11B |
| Option margins | 30–40% |
| Sun Belt pop growth 2020–23 | ~2/3 US growth (Census) |
| 65+ share by 2030 | ~20% |
What is included in the product
 Detailed Word Document
BCG review of Toll Brothers’ divisions, mapping Stars, Cash Cows, Question Marks, Dogs with clear invest, hold, divest guidance.

 Customizable Excel Spreadsheet
One-page Toll Brothers BCG Matrix neatly maps each business unit to a quadrant, easing portfolio pain points for quick C-suite decisions
Cash Cows

Established Northeast & Mid‑Atlantic luxury communities
Mature, supply‑constrained Northeast and Mid‑Atlantic suburbs with Toll name recognition function as cash cows—lower growth but sticky pricing and predictable closings. Marketing spend is modest and operations repeatable, supporting margins on homes with average selling prices above $1M in 2024. These communities generate steady cash flow to fund growth while maintaining service levels.
In‑house mortgage (Toll Brothers Mortgage Company)
In-house Toll Brothers Mortgage drives high attach rates and recurring fee income, giving Toll better control of the buyer journey and ancillary revenue; Toll reported a homebuilding backlog of about $9.5B in 2024, anchoring steady franchise performance in mature communities. Volume ebbs with interest-rate cycles, but low incremental marketing and process improvements flow straight to the bottom line. Continue optimizing underwriting and cross-sell to lift margins.

Title and property insurance services
Title and property insurance services are ancillary, high‑margin, low‑growth—classic cash cow for Toll Brothers, generating steady fee income while requiring minimal promotional spend. The builder-captive funnel keeps utilization near 100% from new-home closings in 2024, supporting operational excellence and low customer acquisition cost. Proceeds are redeployed into land acquisitions and option deposits to fund growth bets.

Options catalog staples (cabinets, fixtures, flooring tiers)
Options catalog staples (cabinets, fixtures, flooring tiers) are BCG cash cows for Toll Brothers in 2024, delivering reliable take‑rates and streamlined install processes; supply relationships and standardized SKUs keep costs tight. Growth is muted while margins remain healthy, so maintain SKU depth and avoid over‑engineering.
- Category: Cash Cows
- Strength: Standardized SKUs
- Action: Preserve SKUs, limit customization
Brand equity and referrals in core enclaves
Decades of building in affluent ZIP codes give Toll Brothers brand equity that turns trust into sales, cutting customer acquisition costs and reducing need for promotions; average new-home ASP exceeds $1,000,000, anchoring high margins and steady cash flow. This is not a high-growth lever but a dependable profit engine with consistent community traffic and lower incentives. Guarding reputation preserves repeat/referral volumes and free marketing, so bank the cash.
- Brand: strong in luxury enclaves
- Cost: lower CAC, fewer incentives
- Margins: ASP > $1M supports higher margins
- Role: cash cow, steady profits not growth
NE/Mid-Atlantic suburbs: $9.5B backlog, $1M+ ASP
Mature Northeast/Mid‑Atlantic suburbs act as cash cows for Toll Brothers in 2024—sticky pricing, predictable closings and modest marketing preserve margins. Homebuilding backlog ~ $9.5B in 2024 and average selling price > $1M anchor steady cash flow. In‑house mortgage, title and options deliver recurring, low‑growth fee income redeployed into land and deposits.
| Metric | 2024 |
|---|---|
| Homebuilding backlog | $9.5B |
| Avg. selling price (ASP) | > $1M |
| Marketing | Modest |
What You See Is What You Get
Toll Brothers BCG Matrix
The file you're previewing is the exact Toll Brothers BCG Matrix you'll receive after purchase. No watermarks, no demo content—just a fully formatted, strategy-ready report built for clear decision-making. Buy once and download immediately; it's editable, print-ready, and presentation-polished. What you see is what you'll get—no surprises, no extra steps.

See the Bigger Picture
Curious how Toll Brothers’ product lines stack up—stars driving growth, cash cows funding expansion, or question marks needing choices? This quick peek hints at where revenue and risk live; the full BCG Matrix gives quadrant-by-quadrant clarity, actionable strategy, and the data you can actually use. Purchase the complete report for a detailed Word narrative plus an Excel summary, ready to present and act on. Get the full picture and stop guessing—make smarter capital and product decisions now.
Stars
Luxury single‑family communities in high‑growth Sun Belt
Fast household formation and inbound migration keep Sun Belt markets hot; the region drove roughly two-thirds of U.S. population growth from 2020–2023 (Census Bureau), and Toll Brothers is a clear luxury category leader there. High absorption at premium price points drives visibility and faster turns, but these projects consume cash for land, labor, and sales centers. Continue smart land buys and targeted marketing to sustain share. Hold share now, harvest later as growth normalizes.
Design‑to‑order premium upgrades & personalization
Buyers in the luxury tier demand choice and Toll Brothers design studios are the showpiece, with take‑rates reported around 70% and option margins roughly 30–40%, materially boosting per‑home profitability. The experience locks in brand leadership and drives repeat/lifetime value, but sustaining this Star requires ongoing investment in merchandising, AR/VR visualization and staffing. Protect the edge: this is where Star cash is minted.
Resort‑style master‑planned communities
Amenity‑rich, gated, lifestyle‑heavy master‑planned communities are Stars in Toll Brothers’ BCG matrix, concentrated in fast‑growing nodes with strong waitlists in 2024. Toll’s premium brand captures top‑of‑market demand, giving the company share gains and pricing power. Upfront capital needs and long entitlement cycles keep cash intensity elevated. As phases open, scale and the moat deepen, improving returns over time.
Active adult (55+) luxury segments in growth metros
Active adult (55+) luxury in growth metros is a Star: demographic tailwinds as Census projects 65+ to approach 20% of the US population by 2030, and Toll’s premium‑credible positioning drives steady sell‑through and healthy option dollars per home. Success requires ongoing amenity capex and targeted marketing to sustain velocity; keep leaning in as the cohort swells.
- Demographics: 65+ ~20% by 2030
- Positioning: premium credibility
- Economics: steady sell‑through, strong option dollars
- Needs: amenity investment, targeted marketing
Digital lead gen + onsite sales engine
Digital lead gen plus onsite sales ops give Toll Brothers sustained share in an expanding luxury market. Conversion rates and price integrity signal leadership; 2024 backlog around $11B underpins scale and pricing power. Continuous spend in media, CRM, and content is required to maintain momentum; investment pays back and compounds via higher LTV and faster turnover.
- Strong brand + ops = sustained share
- 2024 backlog ~11B; pricing integrity
- High conversion rates = leadership trait
- Continuous media/CRM/content spend required
- Spend compounds into higher LTV
Sun Belt luxury: option margins 30-40%, backlog ~$11B - invest in design, digital, amenities
Stars: Sun Belt luxury, amenity‑rich masterplans and 55+ communities drive high absorption, option margins 30–40% and 2024 backlog ~$11B, supporting pricing power; cash intensity high for land/entitlements. Invest in design studios, digital lead gen and amenities to protect moat and sustain returns as growth normalizes.
| Metric | Value |
|---|---|
| 2024 backlog | ~$11B |
| Option margins | 30–40% |
| Sun Belt pop growth 2020–23 | ~2/3 US growth (Census) |
| 65+ share by 2030 | ~20% |
What is included in the product
Detailed Word Document
BCG review of Toll Brothers’ divisions, mapping Stars, Cash Cows, Question Marks, Dogs with clear invest, hold, divest guidance.
Customizable Excel Spreadsheet
One-page Toll Brothers BCG Matrix neatly maps each business unit to a quadrant, easing portfolio pain points for quick C-suite decisions
Cash Cows
Established Northeast & Mid‑Atlantic luxury communities
Mature, supply‑constrained Northeast and Mid‑Atlantic suburbs with Toll name recognition function as cash cows—lower growth but sticky pricing and predictable closings. Marketing spend is modest and operations repeatable, supporting margins on homes with average selling prices above $1M in 2024. These communities generate steady cash flow to fund growth while maintaining service levels.
In‑house mortgage (Toll Brothers Mortgage Company)
In-house Toll Brothers Mortgage drives high attach rates and recurring fee income, giving Toll better control of the buyer journey and ancillary revenue; Toll reported a homebuilding backlog of about $9.5B in 2024, anchoring steady franchise performance in mature communities. Volume ebbs with interest-rate cycles, but low incremental marketing and process improvements flow straight to the bottom line. Continue optimizing underwriting and cross-sell to lift margins.
Title and property insurance services
Title and property insurance services are ancillary, high‑margin, low‑growth—classic cash cow for Toll Brothers, generating steady fee income while requiring minimal promotional spend. The builder-captive funnel keeps utilization near 100% from new-home closings in 2024, supporting operational excellence and low customer acquisition cost. Proceeds are redeployed into land acquisitions and option deposits to fund growth bets.
Options catalog staples (cabinets, fixtures, flooring tiers)
Options catalog staples (cabinets, fixtures, flooring tiers) are BCG cash cows for Toll Brothers in 2024, delivering reliable take‑rates and streamlined install processes; supply relationships and standardized SKUs keep costs tight. Growth is muted while margins remain healthy, so maintain SKU depth and avoid over‑engineering.
- Category: Cash Cows
- Strength: Standardized SKUs
- Action: Preserve SKUs, limit customization
Brand equity and referrals in core enclaves
Decades of building in affluent ZIP codes give Toll Brothers brand equity that turns trust into sales, cutting customer acquisition costs and reducing need for promotions; average new-home ASP exceeds $1,000,000, anchoring high margins and steady cash flow. This is not a high-growth lever but a dependable profit engine with consistent community traffic and lower incentives. Guarding reputation preserves repeat/referral volumes and free marketing, so bank the cash.
- Brand: strong in luxury enclaves
- Cost: lower CAC, fewer incentives
- Margins: ASP > $1M supports higher margins
- Role: cash cow, steady profits not growth
NE/Mid-Atlantic suburbs: $9.5B backlog, $1M+ ASP
Mature Northeast/Mid‑Atlantic suburbs act as cash cows for Toll Brothers in 2024—sticky pricing, predictable closings and modest marketing preserve margins. Homebuilding backlog ~ $9.5B in 2024 and average selling price > $1M anchor steady cash flow. In‑house mortgage, title and options deliver recurring, low‑growth fee income redeployed into land and deposits.
| Metric | 2024 |
|---|---|
| Homebuilding backlog | $9.5B |
| Avg. selling price (ASP) | > $1M |
| Marketing | Modest |
What You See Is What You Get
Toll Brothers BCG Matrix
The file you're previewing is the exact Toll Brothers BCG Matrix you'll receive after purchase. No watermarks, no demo content—just a fully formatted, strategy-ready report built for clear decision-making. Buy once and download immediately; it's editable, print-ready, and presentation-polished. What you see is what you'll get—no surprises, no extra steps.
Original: $10.00
-65%$10.00
$3.50Description
See the Bigger Picture
Curious how Toll Brothers’ product lines stack up—stars driving growth, cash cows funding expansion, or question marks needing choices? This quick peek hints at where revenue and risk live; the full BCG Matrix gives quadrant-by-quadrant clarity, actionable strategy, and the data you can actually use. Purchase the complete report for a detailed Word narrative plus an Excel summary, ready to present and act on. Get the full picture and stop guessing—make smarter capital and product decisions now.
Stars
Luxury single‑family communities in high‑growth Sun Belt
Fast household formation and inbound migration keep Sun Belt markets hot; the region drove roughly two-thirds of U.S. population growth from 2020–2023 (Census Bureau), and Toll Brothers is a clear luxury category leader there. High absorption at premium price points drives visibility and faster turns, but these projects consume cash for land, labor, and sales centers. Continue smart land buys and targeted marketing to sustain share. Hold share now, harvest later as growth normalizes.
Design‑to‑order premium upgrades & personalization
Buyers in the luxury tier demand choice and Toll Brothers design studios are the showpiece, with take‑rates reported around 70% and option margins roughly 30–40%, materially boosting per‑home profitability. The experience locks in brand leadership and drives repeat/lifetime value, but sustaining this Star requires ongoing investment in merchandising, AR/VR visualization and staffing. Protect the edge: this is where Star cash is minted.
Resort‑style master‑planned communities
Amenity‑rich, gated, lifestyle‑heavy master‑planned communities are Stars in Toll Brothers’ BCG matrix, concentrated in fast‑growing nodes with strong waitlists in 2024. Toll’s premium brand captures top‑of‑market demand, giving the company share gains and pricing power. Upfront capital needs and long entitlement cycles keep cash intensity elevated. As phases open, scale and the moat deepen, improving returns over time.
Active adult (55+) luxury segments in growth metros
Active adult (55+) luxury in growth metros is a Star: demographic tailwinds as Census projects 65+ to approach 20% of the US population by 2030, and Toll’s premium‑credible positioning drives steady sell‑through and healthy option dollars per home. Success requires ongoing amenity capex and targeted marketing to sustain velocity; keep leaning in as the cohort swells.
- Demographics: 65+ ~20% by 2030
- Positioning: premium credibility
- Economics: steady sell‑through, strong option dollars
- Needs: amenity investment, targeted marketing
Digital lead gen + onsite sales engine
Digital lead gen plus onsite sales ops give Toll Brothers sustained share in an expanding luxury market. Conversion rates and price integrity signal leadership; 2024 backlog around $11B underpins scale and pricing power. Continuous spend in media, CRM, and content is required to maintain momentum; investment pays back and compounds via higher LTV and faster turnover.
- Strong brand + ops = sustained share
- 2024 backlog ~11B; pricing integrity
- High conversion rates = leadership trait
- Continuous media/CRM/content spend required
- Spend compounds into higher LTV
Sun Belt luxury: option margins 30-40%, backlog ~$11B - invest in design, digital, amenities
Stars: Sun Belt luxury, amenity‑rich masterplans and 55+ communities drive high absorption, option margins 30–40% and 2024 backlog ~$11B, supporting pricing power; cash intensity high for land/entitlements. Invest in design studios, digital lead gen and amenities to protect moat and sustain returns as growth normalizes.
| Metric | Value |
|---|---|
| 2024 backlog | ~$11B |
| Option margins | 30–40% |
| Sun Belt pop growth 2020–23 | ~2/3 US growth (Census) |
| 65+ share by 2030 | ~20% |
What is included in the product
Detailed Word Document
BCG review of Toll Brothers’ divisions, mapping Stars, Cash Cows, Question Marks, Dogs with clear invest, hold, divest guidance.
Customizable Excel Spreadsheet
One-page Toll Brothers BCG Matrix neatly maps each business unit to a quadrant, easing portfolio pain points for quick C-suite decisions
Cash Cows
Established Northeast & Mid‑Atlantic luxury communities
Mature, supply‑constrained Northeast and Mid‑Atlantic suburbs with Toll name recognition function as cash cows—lower growth but sticky pricing and predictable closings. Marketing spend is modest and operations repeatable, supporting margins on homes with average selling prices above $1M in 2024. These communities generate steady cash flow to fund growth while maintaining service levels.
In‑house mortgage (Toll Brothers Mortgage Company)
In-house Toll Brothers Mortgage drives high attach rates and recurring fee income, giving Toll better control of the buyer journey and ancillary revenue; Toll reported a homebuilding backlog of about $9.5B in 2024, anchoring steady franchise performance in mature communities. Volume ebbs with interest-rate cycles, but low incremental marketing and process improvements flow straight to the bottom line. Continue optimizing underwriting and cross-sell to lift margins.
Title and property insurance services
Title and property insurance services are ancillary, high‑margin, low‑growth—classic cash cow for Toll Brothers, generating steady fee income while requiring minimal promotional spend. The builder-captive funnel keeps utilization near 100% from new-home closings in 2024, supporting operational excellence and low customer acquisition cost. Proceeds are redeployed into land acquisitions and option deposits to fund growth bets.
Options catalog staples (cabinets, fixtures, flooring tiers)
Options catalog staples (cabinets, fixtures, flooring tiers) are BCG cash cows for Toll Brothers in 2024, delivering reliable take‑rates and streamlined install processes; supply relationships and standardized SKUs keep costs tight. Growth is muted while margins remain healthy, so maintain SKU depth and avoid over‑engineering.
- Category: Cash Cows
- Strength: Standardized SKUs
- Action: Preserve SKUs, limit customization
Brand equity and referrals in core enclaves
Decades of building in affluent ZIP codes give Toll Brothers brand equity that turns trust into sales, cutting customer acquisition costs and reducing need for promotions; average new-home ASP exceeds $1,000,000, anchoring high margins and steady cash flow. This is not a high-growth lever but a dependable profit engine with consistent community traffic and lower incentives. Guarding reputation preserves repeat/referral volumes and free marketing, so bank the cash.
- Brand: strong in luxury enclaves
- Cost: lower CAC, fewer incentives
- Margins: ASP > $1M supports higher margins
- Role: cash cow, steady profits not growth
NE/Mid-Atlantic suburbs: $9.5B backlog, $1M+ ASP
Mature Northeast/Mid‑Atlantic suburbs act as cash cows for Toll Brothers in 2024—sticky pricing, predictable closings and modest marketing preserve margins. Homebuilding backlog ~ $9.5B in 2024 and average selling price > $1M anchor steady cash flow. In‑house mortgage, title and options deliver recurring, low‑growth fee income redeployed into land and deposits.
| Metric | 2024 |
|---|---|
| Homebuilding backlog | $9.5B |
| Avg. selling price (ASP) | > $1M |
| Marketing | Modest |
What You See Is What You Get
Toll Brothers BCG Matrix
The file you're previewing is the exact Toll Brothers BCG Matrix you'll receive after purchase. No watermarks, no demo content—just a fully formatted, strategy-ready report built for clear decision-making. Buy once and download immediately; it's editable, print-ready, and presentation-polished. What you see is what you'll get—no surprises, no extra steps.











