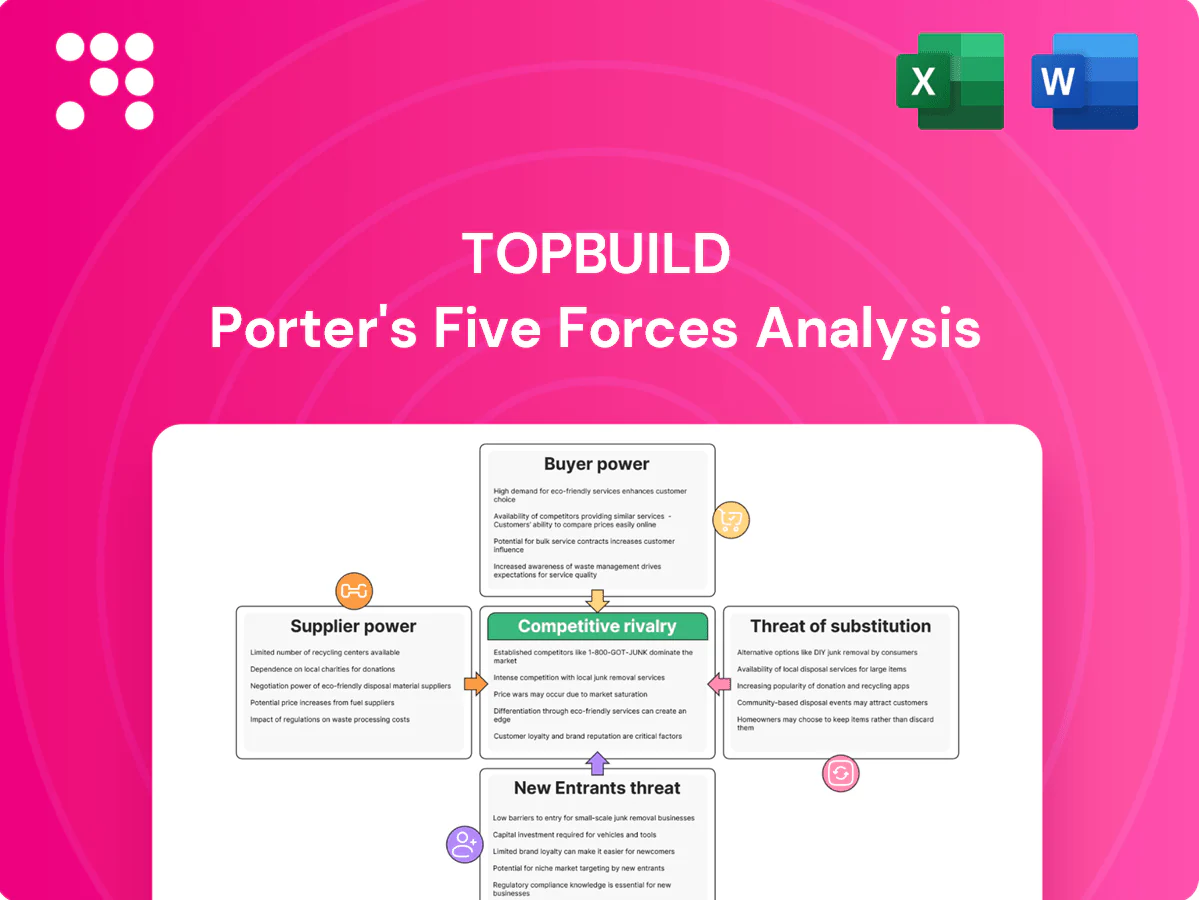
TopBuild Porter's Five Forces Analysis

Elevate Your Analysis with the Complete Porter's Five Forces Analysis
TopBuild faces moderate supplier power, steady buyer demand, and tangible threats from substitutes and new entrants that shape its margins and growth potential; competitive rivalry remains intense in insulation and HVAC distribution. This brief snapshot only scratches the surface—unlock the full Porter's Five Forces Analysis to explore TopBuild’s competitive dynamics, market pressures, and strategic advantages in detail.
Suppliers Bargaining Power

Concentrated insulation manufacturers
Core inputs like fiberglass, mineral wool and spray-foam chemicals are supplied mainly by a few large firms; in 2024 Owens Corning, Johns Manville and Knauf remained primary global suppliers, giving suppliers pricing and allocation leverage in peak cycles. TopBuild’s national scale, multi-sourcing strategies and distribution network reduce single-vendor dependence. Long-term contracts and volume commitments secure priority allocations and rebate structures, softening supplier power.
Commodity and chemical price volatility
Commodity and chemical price volatility for inputs like resins, MDI, polyols, glass and energy increases suppliers’ leverage as costs tied to petrochemical and energy markets rise and are frequently passed through, squeezing margins. TopBuild combats this with targeted pricing actions, product mix management and centralized procurement programs to smooth cost spikes. Timing gaps between input inflation and customer price resets create short-term supplier power swings.

Private label and value engineering
TopBuild (BLD) leverages private-label sourcing and value engineering to shift volume from premium SKUs, reducing supplier dependence; in 2024 this strategy supported cost control alongside roughly $4.7 billion in revenue. By substituting equivalent products TopBuild can arbitrage cost and availability, weakening supplier leverage in negotiations. Project-level specification control further amplifies this buying power and margin protection.

Logistics and capacity constraints
Insulation’s bulky volume raises freight sensitivity and regional availability; tight trucking and plant capacity give upstream suppliers leverage through lead-time control, affecting installation schedules for TopBuild (ticker BLD).
TopBuild’s national Service Partner distribution network enables pooling and cross-branch inventory transfers, which mitigate localized constraints and soften supplier bargaining power.
- freight-sensitive bulk product
- lead-time as supplier leverage
- national footprint enables inventory balancing
Technical support and warranties
Some insulation and HVAC components require OEM training, certifications, and warranty backing, creating switching frictions suppliers can exploit; suppliers may condition warranties on certified installers. TopBuild’s installer expertise and breadth of certifications reduce lock-in risk; in 2024 TopBuild employed roughly 11,000 field technicians, supporting multi-brand installs. Multi-brand capability preserves choice and bargaining leverage.
- OEM certifications increase switching costs
- TopBuild ~11,000 technicians (2024)
- Breadth of certifications lowers supplier lock-in
- Multi-brand capability sustains bargaining power
National scale, multi-sourcing and pricing power mitigate supplier concentration risks
TopBuild faces concentrated supplier power for fiberglass, mineral wool and spray-foam chemicals (Owens Corning, Johns Manville, Knauf) but offsets this via national scale, multi-sourcing, private-labeling and long-term contracts. Freight/lead-time sensitivity and chemical price volatility raise supplier leverage seasonally; TopBuild’s pricing actions and centralized procurement mitigate margin pressure. Broad installer base (~11,000 technicians) and $4.7B 2024 revenue preserve negotiating flexibility.
| Metric | 2024 |
|---|---|
| Revenue | $4.7B |
| Field technicians | ~11,000 |
| Primary suppliers | Owens Corning; Johns Manville; Knauf |
| Key risks | Commodity & freight volatility, lead times |
What is included in the product
 Detailed Word Document
Tailored Porter's Five Forces analysis for TopBuild that uncovers competitive drivers, supplier and customer influence on pricing, barriers deterring new entrants, substitutes and disruptive threats, and strategic implications for sustaining market share and profitability.

 Customizable Excel Spreadsheet
Compact one-sheet Porter's Five Forces for TopBuild with an instant radar view—clearly flags supplier, buyer, rivalry, entry and substitute pressures so teams can prioritize strategic fixes fast.
Customers Bargaining Power

Large national builders and GCs
Large national builders and GCs negotiate aggressively via competitive bids, strict SLAs and rebate demands. Their scale elevates buyer power and compresses supplier margins; in 2024 D.R. Horton remained the largest U.S. homebuilder by closings, underscoring concentrated buyer leverage. Multi-year relationships and bundled services help TopBuild defend price and protect margins.
Project-based bidding and low switching costs
Installation contracts are largely awarded per project or subdivision, and in 2024 TopBuild reported roughly $5.1 billion in revenue, reflecting intense competitive bidding; abundant qualified installers in many markets lower switching costs and keep pricing disciplined, making on-time performance critical. Differentiation therefore depends on proven reliability, rigorous safety records, and scalable capacity to win repeat work.

Code-driven performance requirements
Energy codes and specifications increasingly constrain product choices, reducing room for price haggling as installers must meet mandated R-values and compliance paths. Buyers for 2024 projects prioritize total installed cost and schedule adherence within those R-value requirements. Value engineering within code-compliant options becomes the negotiation arena, while demonstrable energy performance can justify premiums given buildings account for about 40% of U.S. energy use (DOE, 2024).

End-market cyclicality
End-market cyclicality shifts customer bargaining power: in downturns buyers gain leverage amid excess capacity, while upcycles with labor tightness and longer lead times return leverage to installers and contractors. TopBuild’s diversified mix across residential, commercial, and retrofit smooths volatility and allows margin capture. National footprint enables redeploying crews to higher-margin regions when demand is uneven.
- Downturns: buyer leverage rises
- Upcycles: installer leverage via labor/lead times
- Mix: residential/commercial/retrofit balances exposure
- National coverage: allocates resources to higher-margin demand
Service bundling and one-stop shop
TopBuild leverages service bundling—combining insulation with complementary materials and installation services—to raise customer stickiness; as of 2024 TopBuild is the largest insulation installer in the US. Fewer vendors and coordinated schedules reduce effective switching and compress buyer bargaining power, while measured performance metrics and warranty programs further entrench customer relationships.
- Fewer vendors → lower switching
- Coordinated schedules → higher project value
- Warranties/metrics → deeper retention
Builders compress supplier margins; top installer posts $5.1B
Large national builders wield strong bargaining power via competitive bids and SLAs, compressing supplier margins. TopBuild reported $5.1B revenue in 2024 and uses bundling and national scale to defend pricing. Energy codes (buildings ~40% US energy use, DOE 2024) shift negotiations toward total installed cost and compliance.
| Metric | 2024 |
|---|---|
| TopBuild revenue | $5.1B |
| Market role | Largest US insulation installer |
| Energy share | ~40% (DOE) |
Preview the Actual Deliverable
TopBuild Porter's Five Forces Analysis
This preview shows the exact TopBuild Porter's Five Forces Analysis you'll receive—no surprises, no placeholders. The document displayed here is the part of the full, professionally formatted report you’ll get instantly after purchase. You're looking at the actual file, ready for download and immediate use.

Elevate Your Analysis with the Complete Porter's Five Forces Analysis
TopBuild faces moderate supplier power, steady buyer demand, and tangible threats from substitutes and new entrants that shape its margins and growth potential; competitive rivalry remains intense in insulation and HVAC distribution. This brief snapshot only scratches the surface—unlock the full Porter's Five Forces Analysis to explore TopBuild’s competitive dynamics, market pressures, and strategic advantages in detail.
Suppliers Bargaining Power
Concentrated insulation manufacturers
Core inputs like fiberglass, mineral wool and spray-foam chemicals are supplied mainly by a few large firms; in 2024 Owens Corning, Johns Manville and Knauf remained primary global suppliers, giving suppliers pricing and allocation leverage in peak cycles. TopBuild’s national scale, multi-sourcing strategies and distribution network reduce single-vendor dependence. Long-term contracts and volume commitments secure priority allocations and rebate structures, softening supplier power.
Commodity and chemical price volatility
Commodity and chemical price volatility for inputs like resins, MDI, polyols, glass and energy increases suppliers’ leverage as costs tied to petrochemical and energy markets rise and are frequently passed through, squeezing margins. TopBuild combats this with targeted pricing actions, product mix management and centralized procurement programs to smooth cost spikes. Timing gaps between input inflation and customer price resets create short-term supplier power swings.
Private label and value engineering
TopBuild (BLD) leverages private-label sourcing and value engineering to shift volume from premium SKUs, reducing supplier dependence; in 2024 this strategy supported cost control alongside roughly $4.7 billion in revenue. By substituting equivalent products TopBuild can arbitrage cost and availability, weakening supplier leverage in negotiations. Project-level specification control further amplifies this buying power and margin protection.
Logistics and capacity constraints
Insulation’s bulky volume raises freight sensitivity and regional availability; tight trucking and plant capacity give upstream suppliers leverage through lead-time control, affecting installation schedules for TopBuild (ticker BLD).
TopBuild’s national Service Partner distribution network enables pooling and cross-branch inventory transfers, which mitigate localized constraints and soften supplier bargaining power.
- freight-sensitive bulk product
- lead-time as supplier leverage
- national footprint enables inventory balancing
Technical support and warranties
Some insulation and HVAC components require OEM training, certifications, and warranty backing, creating switching frictions suppliers can exploit; suppliers may condition warranties on certified installers. TopBuild’s installer expertise and breadth of certifications reduce lock-in risk; in 2024 TopBuild employed roughly 11,000 field technicians, supporting multi-brand installs. Multi-brand capability preserves choice and bargaining leverage.
- OEM certifications increase switching costs
- TopBuild ~11,000 technicians (2024)
- Breadth of certifications lowers supplier lock-in
- Multi-brand capability sustains bargaining power
National scale, multi-sourcing and pricing power mitigate supplier concentration risks
TopBuild faces concentrated supplier power for fiberglass, mineral wool and spray-foam chemicals (Owens Corning, Johns Manville, Knauf) but offsets this via national scale, multi-sourcing, private-labeling and long-term contracts. Freight/lead-time sensitivity and chemical price volatility raise supplier leverage seasonally; TopBuild’s pricing actions and centralized procurement mitigate margin pressure. Broad installer base (~11,000 technicians) and $4.7B 2024 revenue preserve negotiating flexibility.
| Metric | 2024 |
|---|---|
| Revenue | $4.7B |
| Field technicians | ~11,000 |
| Primary suppliers | Owens Corning; Johns Manville; Knauf |
| Key risks | Commodity & freight volatility, lead times |
What is included in the product
Detailed Word Document
Tailored Porter's Five Forces analysis for TopBuild that uncovers competitive drivers, supplier and customer influence on pricing, barriers deterring new entrants, substitutes and disruptive threats, and strategic implications for sustaining market share and profitability.
Customizable Excel Spreadsheet
Compact one-sheet Porter's Five Forces for TopBuild with an instant radar view—clearly flags supplier, buyer, rivalry, entry and substitute pressures so teams can prioritize strategic fixes fast.
Customers Bargaining Power
Large national builders and GCs
Large national builders and GCs negotiate aggressively via competitive bids, strict SLAs and rebate demands. Their scale elevates buyer power and compresses supplier margins; in 2024 D.R. Horton remained the largest U.S. homebuilder by closings, underscoring concentrated buyer leverage. Multi-year relationships and bundled services help TopBuild defend price and protect margins.
Project-based bidding and low switching costs
Installation contracts are largely awarded per project or subdivision, and in 2024 TopBuild reported roughly $5.1 billion in revenue, reflecting intense competitive bidding; abundant qualified installers in many markets lower switching costs and keep pricing disciplined, making on-time performance critical. Differentiation therefore depends on proven reliability, rigorous safety records, and scalable capacity to win repeat work.
Code-driven performance requirements
Energy codes and specifications increasingly constrain product choices, reducing room for price haggling as installers must meet mandated R-values and compliance paths. Buyers for 2024 projects prioritize total installed cost and schedule adherence within those R-value requirements. Value engineering within code-compliant options becomes the negotiation arena, while demonstrable energy performance can justify premiums given buildings account for about 40% of U.S. energy use (DOE, 2024).
End-market cyclicality
End-market cyclicality shifts customer bargaining power: in downturns buyers gain leverage amid excess capacity, while upcycles with labor tightness and longer lead times return leverage to installers and contractors. TopBuild’s diversified mix across residential, commercial, and retrofit smooths volatility and allows margin capture. National footprint enables redeploying crews to higher-margin regions when demand is uneven.
- Downturns: buyer leverage rises
- Upcycles: installer leverage via labor/lead times
- Mix: residential/commercial/retrofit balances exposure
- National coverage: allocates resources to higher-margin demand
Service bundling and one-stop shop
TopBuild leverages service bundling—combining insulation with complementary materials and installation services—to raise customer stickiness; as of 2024 TopBuild is the largest insulation installer in the US. Fewer vendors and coordinated schedules reduce effective switching and compress buyer bargaining power, while measured performance metrics and warranty programs further entrench customer relationships.
- Fewer vendors → lower switching
- Coordinated schedules → higher project value
- Warranties/metrics → deeper retention
Builders compress supplier margins; top installer posts $5.1B
Large national builders wield strong bargaining power via competitive bids and SLAs, compressing supplier margins. TopBuild reported $5.1B revenue in 2024 and uses bundling and national scale to defend pricing. Energy codes (buildings ~40% US energy use, DOE 2024) shift negotiations toward total installed cost and compliance.
| Metric | 2024 |
|---|---|
| TopBuild revenue | $5.1B |
| Market role | Largest US insulation installer |
| Energy share | ~40% (DOE) |
Preview the Actual Deliverable
TopBuild Porter's Five Forces Analysis
This preview shows the exact TopBuild Porter's Five Forces Analysis you'll receive—no surprises, no placeholders. The document displayed here is the part of the full, professionally formatted report you’ll get instantly after purchase. You're looking at the actual file, ready for download and immediate use.
Description
Elevate Your Analysis with the Complete Porter's Five Forces Analysis
TopBuild faces moderate supplier power, steady buyer demand, and tangible threats from substitutes and new entrants that shape its margins and growth potential; competitive rivalry remains intense in insulation and HVAC distribution. This brief snapshot only scratches the surface—unlock the full Porter's Five Forces Analysis to explore TopBuild’s competitive dynamics, market pressures, and strategic advantages in detail.
Suppliers Bargaining Power
Concentrated insulation manufacturers
Core inputs like fiberglass, mineral wool and spray-foam chemicals are supplied mainly by a few large firms; in 2024 Owens Corning, Johns Manville and Knauf remained primary global suppliers, giving suppliers pricing and allocation leverage in peak cycles. TopBuild’s national scale, multi-sourcing strategies and distribution network reduce single-vendor dependence. Long-term contracts and volume commitments secure priority allocations and rebate structures, softening supplier power.
Commodity and chemical price volatility
Commodity and chemical price volatility for inputs like resins, MDI, polyols, glass and energy increases suppliers’ leverage as costs tied to petrochemical and energy markets rise and are frequently passed through, squeezing margins. TopBuild combats this with targeted pricing actions, product mix management and centralized procurement programs to smooth cost spikes. Timing gaps between input inflation and customer price resets create short-term supplier power swings.
Private label and value engineering
TopBuild (BLD) leverages private-label sourcing and value engineering to shift volume from premium SKUs, reducing supplier dependence; in 2024 this strategy supported cost control alongside roughly $4.7 billion in revenue. By substituting equivalent products TopBuild can arbitrage cost and availability, weakening supplier leverage in negotiations. Project-level specification control further amplifies this buying power and margin protection.
Logistics and capacity constraints
Insulation’s bulky volume raises freight sensitivity and regional availability; tight trucking and plant capacity give upstream suppliers leverage through lead-time control, affecting installation schedules for TopBuild (ticker BLD).
TopBuild’s national Service Partner distribution network enables pooling and cross-branch inventory transfers, which mitigate localized constraints and soften supplier bargaining power.
- freight-sensitive bulk product
- lead-time as supplier leverage
- national footprint enables inventory balancing
Technical support and warranties
Some insulation and HVAC components require OEM training, certifications, and warranty backing, creating switching frictions suppliers can exploit; suppliers may condition warranties on certified installers. TopBuild’s installer expertise and breadth of certifications reduce lock-in risk; in 2024 TopBuild employed roughly 11,000 field technicians, supporting multi-brand installs. Multi-brand capability preserves choice and bargaining leverage.
- OEM certifications increase switching costs
- TopBuild ~11,000 technicians (2024)
- Breadth of certifications lowers supplier lock-in
- Multi-brand capability sustains bargaining power
National scale, multi-sourcing and pricing power mitigate supplier concentration risks
TopBuild faces concentrated supplier power for fiberglass, mineral wool and spray-foam chemicals (Owens Corning, Johns Manville, Knauf) but offsets this via national scale, multi-sourcing, private-labeling and long-term contracts. Freight/lead-time sensitivity and chemical price volatility raise supplier leverage seasonally; TopBuild’s pricing actions and centralized procurement mitigate margin pressure. Broad installer base (~11,000 technicians) and $4.7B 2024 revenue preserve negotiating flexibility.
| Metric | 2024 |
|---|---|
| Revenue | $4.7B |
| Field technicians | ~11,000 |
| Primary suppliers | Owens Corning; Johns Manville; Knauf |
| Key risks | Commodity & freight volatility, lead times |
What is included in the product
Detailed Word Document
Tailored Porter's Five Forces analysis for TopBuild that uncovers competitive drivers, supplier and customer influence on pricing, barriers deterring new entrants, substitutes and disruptive threats, and strategic implications for sustaining market share and profitability.
Customizable Excel Spreadsheet
Compact one-sheet Porter's Five Forces for TopBuild with an instant radar view—clearly flags supplier, buyer, rivalry, entry and substitute pressures so teams can prioritize strategic fixes fast.
Customers Bargaining Power
Large national builders and GCs
Large national builders and GCs negotiate aggressively via competitive bids, strict SLAs and rebate demands. Their scale elevates buyer power and compresses supplier margins; in 2024 D.R. Horton remained the largest U.S. homebuilder by closings, underscoring concentrated buyer leverage. Multi-year relationships and bundled services help TopBuild defend price and protect margins.
Project-based bidding and low switching costs
Installation contracts are largely awarded per project or subdivision, and in 2024 TopBuild reported roughly $5.1 billion in revenue, reflecting intense competitive bidding; abundant qualified installers in many markets lower switching costs and keep pricing disciplined, making on-time performance critical. Differentiation therefore depends on proven reliability, rigorous safety records, and scalable capacity to win repeat work.
Code-driven performance requirements
Energy codes and specifications increasingly constrain product choices, reducing room for price haggling as installers must meet mandated R-values and compliance paths. Buyers for 2024 projects prioritize total installed cost and schedule adherence within those R-value requirements. Value engineering within code-compliant options becomes the negotiation arena, while demonstrable energy performance can justify premiums given buildings account for about 40% of U.S. energy use (DOE, 2024).
End-market cyclicality
End-market cyclicality shifts customer bargaining power: in downturns buyers gain leverage amid excess capacity, while upcycles with labor tightness and longer lead times return leverage to installers and contractors. TopBuild’s diversified mix across residential, commercial, and retrofit smooths volatility and allows margin capture. National footprint enables redeploying crews to higher-margin regions when demand is uneven.
- Downturns: buyer leverage rises
- Upcycles: installer leverage via labor/lead times
- Mix: residential/commercial/retrofit balances exposure
- National coverage: allocates resources to higher-margin demand
Service bundling and one-stop shop
TopBuild leverages service bundling—combining insulation with complementary materials and installation services—to raise customer stickiness; as of 2024 TopBuild is the largest insulation installer in the US. Fewer vendors and coordinated schedules reduce effective switching and compress buyer bargaining power, while measured performance metrics and warranty programs further entrench customer relationships.
- Fewer vendors → lower switching
- Coordinated schedules → higher project value
- Warranties/metrics → deeper retention
Builders compress supplier margins; top installer posts $5.1B
Large national builders wield strong bargaining power via competitive bids and SLAs, compressing supplier margins. TopBuild reported $5.1B revenue in 2024 and uses bundling and national scale to defend pricing. Energy codes (buildings ~40% US energy use, DOE 2024) shift negotiations toward total installed cost and compliance.
| Metric | 2024 |
|---|---|
| TopBuild revenue | $5.1B |
| Market role | Largest US insulation installer |
| Energy share | ~40% (DOE) |
Preview the Actual Deliverable
TopBuild Porter's Five Forces Analysis
This preview shows the exact TopBuild Porter's Five Forces Analysis you'll receive—no surprises, no placeholders. The document displayed here is the part of the full, professionally formatted report you’ll get instantly after purchase. You're looking at the actual file, ready for download and immediate use.











